
Crypto Market Overview | bearish price action meets surging derivatives volume amid macro headwinds | June 23, 2026
Crypto Market Overview | bearish price action meets surging derivatives volume amid macro headwinds | June 23, 2026
Market overview
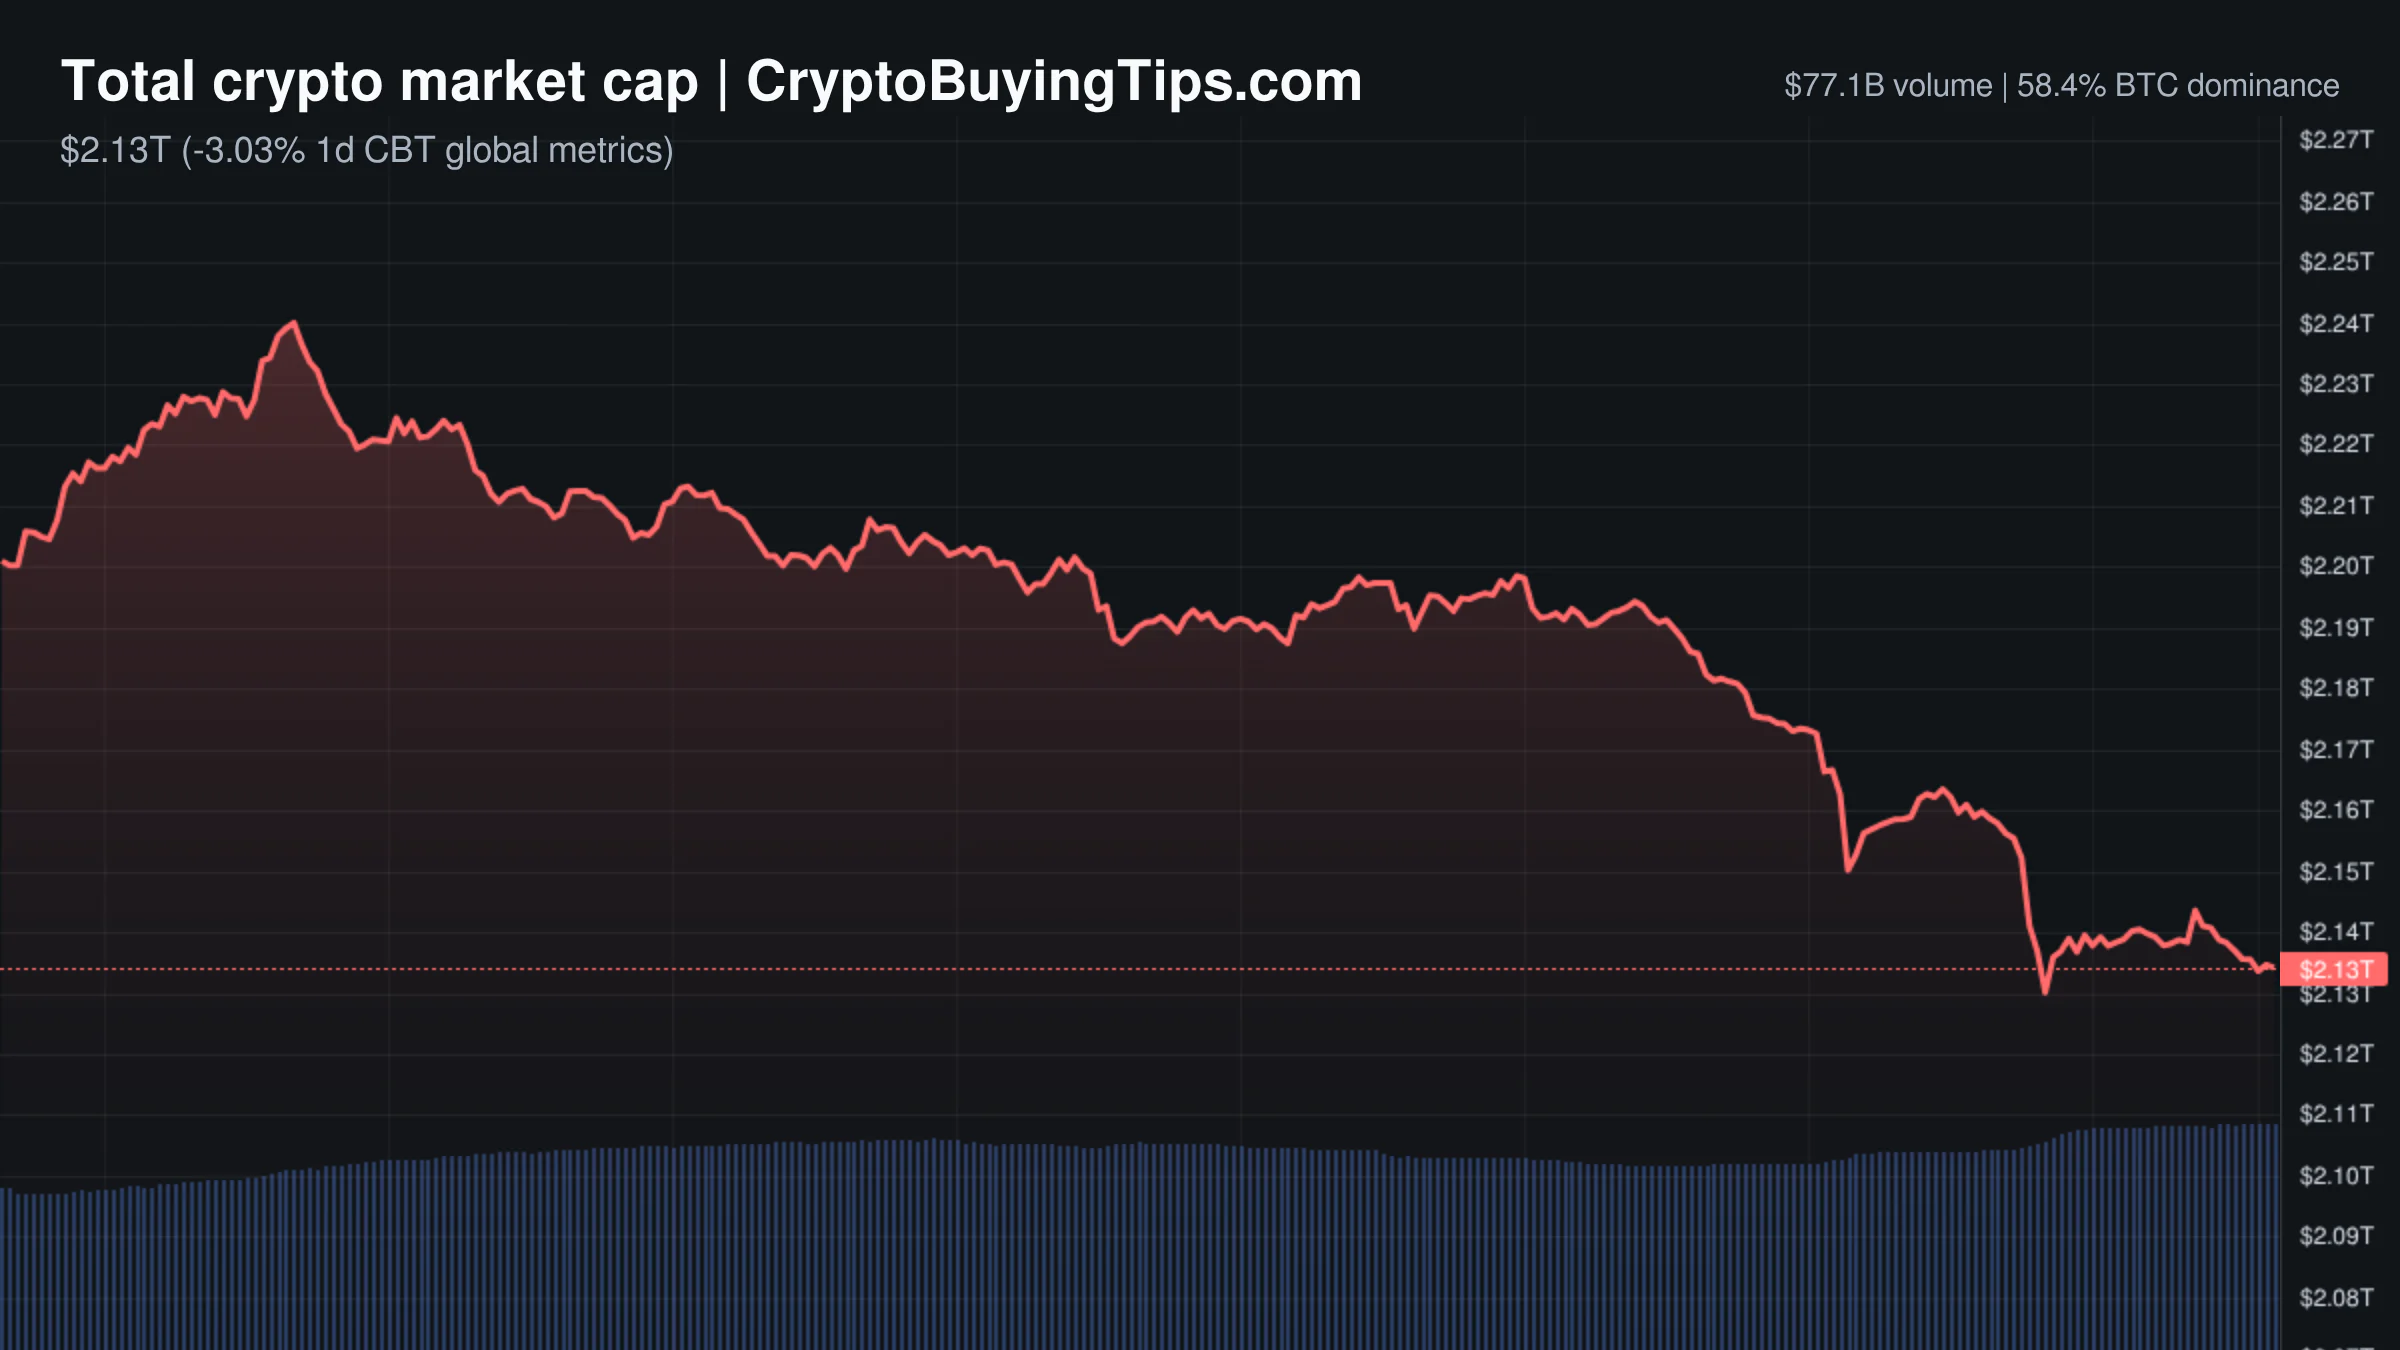
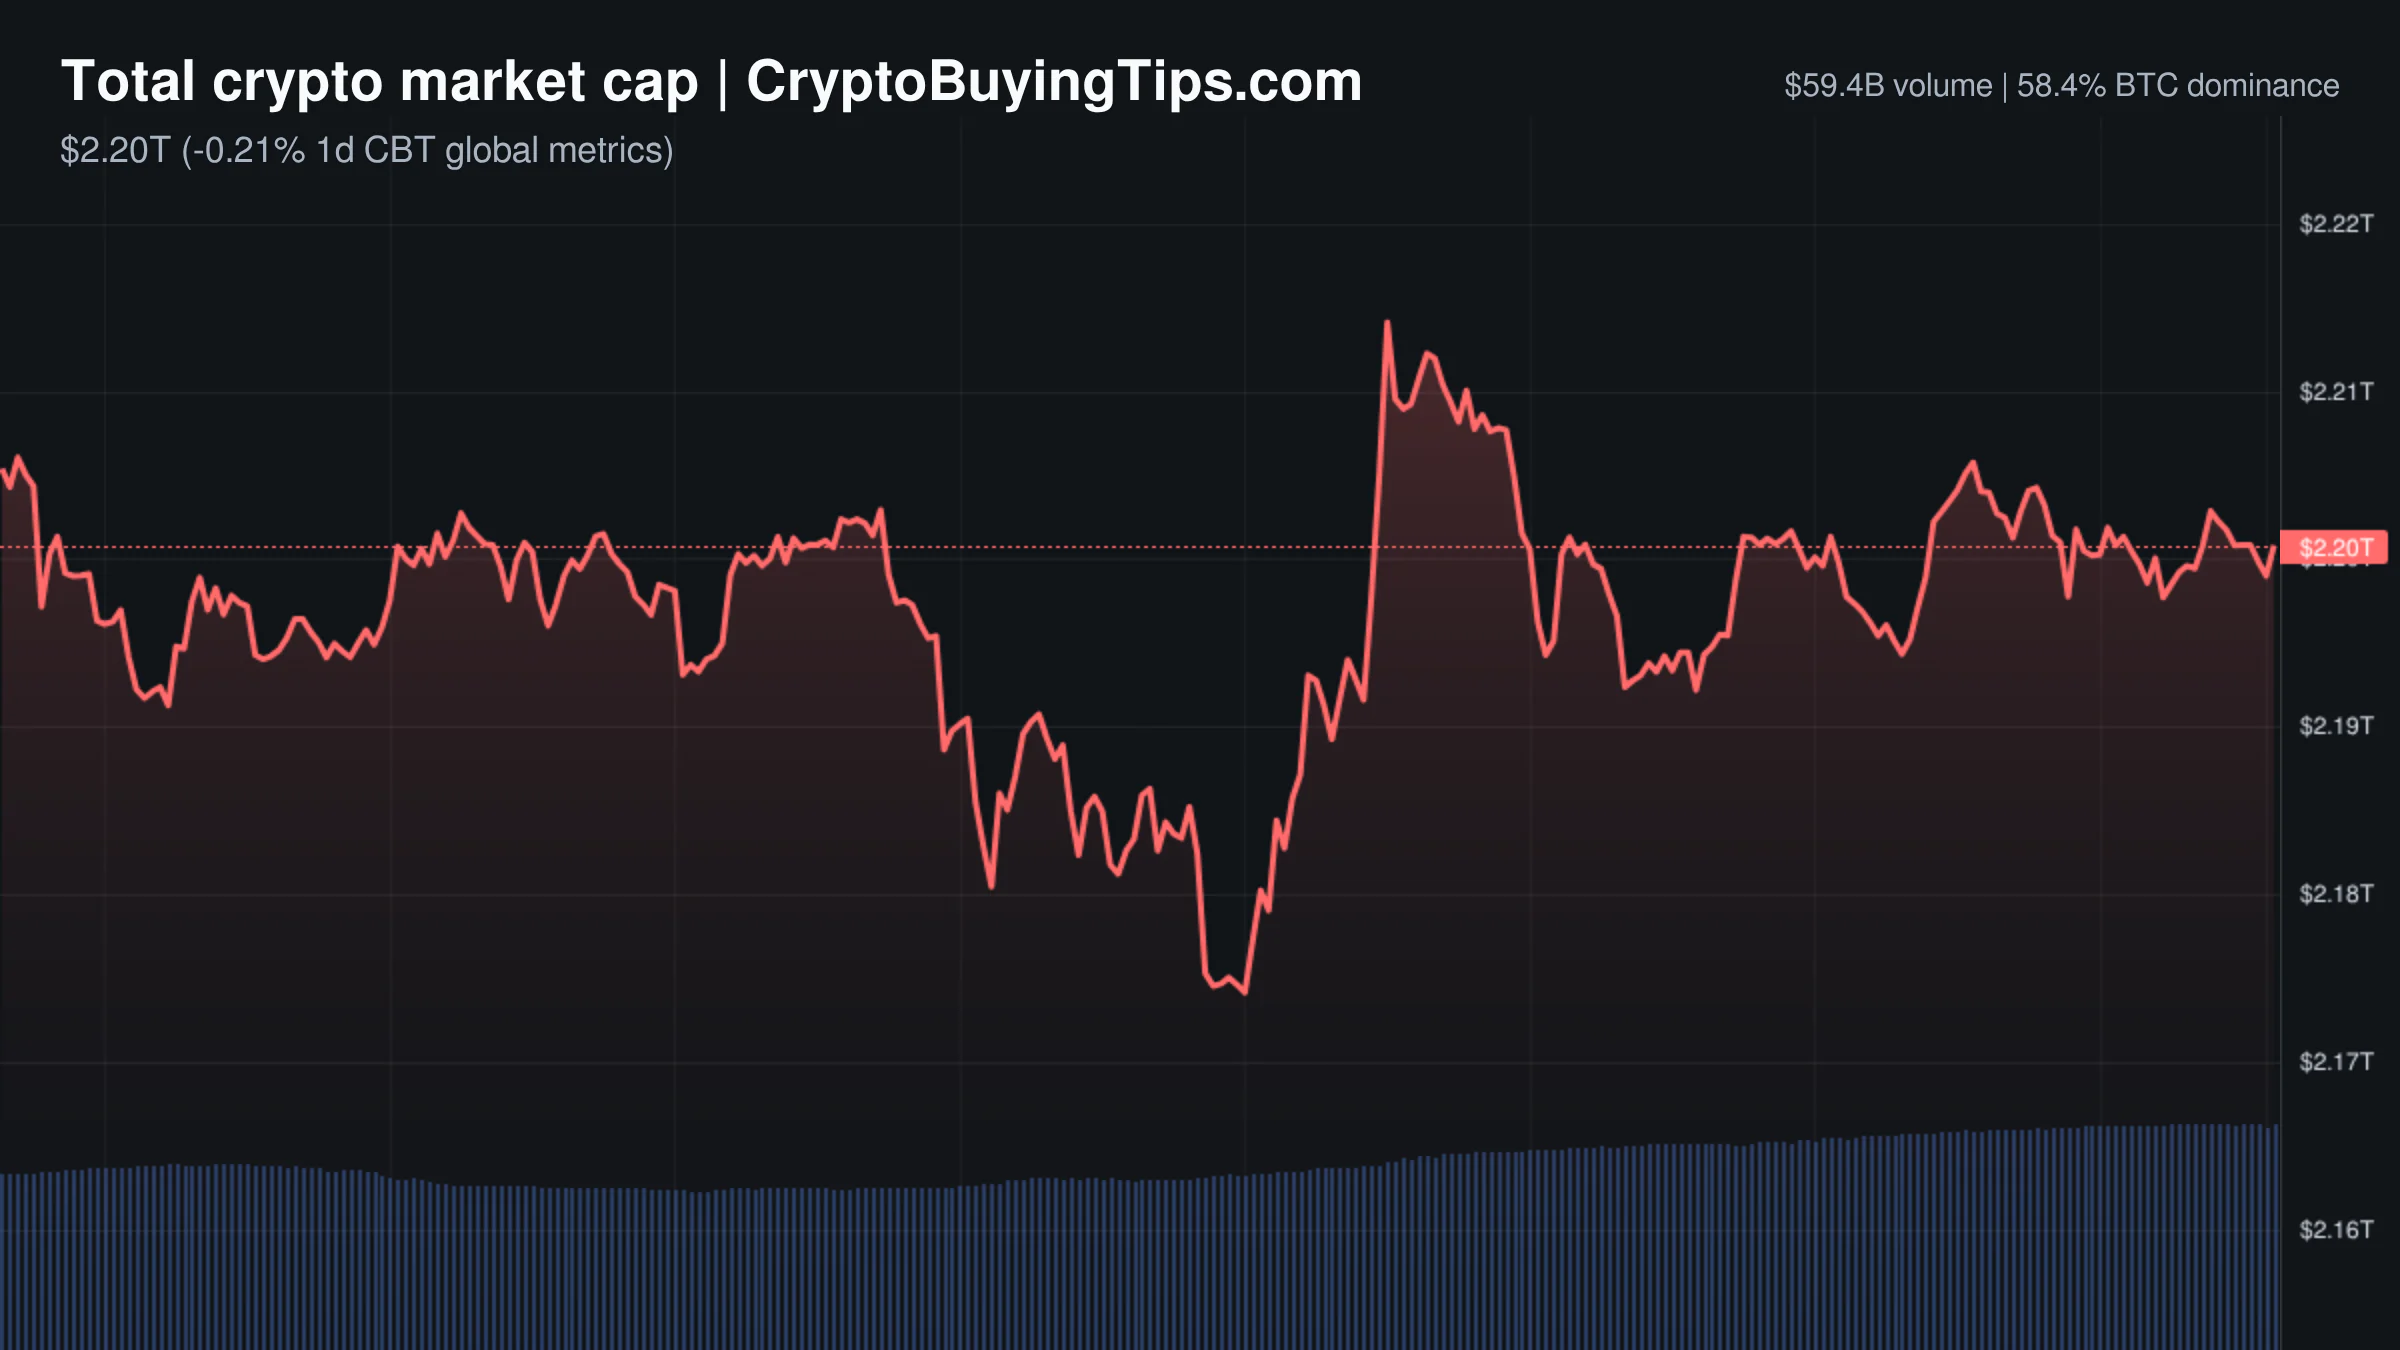
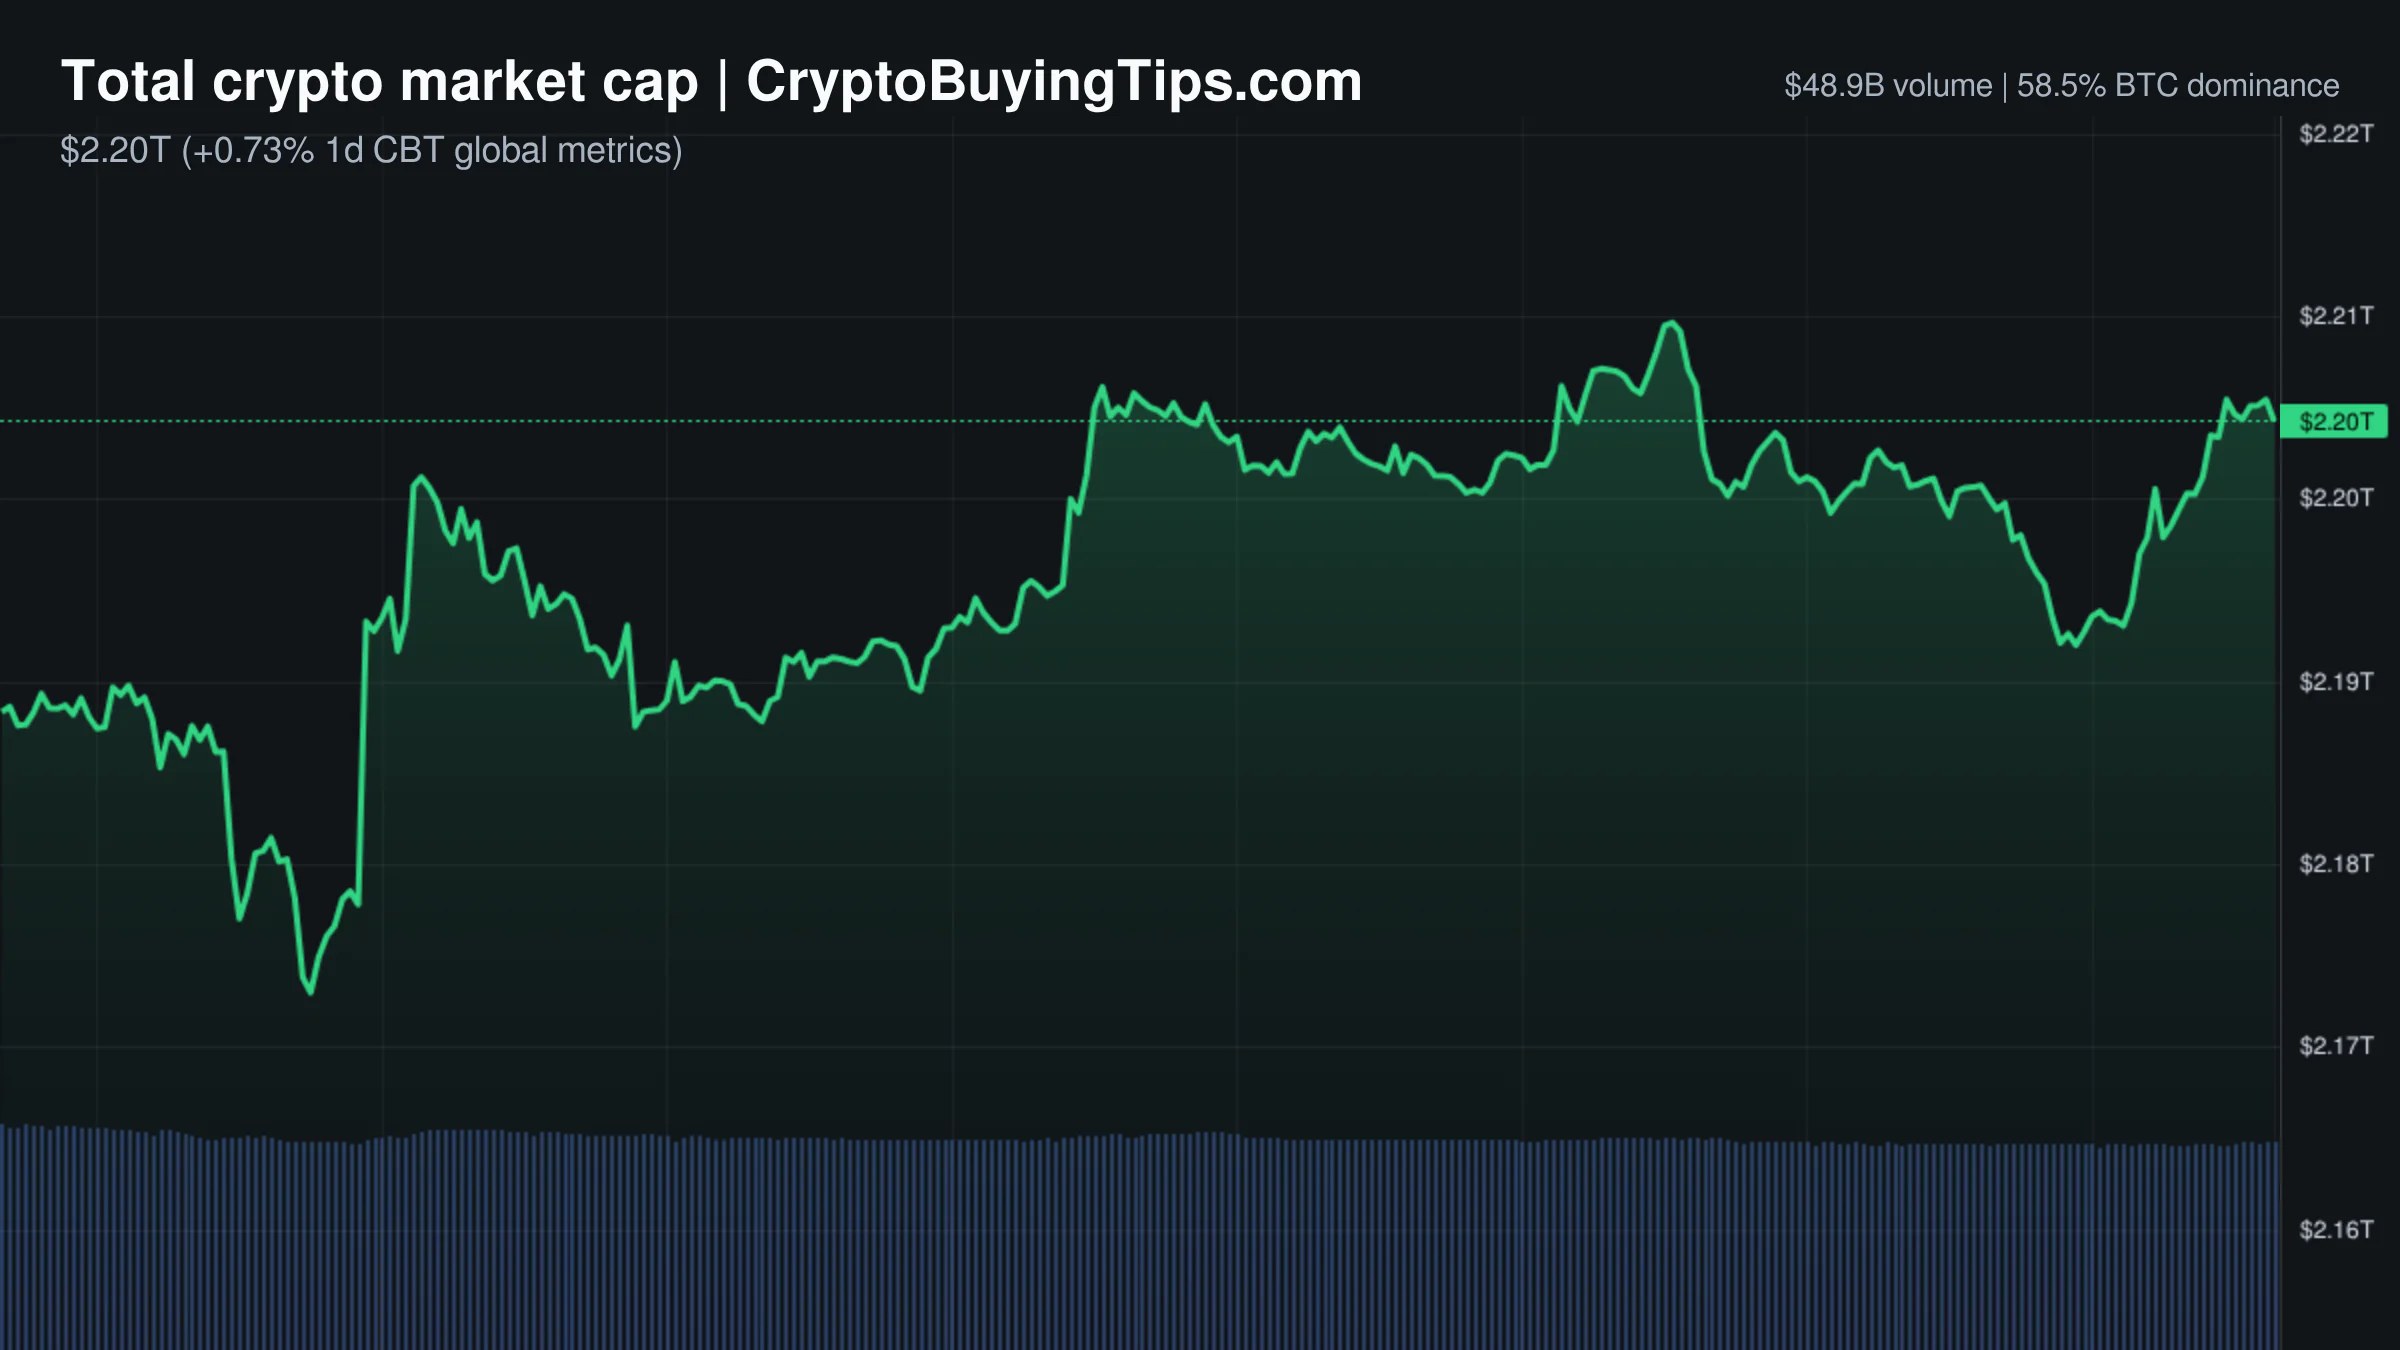
The crypto market is currently experiencing a violent contradiction. While the total market cap has slipped to $2.22T, down nearly 3% in 24 hours, trading activity has exploded. We are seeing a massive divergence where price action is bearish but volume is surging, particularly in the derivatives space. Derivatives volume has climbed 44.73% to $793.73B, which completely dwarfs spot trading. This suggests that the current move is not a quiet exit, but a high-conviction battle between aggressive sellers and those attempting to catch a falling knife.
Sentiment has plummeted to a Fear and Greed score of 19, placing the market in a state of extreme fear. Historically, this level of pessimism often signals a capitulation phase, yet the Altcoin Season Index remains neutral at 47. This indicates a lack of clear rotation; money is not flowing into alts as a hedge, nor is it aggressively piling into Bitcoin for safety. Instead, the market is stuck in a transition.
The macro backdrop is equally oppressive. The U.S. dollar has surged to a one-year high, with the DXY hitting 101.186. This move is driven by safe-haven demand and rising expectations for Federal Reserve rate hikes. When the dollar rips and tech stocks sell off, risk assets typically suffer. The S&P 500 and NASDAQ are both trading in the red, dragging the crypto market down with them. Stablecoin dominance sits at 11.74%, suggesting a decent amount of capital is sitting on the sidelines, waiting for a definitive floor.
Bitcoin and Ethereum
Bitcoin is struggling to maintain its footing, recently sliding to a two-week low of $61,877. The price action is being hammered by a combination of a broader tech selloff and significant institutional outflows, with Bitcoin ETFs seeing $2.4 billion in outflows during June. Despite this, there is a glimmer of on-chain resilience. Data from analysts suggests that "OG selling" has slowed to its lowest level since November 2024. The long-term holders are staying put, even as the ETFs bleed.
Ethereum is in a more precarious position. Its dominance has dipped to 8.96%, and the network state is eerily quiet. Gas fees have dropped to 0.21 Gwei, which is a sign of extremely low on-chain activity. When the "world computer" has no one using it, the fundamental bid weakens. ETH is currently caught in the same risk-off tide as the rest of the market, failing to provide any structural support for the broader altcoin ecosystem.
Top crypto prices
The broader market is feeling the weight of the current selloff. The CMC20 and CMC100 indices are both down over 3.4% in the last 24 hours. While specific top-coin price lists are unavailable, the general trend is clear: the market is bleeding across the board. The Total2 market cap, which excludes Bitcoin, now stands at $973.3B, while Total3 (excluding both BTC and ETH) has fallen to $774.3B.
News driving today's market
The dominant narrative today is the U.S. Senate's passage of a housing supply bill that includes a ban on the Federal Reserve issuing a central bank digital currency (CBDC) until 2030. The bill passed with a crushing 85-5 vote. There is a split in how the market is reading this. Some view the ban as a bearish signal of regulatory uncertainty, while others see it as a massive win for decentralized assets. If the government is blocked from creating its own digital dollar, the utility of decentralized alternatives becomes more apparent. We previously covered Bank of Japan raised rates for more background.
Simultaneously, the White House has issued executive orders to accelerate U.S. development of quantum computers while mandating a migration to post-quantum cryptography by 2031. This is a double-edged sword. While government investment in cryptography is a long-term tailwind, a hard deadline for migration creates a massive technical hurdle for blockchain protocols.
In the UK, the Bank of England is easing stablecoin rules, replacing individual holding caps with a £40 billion issuance limit. This move toward institutional integration is a positive sign for the plumbing of the industry. We are also seeing a push toward tokenized securities, with ICE and OKX teaming up to bring these assets to Wall Street. We previously covered how the volume data suggests fight in recent weeks, and these institutional moves suggest the fight is moving toward the infrastructure layer.
Social intelligence
On-chain data is providing a few anomalies in an otherwise bleak picture. Tron has reached 3.93 million active addresses in the past 24 hours, far outpacing other chains in terms of raw user engagement. This suggests that while the "investment" side of crypto is panicking, the "utility" side of specific networks remains active.
The macro-social sentiment is dominated by the U.S. dollar's strength. With the DXY at a one-year high and the euro hitting a 10-month low, the global financial system is in a clear risk-off mode. This is compounded by concerns over excessive AI infrastructure spending, which is fueling the selloff in tech stocks and, by extension, the crypto market.
Trading ideas worth watching
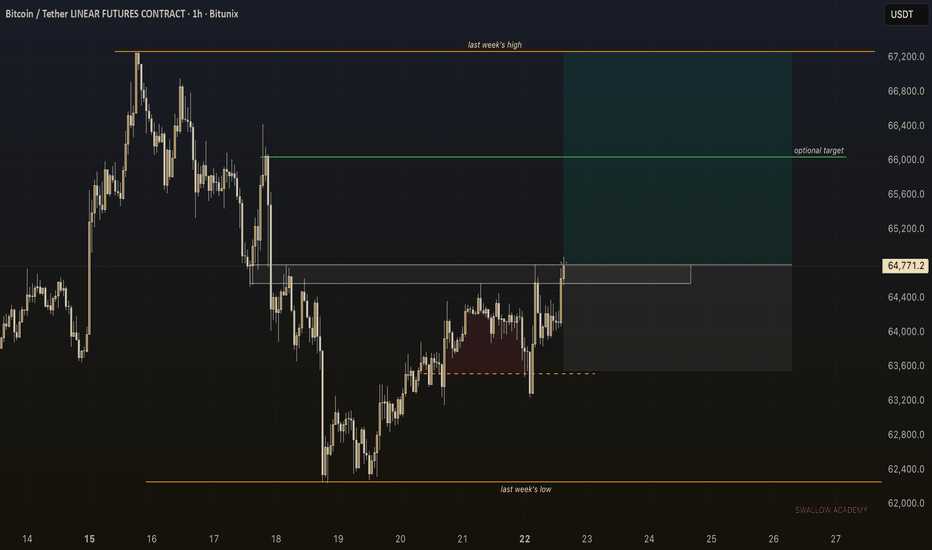
There is a stark divide in current Bitcoin setups. On one hand, some analysts are eyeing a bullish breakout attempt at the 64.6k to 65k resistance zone. The theory here is that the weekend gap was filled quickly, removing a downside magnet and leaving the path open for a move toward 66k. This is a momentum play that requires a decisive hold above 65k to be valid.
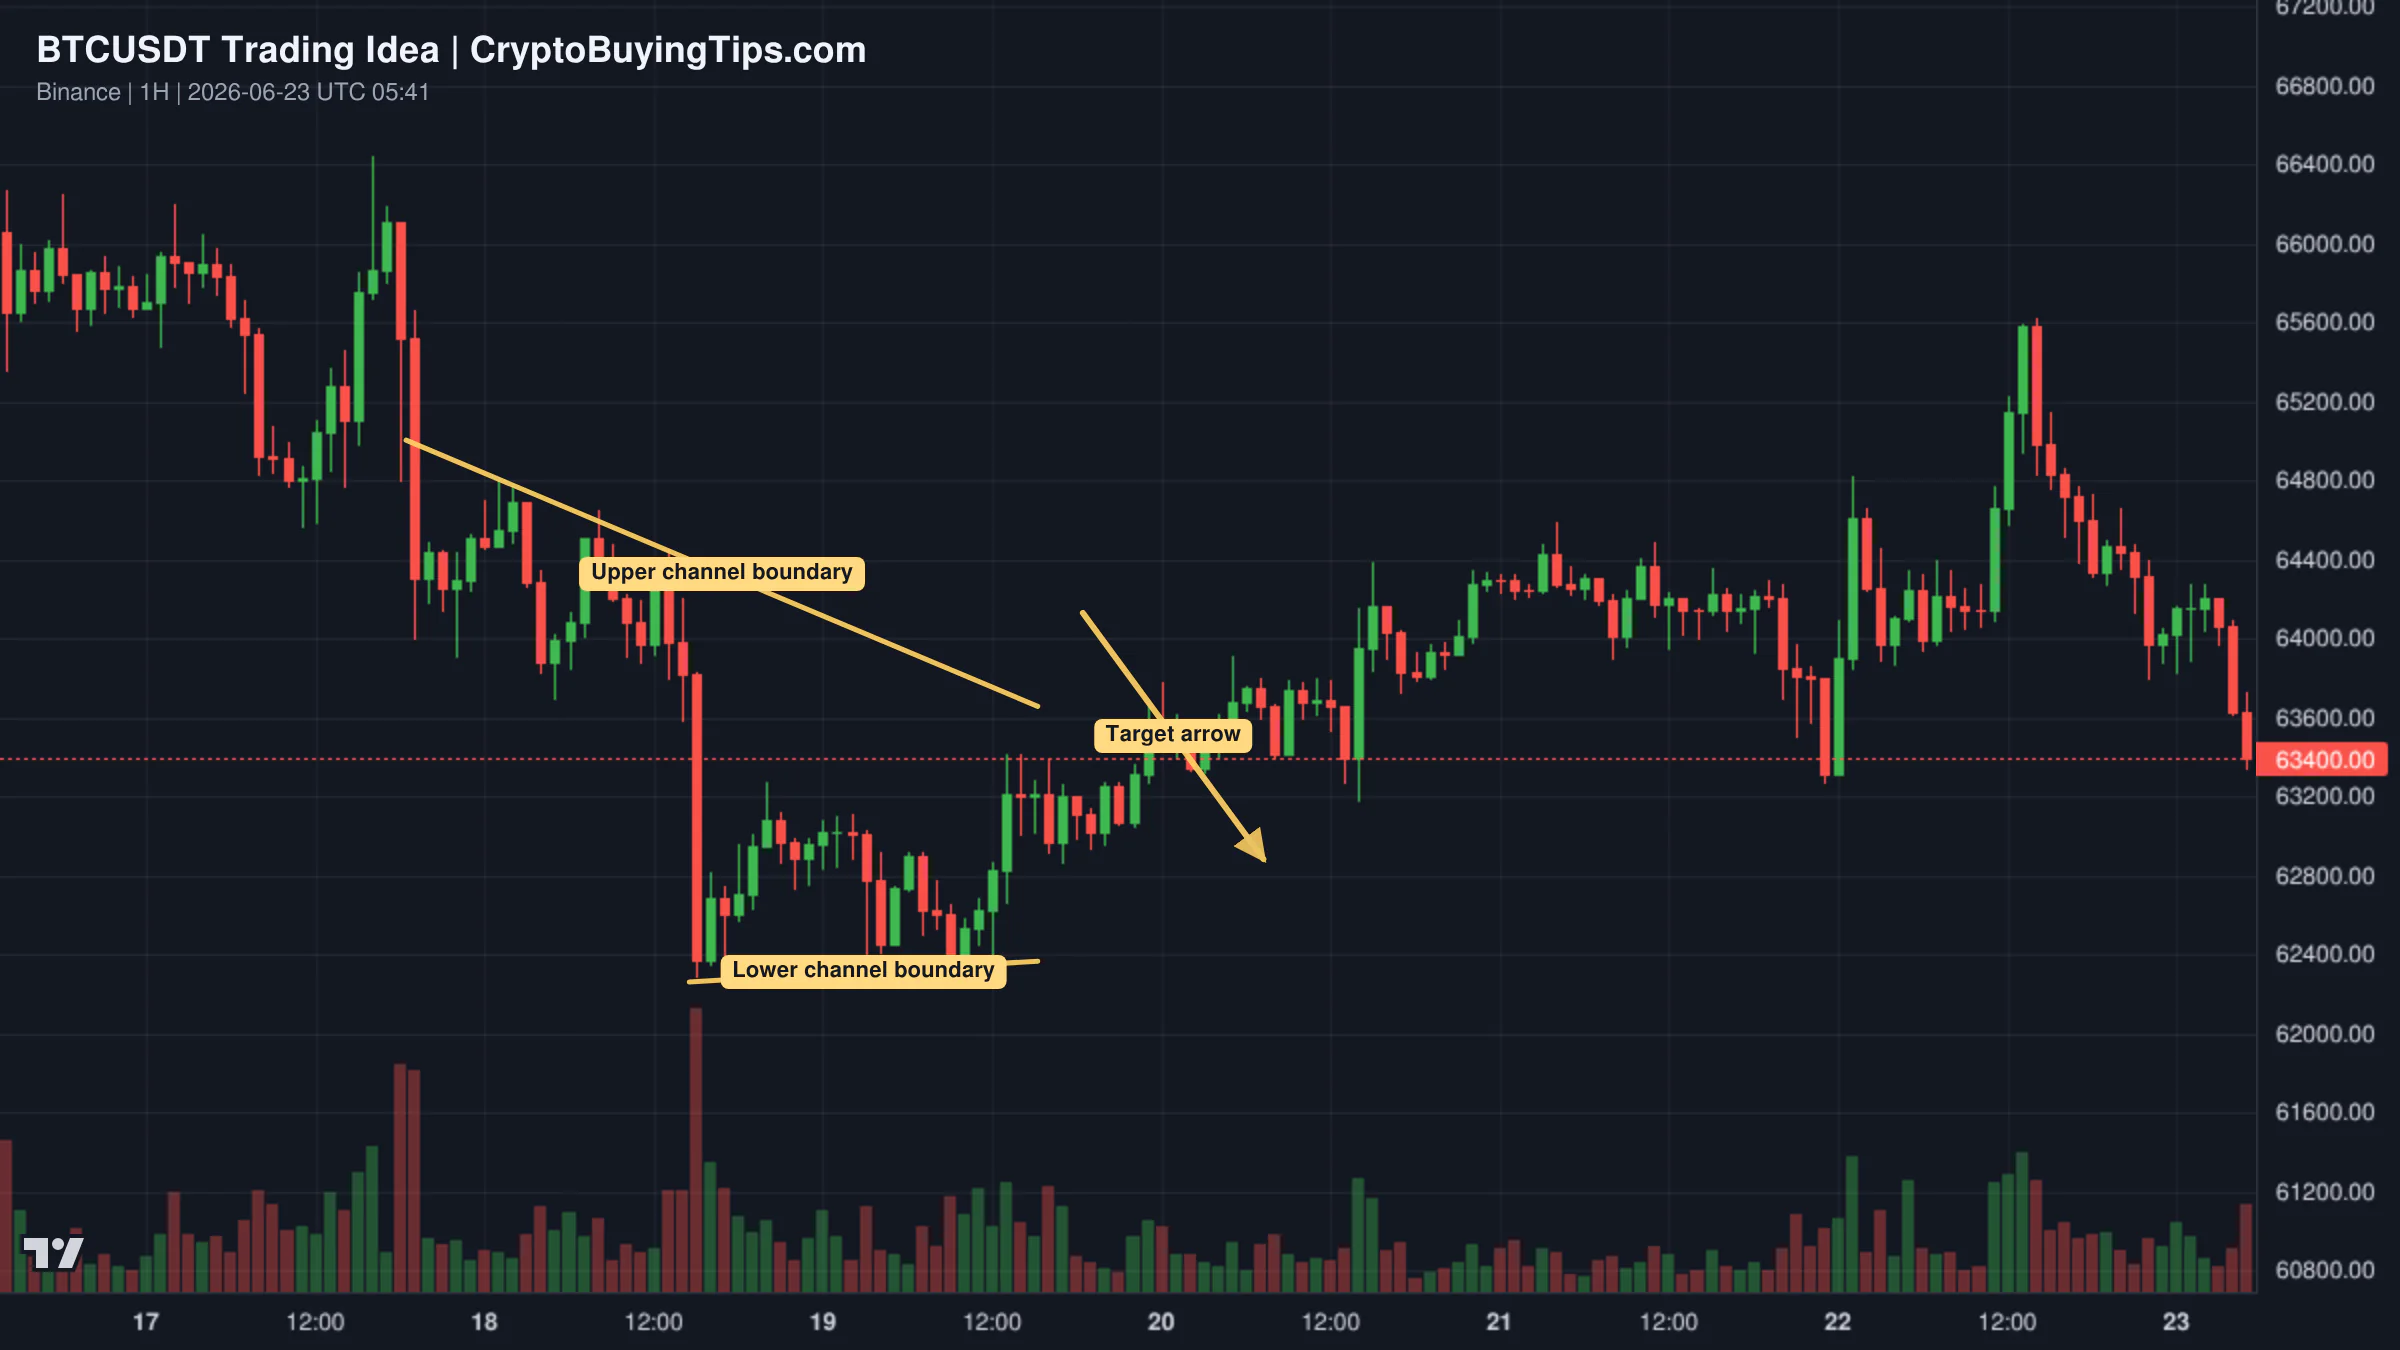
Conversely, a short-term bearish setup has emerged following the break of a bearish pattern. This view suggests that BTC could slide further to 62,400, with a potential extension down to 61,000 if that level fails. Given the current extreme fear and the tech selloff, this bearish outlook aligns more closely with the immediate macro pressure.
Finally, there is a more complex technical read involving a multi-week accumulation triangle. This analysis suggests that Bitcoin has reached the terminal apex of a compression corridor. When price compresses this deeply into a triangle's point, the resulting breakout is often explosive. This view argues that the recent flush to 59k reset funding rates and that the market is now primed for a short-squeeze toward 78k. It is a high-reward, high-risk thesis that relies on the "smart money" absorption theory.
What to watch next
The immediate focus is on the U.S. House of Representatives. The housing bill containing the CBDC ban is expected to pass quickly. A formal ban on a digital dollar would be a historic regulatory pivot that could shift the narrative from "fear of government competition" to "validation of decentralization."
On the technical side, the 61k to 62k zone for Bitcoin is the line in the sand. If this area holds, the "extreme fear" may actually be the bottom of the correction. If it breaks, we could see a deeper slide as the tech selloff continues. Keep a close eye on the DXY; if the dollar continues its climb toward new highs, the gravity on crypto assets will only increase.
Some links in this article may be affiliate links. We may earn a commission at no extra cost to you — this never influences our analysis or coverage.
Sigrid Voss
Crypto analyst and writer covering market trends, trading strategies, and blockchain technology.
More Articles

Altcoin season index is at 76 but the market is in fear
High Altcoin Season Index meets deep market fear; it looks less like an upswing and more like desperate short-term…
Crypto Market Overview | leverage surge amid fear and stablecoin regulation news | June 22, 2026
The crypto market shows high derivatives volume amid fear; we analyze BTC's sideways action and stablecoin regulation…

Three bridges just got exploited. Here is why the 'safe' L2 narrative is breaking
The L2 narrative seems to be having an off day, given three major bridges have seen exploits recently. These incidents…
Crypto Market Overview | Bitcoin dominance climbs as liquidity rotates to BTC despite low altcoin volume | June 21, 2026
Bitcoin dominance climbs to 58.45% as liquidity rotates toward BTC despite low altcoin volume; read our market overview…