Crypto Market Overview | leverage spikes amid spot slide and derivatives volume surge | July 28, 2026
Market overview
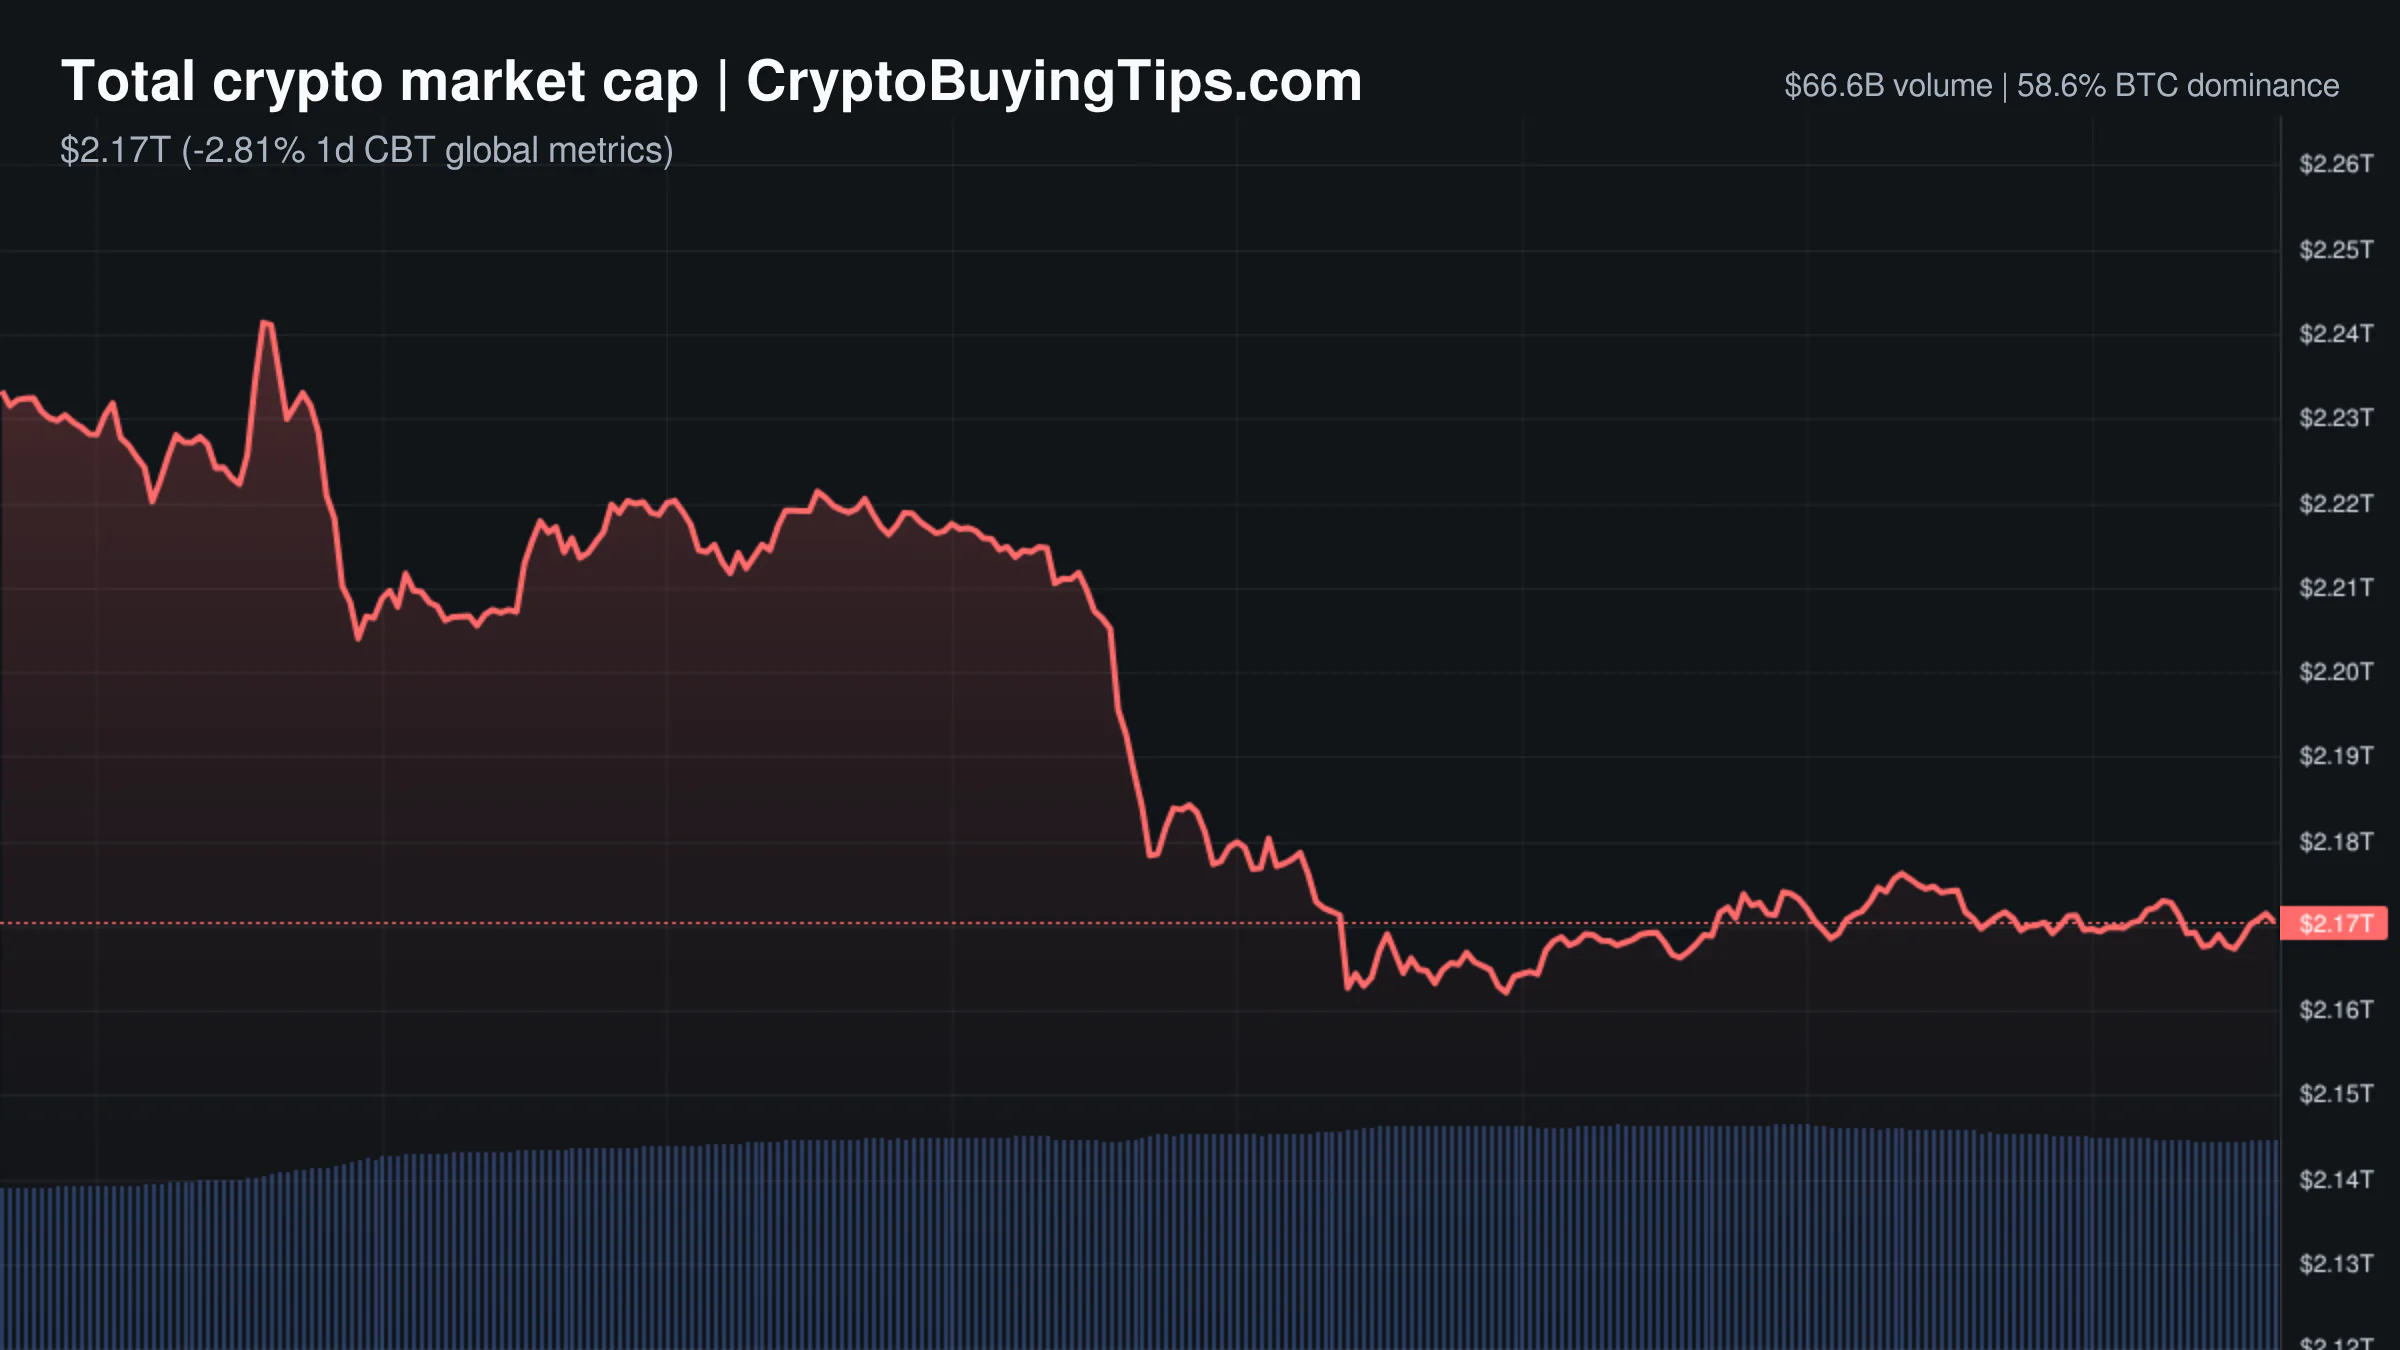
The crypto market is currently experiencing a textbook leverage flush. While the total market cap contracted by 2.80% to settle around $2.17T, the underlying activity suggests a desperate struggle between leveraged longs and opportunistic shorts. The most telling metric is the divergence between spot and derivatives volume. 24h derivatives volume has surged 45.64% to $688.65B, which is more than ten times the spot volume of $66.53B. When derivatives activity dwarfs spot trading to this extent, price action is usually driven by liquidations and hedging rather than genuine accumulation.
Sentiment has shifted firmly into "Fear" with a Fear and Greed Index score of 34. This coincides with a broader risk-off mood in traditional markets, where the NASDAQ fell 0.31% and global chip stocks are seeing a deep selloff. Bitcoin dominance remains high at 58.63%, suggesting that while the entire market is bleeding, capital is clinging to the largest asset for safety. The Altcoin Season Index sits at 52, a neutral reading that confirms the market is in a holding pattern. We are seeing a scenario where traders are using high leverage to fight a downtrend, which often leads to the kind of disorderly volatility we are seeing today.
Bitcoin and Ethereum
Bitcoin is currently trading at $63,434.05, down 2.84% over the last 24 hours. The asset is testing a key psychological and technical floor around the $63,000 mark. The lack of significant institutional ETF flow data today leaves a vacuum that is being filled by derivatives volatility. The price action is currently a battle between the $63,000 buyer zone and a descending resistance line near $65,000.
Ethereum has had a worse day, dropping 4.48% to $1,878.36. The asset is struggling with a lack of immediate catalysts and a continuing slide in dominance, which now sits at 10.44%. On the technical side, Lido is moving $16.5 billion in staked ether to consolidate validators and reduce the total count by a third. While this is a positive move for network efficiency and long-term stability, the market is currently too focused on immediate liquidity to care about validator optimization.
Top crypto prices
Bitcoin (BTC) is at $63,434.05, down 2.84%.
Ethereum (ETH) is at $1,878.36, down 4.48%.
BNB (BNB) is at $565.95, down 1.21%.
XRP (XRP) is at $1.05, down 4.74%.
Solana (SOL) is at $73.19, down 4.35%.
TRON (TRX) is at $0.3258, down 1.43%.
Hyperliquid (HYPE) is at $54.73, down 9.23%.
News driving today's market
The primary narrative today is the escalating war between the CME Group and the CFTC. The CME is suing its own regulator over the decision to allow blockchain-based perpetual futures on platforms like Coinbase and Kalshi. It is a rare and somewhat comical sight to see the largest derivatives exchange in the U.S. fighting the government to protect its monopoly on futures contracts. This conflict highlights the growing tension as "perps" move from the fringes of DeFi into the regulated Wall Street fold.
The institutional appetite for these products is evident, with Bank of America estimating annual perpetual futures volume at $90 trillion. This suggests that while the regulators and exchanges are fighting in court, the actual capital is moving toward these instruments. We have previously noted how volume data suggests fight in the broader market, and this derivatives war is the latest example of that friction.
In other news, the Hong Kong Monetary Authority is pushing a quantum-preparedness index to protect tokenized deposits from future computing threats. This is a long-term institutional play that suggests Hong Kong is building for a decade, not a quarter. Meanwhile, prediction markets have scored a partial win as a judge blocked a ban on these markets in Minnesota. This provides some regulatory breathing room for platforms like Polymarket. Given the current climate of fear, we believe that rising stablecoin dominance in crypto is the only real hedge for retail traders while these legal battles play out.
Social intelligence
The social mood is heavily weighed down by geopolitical escalation. Reports from the Kremlin regarding the "special military operation" and accusations of attacks on gas pipelines are creating a risk-off environment. When geopolitical tensions spike, the "digital gold" narrative for Bitcoin often fails to materialize in the short term, as traders simply move to cash.
This is compounded by a global chip selloff. South Korea's Kospi plunged 10% and Japan's Nikkei fell 4% due to concerns over AI spending and China's technological progress. Since the crypto market has become increasingly correlated with AI and tech stocks, this selloff is acting as a drag on prices. The market is effectively pricing in a "tech winter" alongside a geopolitical crisis, which is a poor recipe for a bullish day.
On a more boring but regulatory-positive note, Nexo is utilizing German MiCAR-licensed partners for its EEA custody. This is a standard compliance move, but it shows that the era of "move fast and break things" is being replaced by a slow, bureaucratic slog through European regulations.
Trading ideas worth watching
There is a strong bullish setup for BTCUSDT based on a channel bounce. Bitcoin has retested the lower support floor of an ascending channel near $63,200. The data shows that institutional buy orders stepped in to absorb the selling pressure right at this level. The target for this trade is the horizontal resistance line around $65,800. The risk is a four-hour close below $62,800, which would invalidate the channel and likely trigger another wave of liquidations.
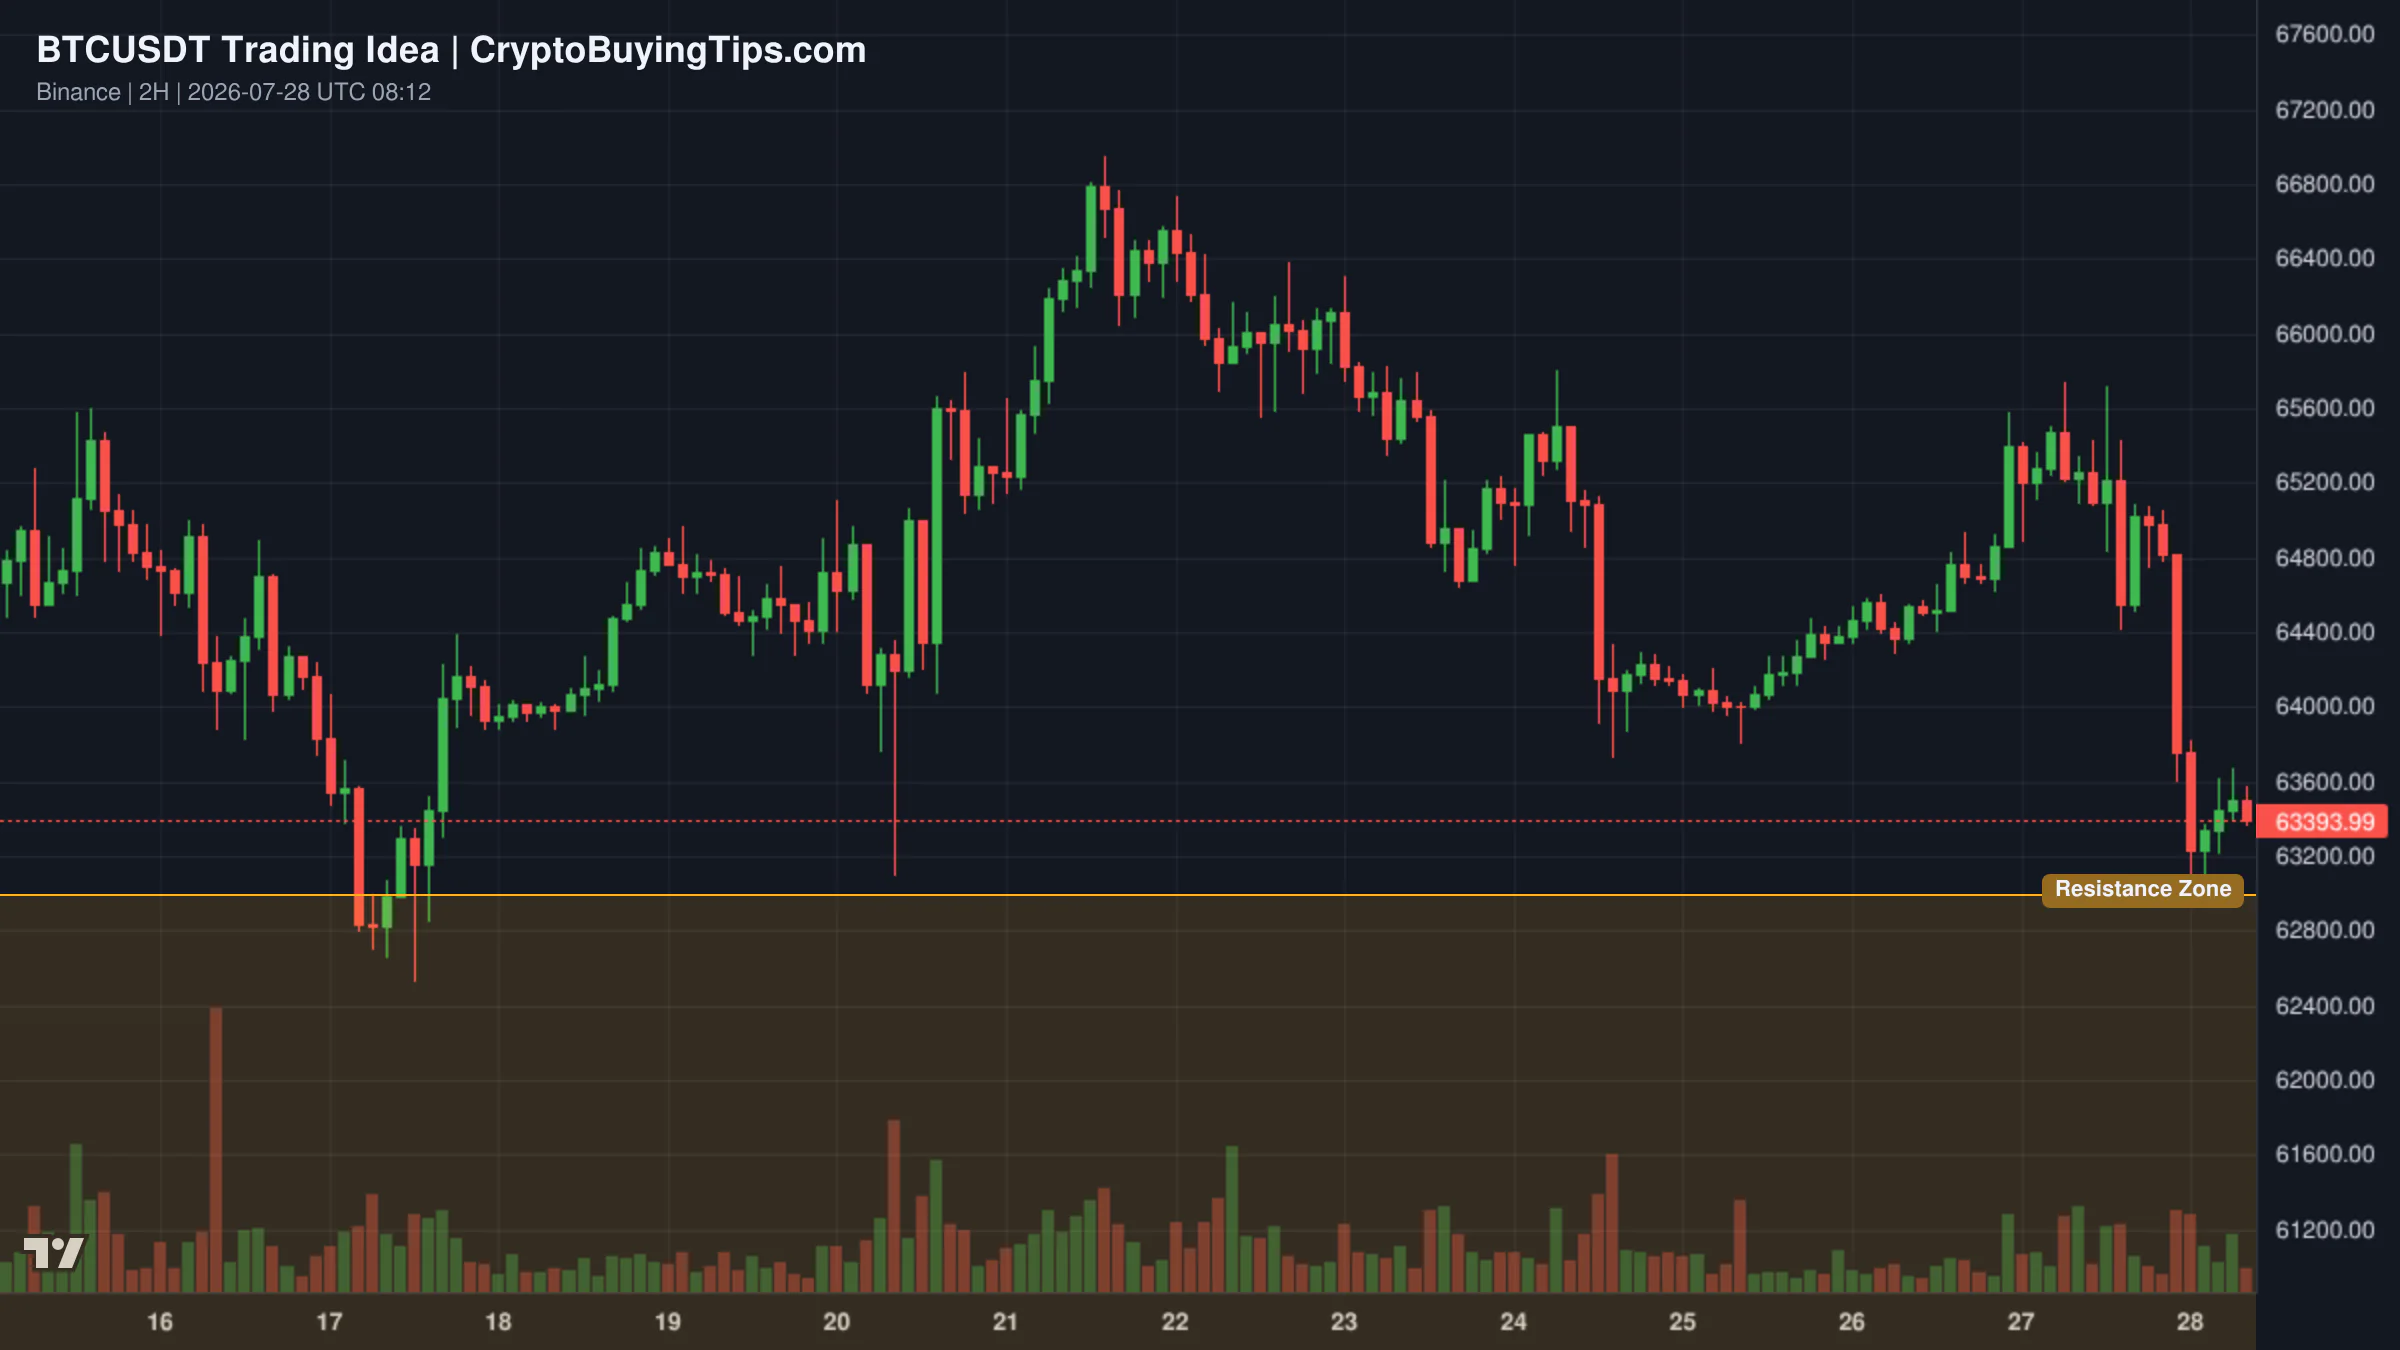
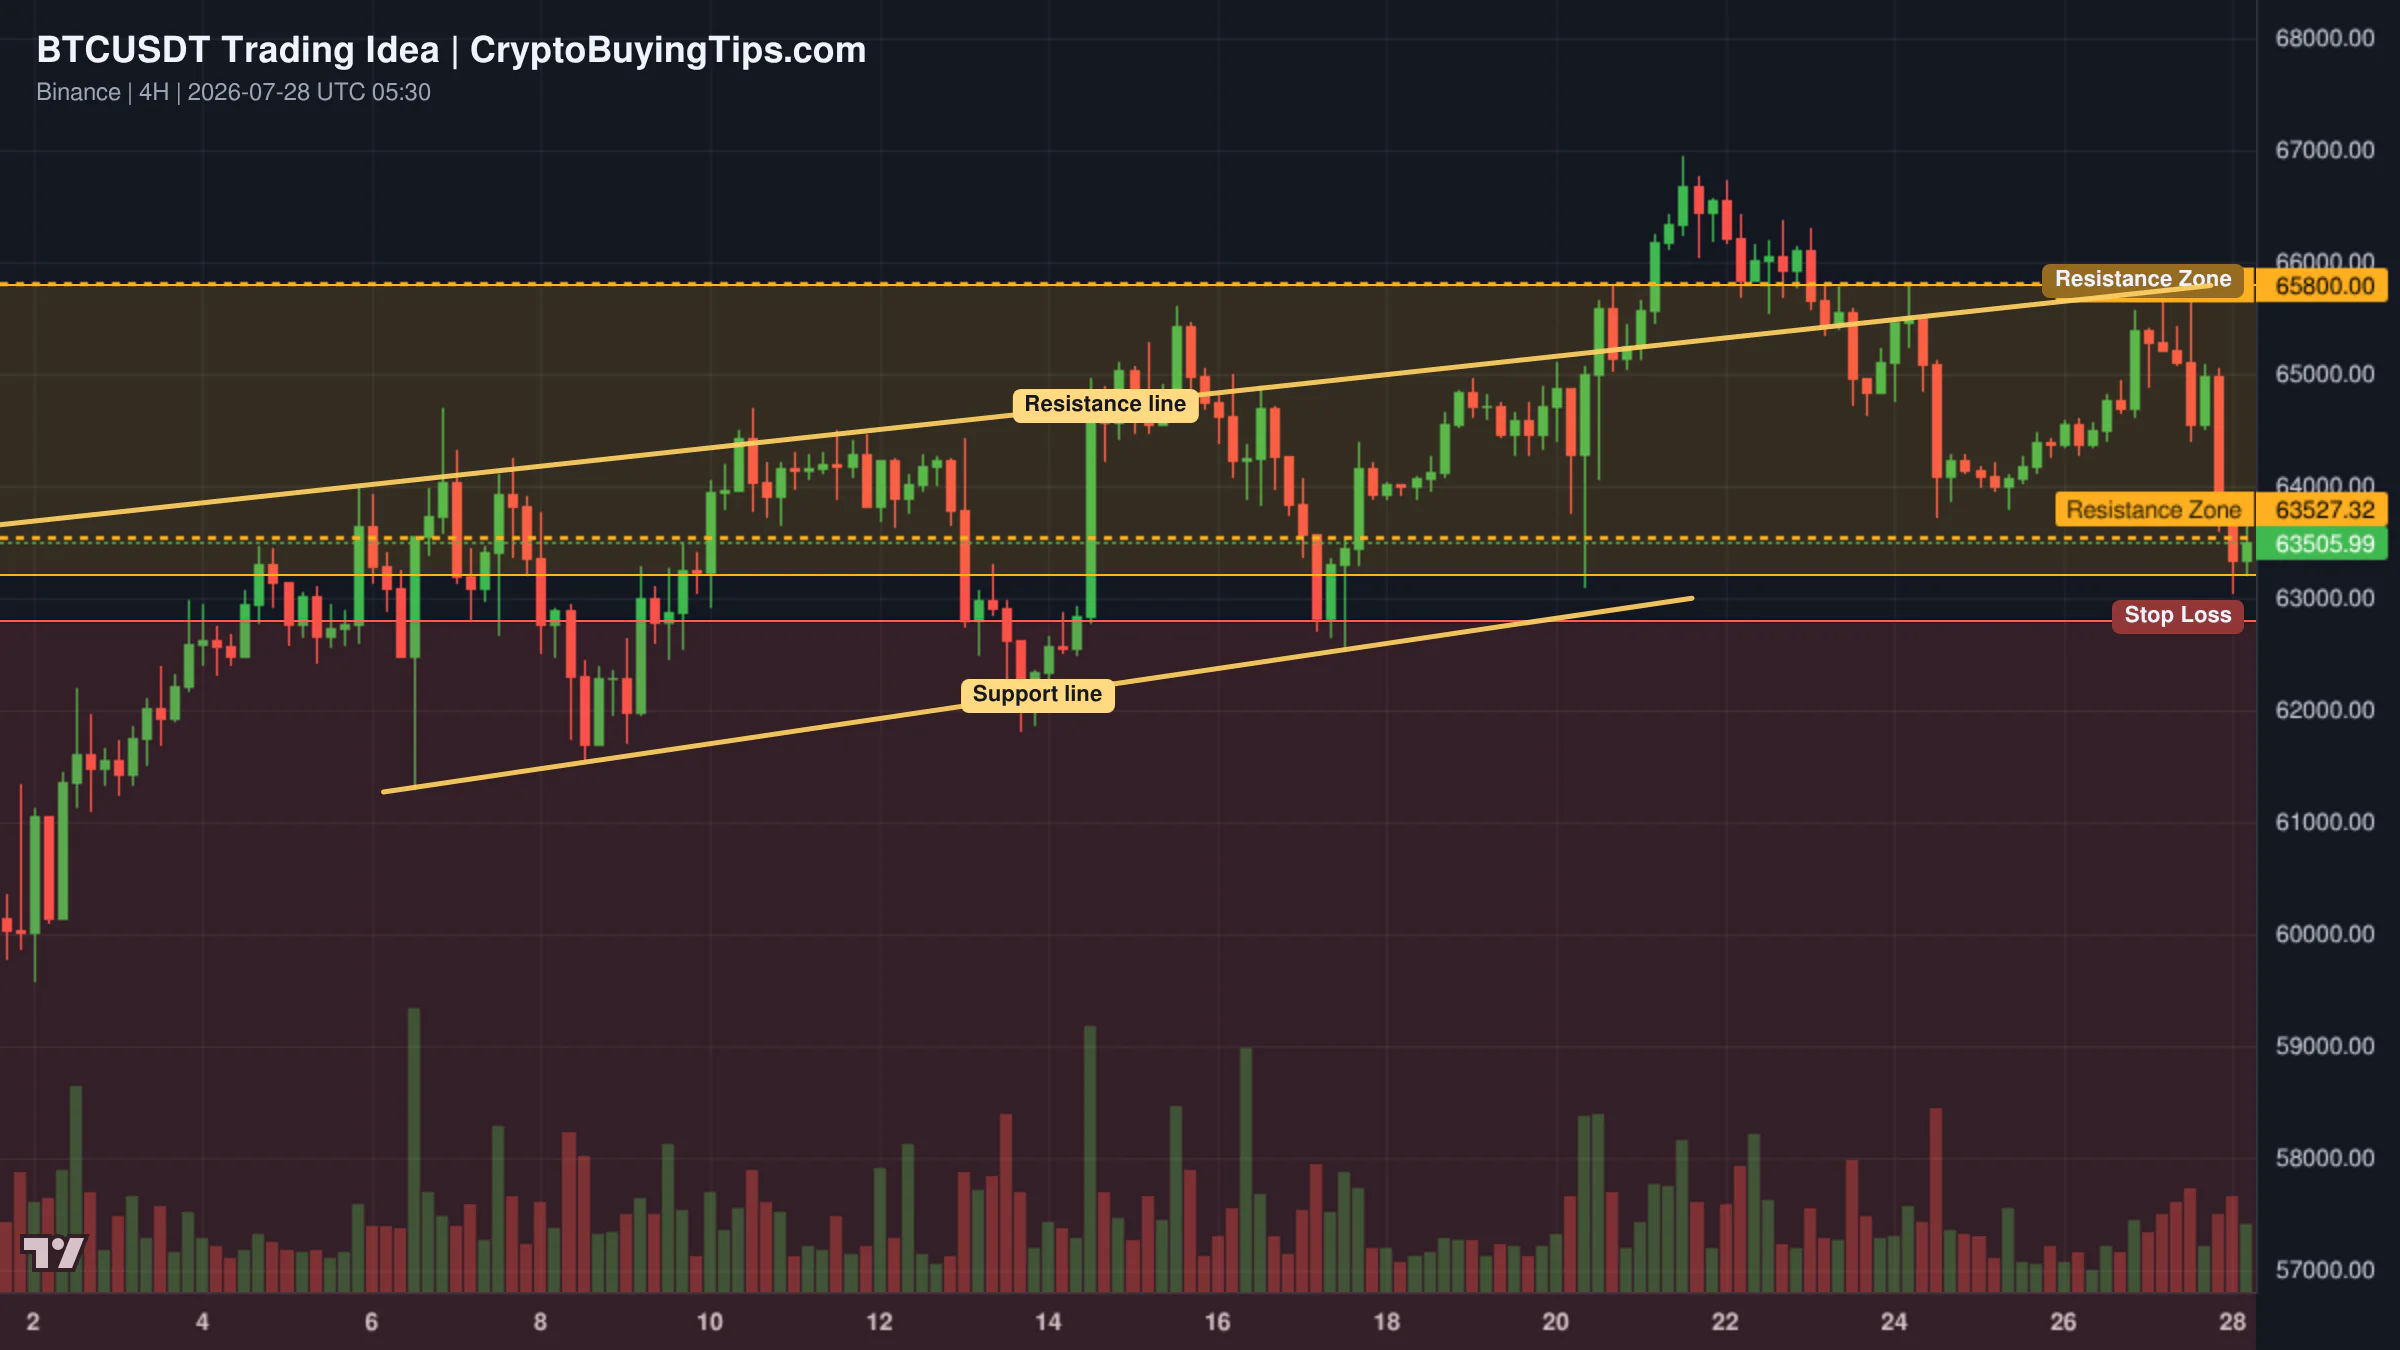
Another perspective on BTCUSDT focuses on the $63,000 buyer zone. As long as the price holds this area and the rising trendline, a recovery toward $65,000 remains the likely scenario. However, a breakdown below $63,000 would weaken the bullish case and suggest that the current "fear" is justified.
For those looking at altcoins, ENA has been stuck in a wide consolidation range between $0.07 and $0.14 for six months. The neutral read here is to wait for the asset to establish itself above the midpoint of $0.095. Until that happens, the asset is simply drifting, and there is little reason to rush into a trade that has shown no direction for half a year.
Smart Money Signals — Hyperliquid Leaderboard
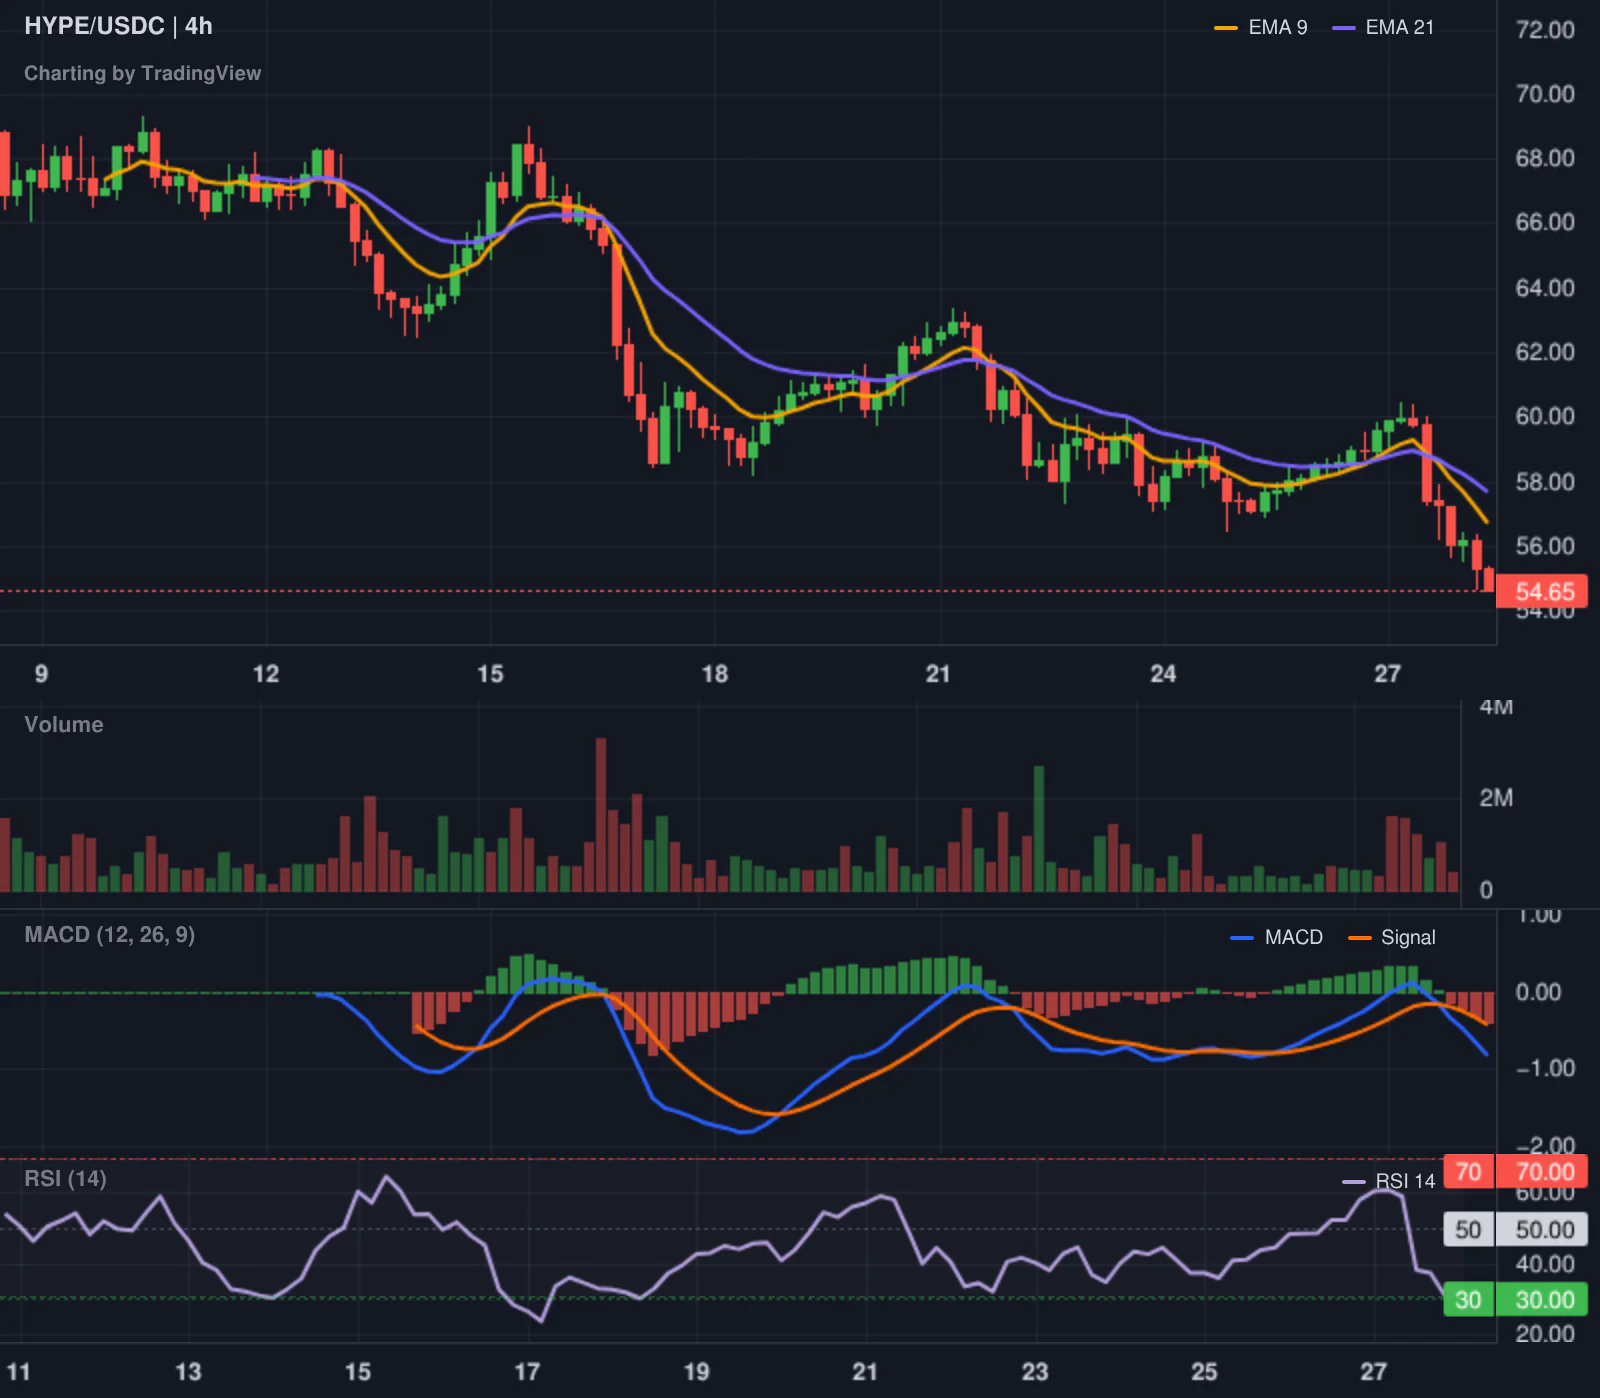
Our tracker has flagged a significant move from @TudorCross, who boasts a 6136% 30-day ROI. This trader has opened a short position in HYPE at an entry price of $58.17, with a notional value of over $40,000. Given the trader's track record, this short aligns with the broader market weakness and the specific decline in Hyperliquid's price today.
Altcoin Spotlight
Hyperliquid (HYPE) is the standout loser of the day, crashing 9.23% to $54.73. This move is particularly interesting because the asset is being targeted by top-tier leaderboard traders. The volatility in HYPE is a microcosm of the wider market: high leverage and rapid price swings. When a top trader shorts an asset that is already sliding, it often suggests that the "bottom" is further away than the bulls think.
What to watch next
The immediate focus is the $63,000 level for Bitcoin. If this support holds, we can expect a relief rally toward $65,800 as the leveraged shorts get squeezed. If it fails, the market could see a deeper correction as the Fear and Greed Index slides further toward "Extreme Fear."
On the macro front, keep an eye on the U.S. chip stocks. If the selloff in Nvidia and Micron continues, the crypto market will likely follow suit regardless of any bullish technical setups. Finally, the federal court's decision on the CME versus CFTC lawsuit will be a major indicator of how regulated derivatives will actually function in the U.S. For now, the market is in a state of fragile equilibrium, waiting for either a geopolitical truce or a technical breakout.