Crypto Market Overview | Leveraged volume spikes amid fear index divergence | July 27, 2026
Market overview
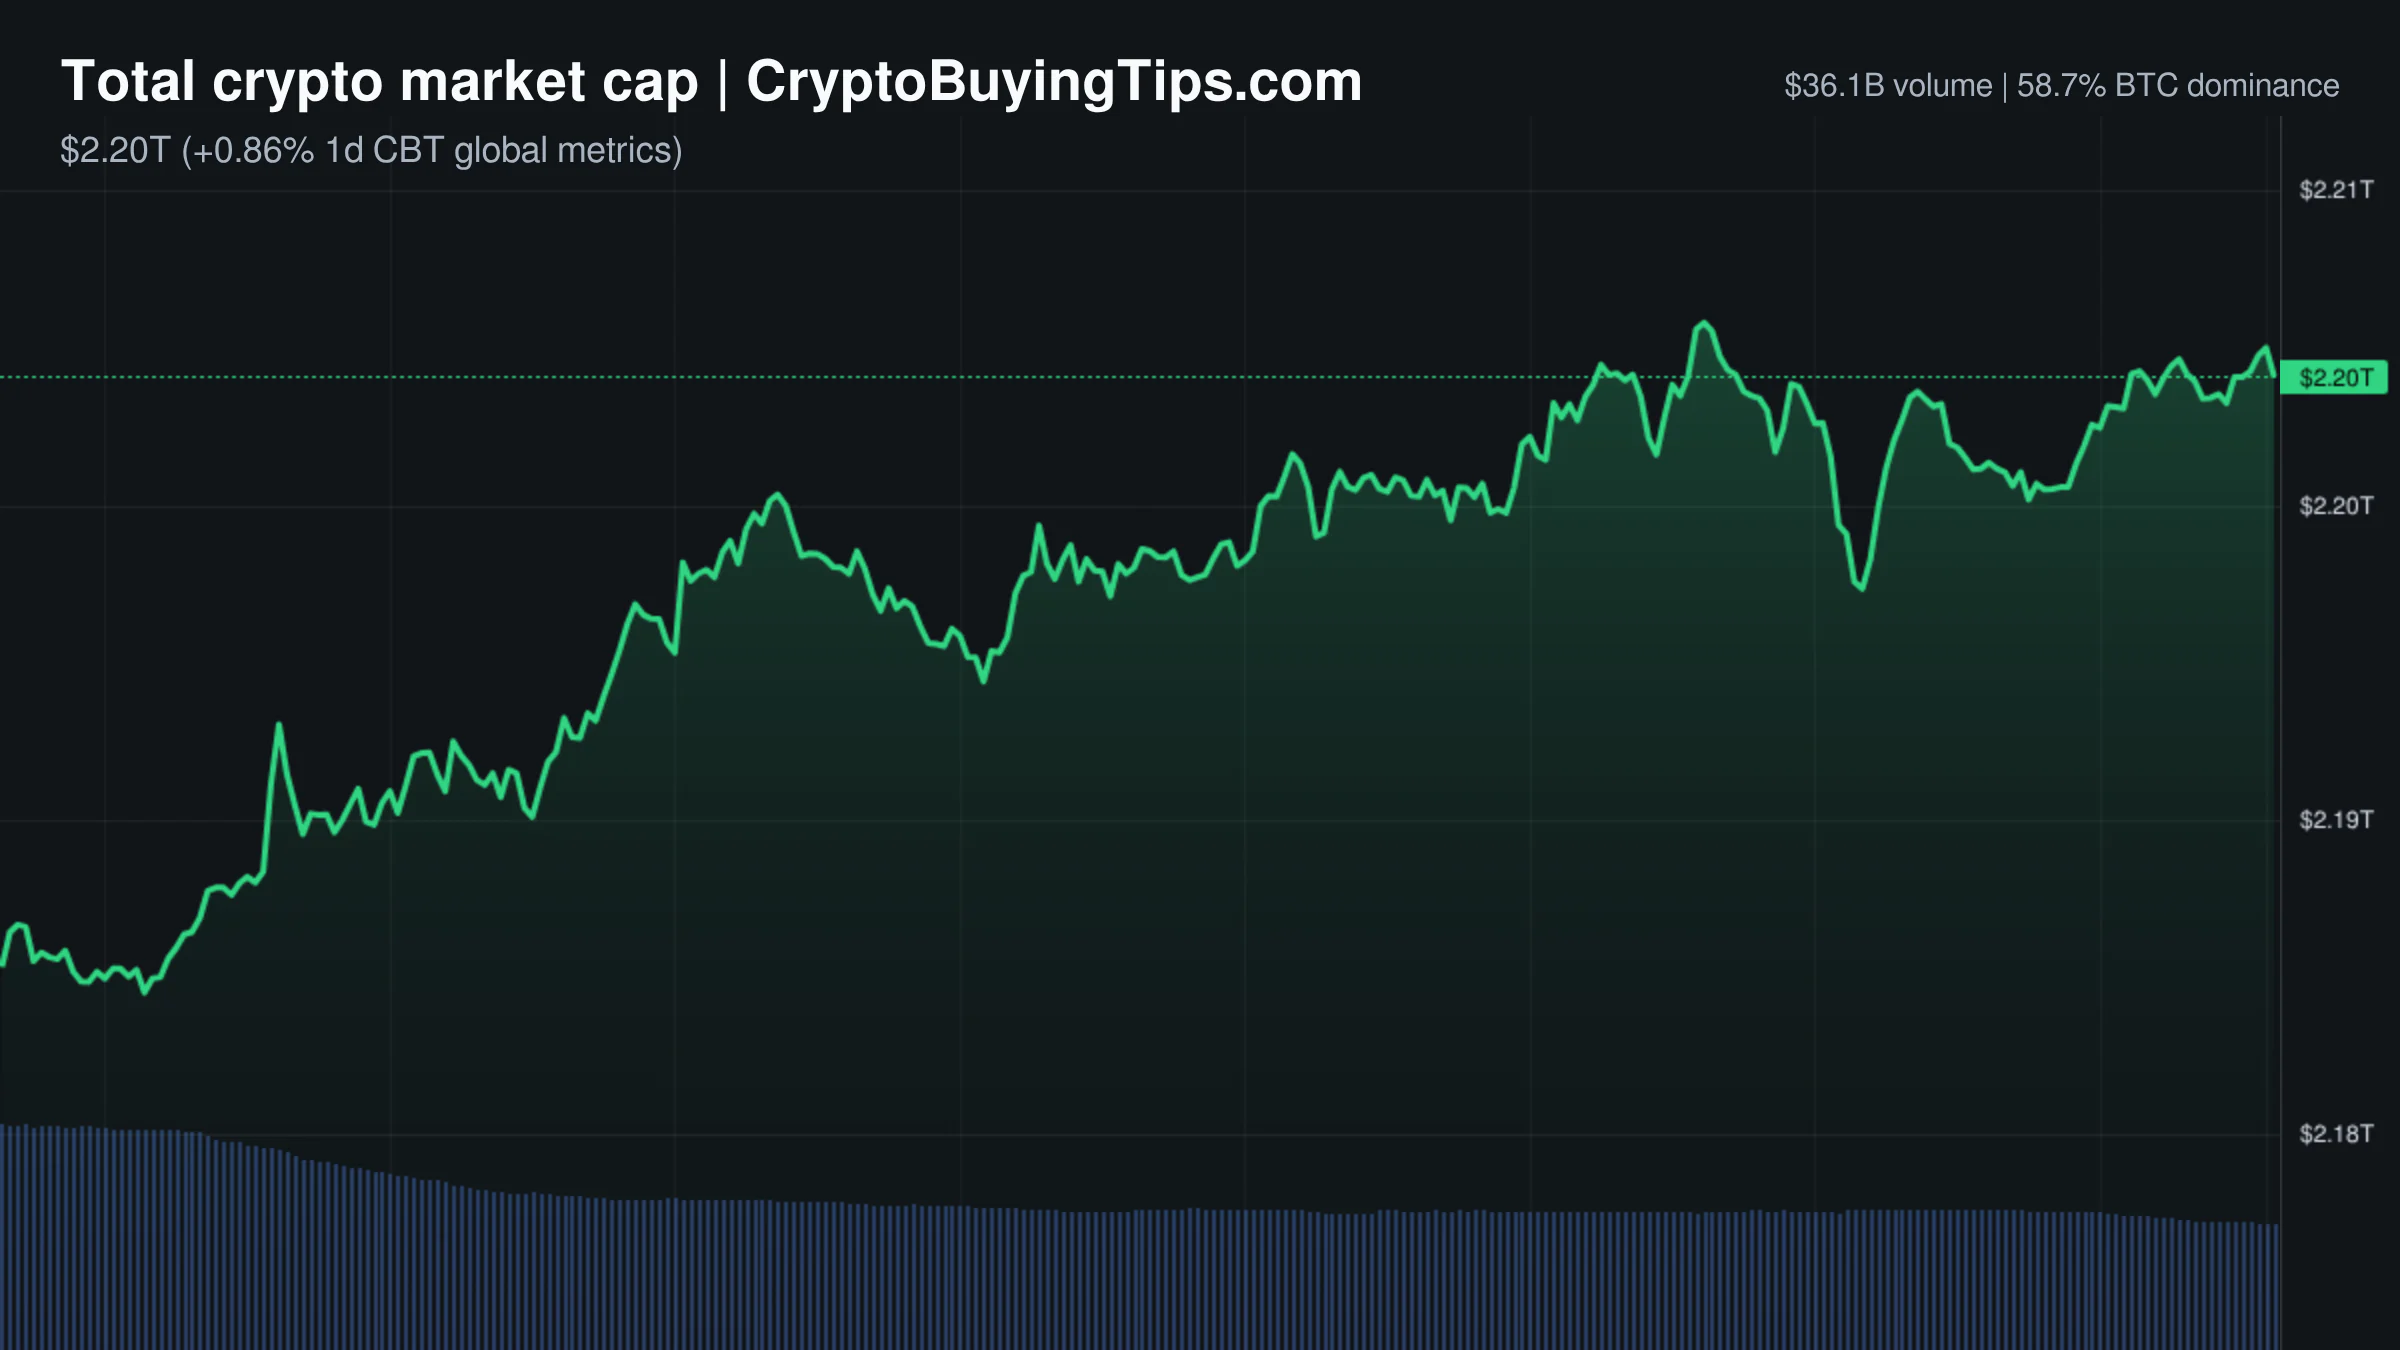
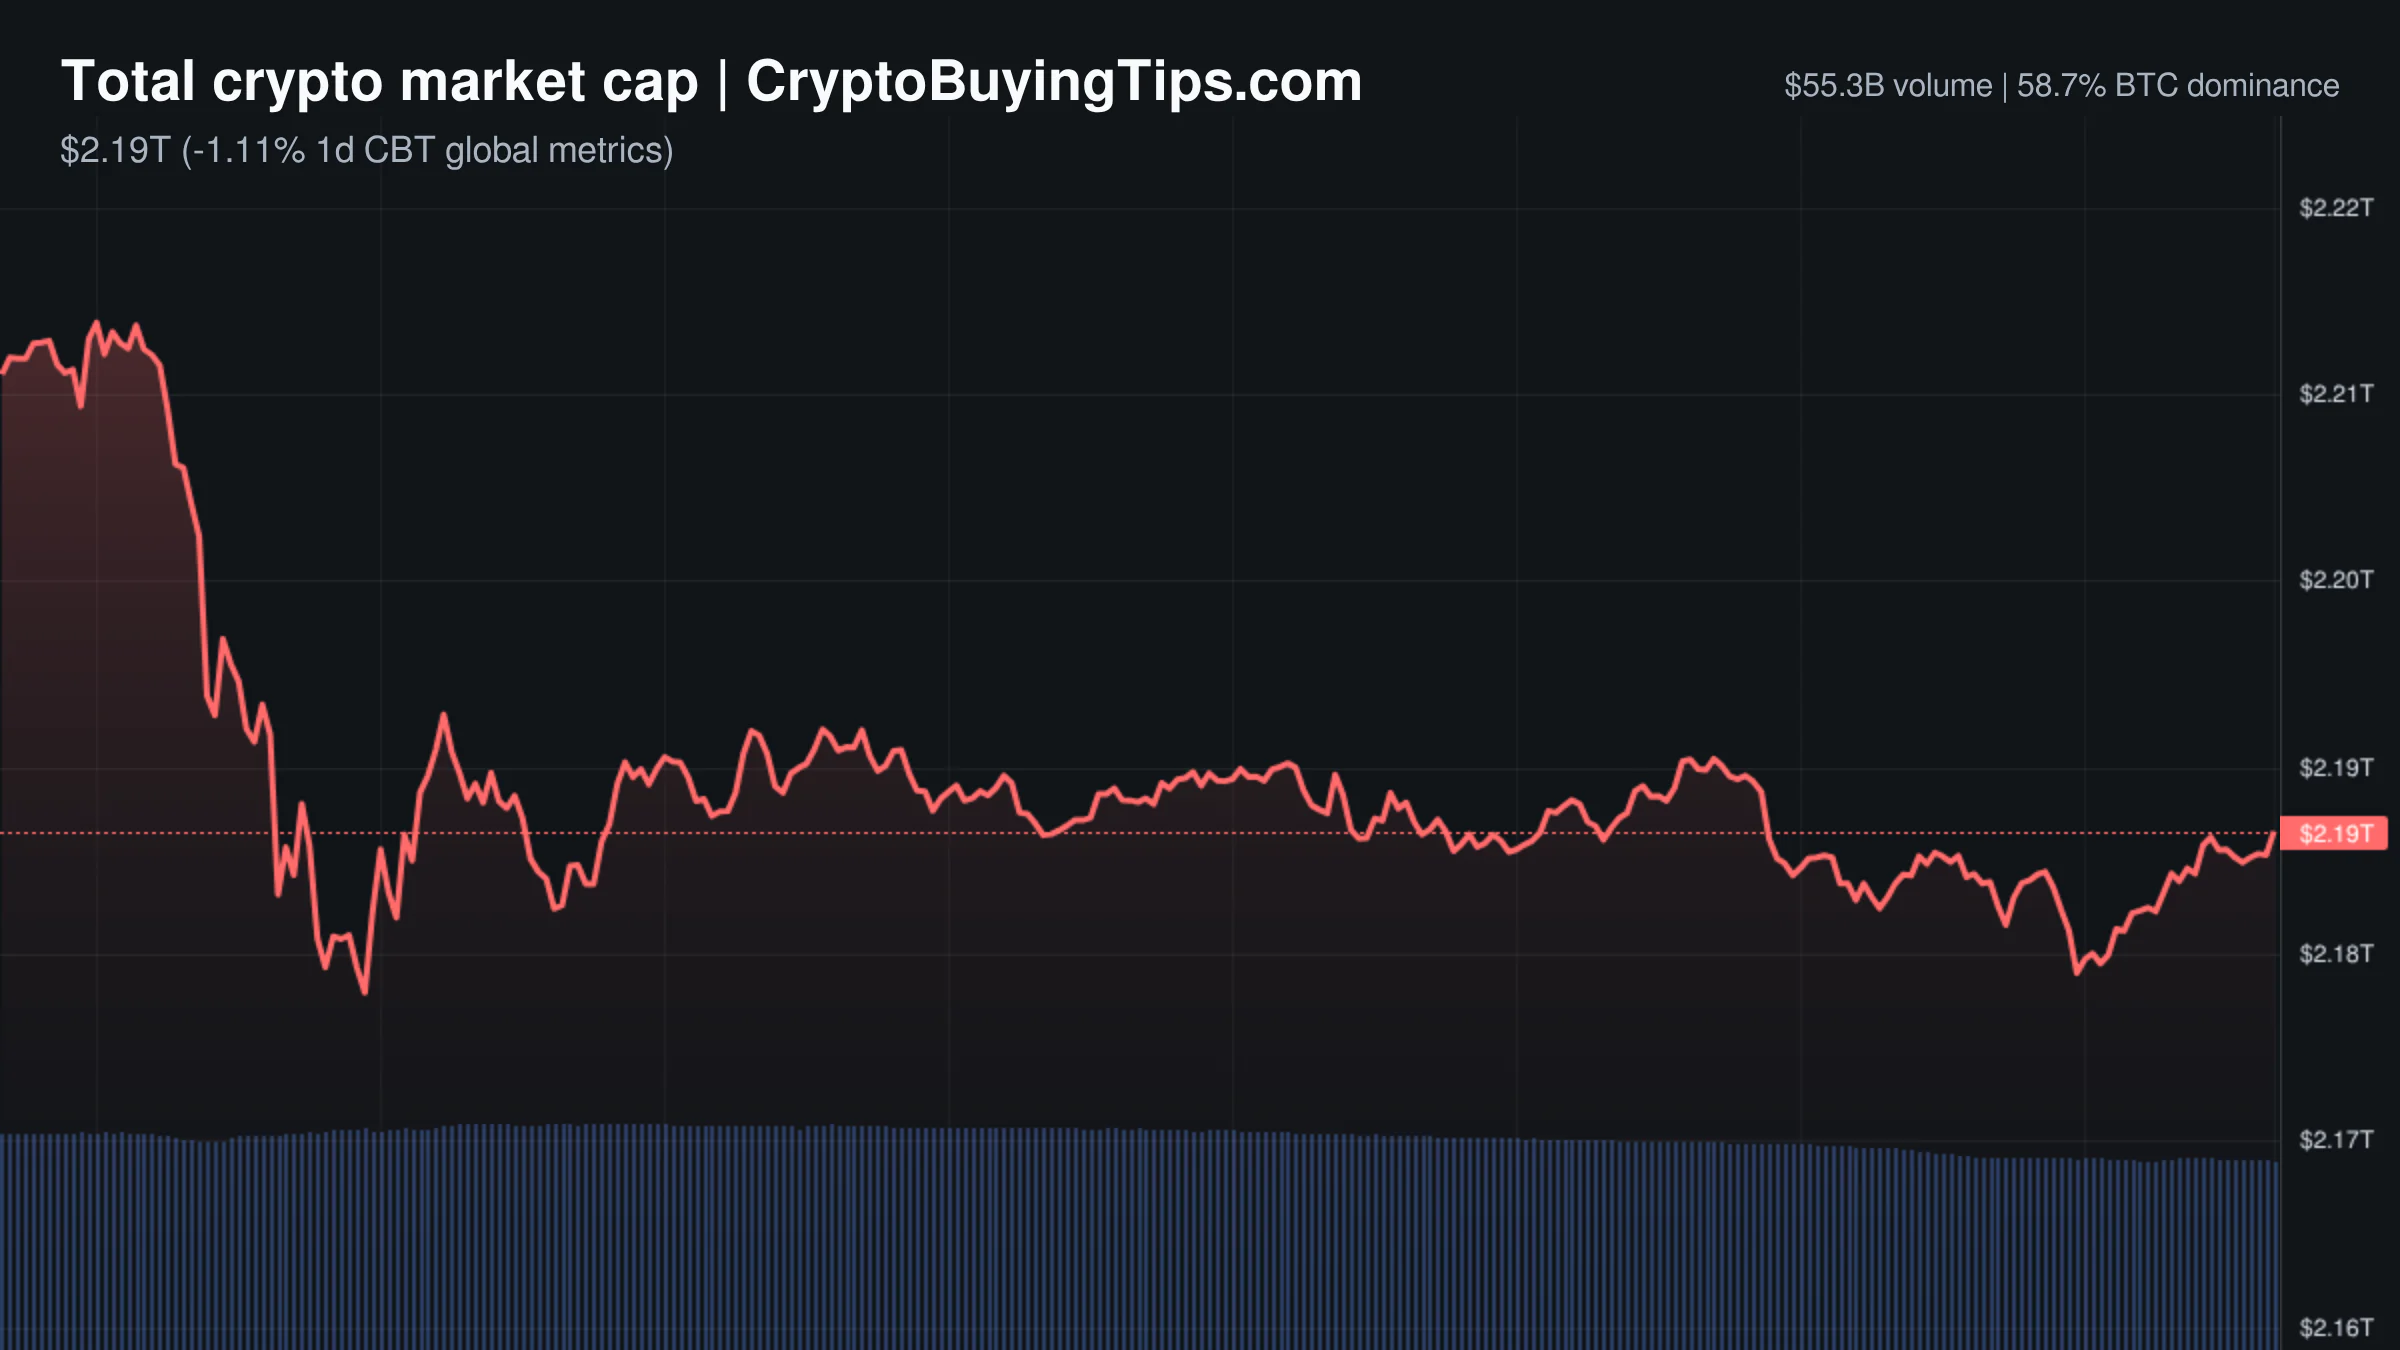
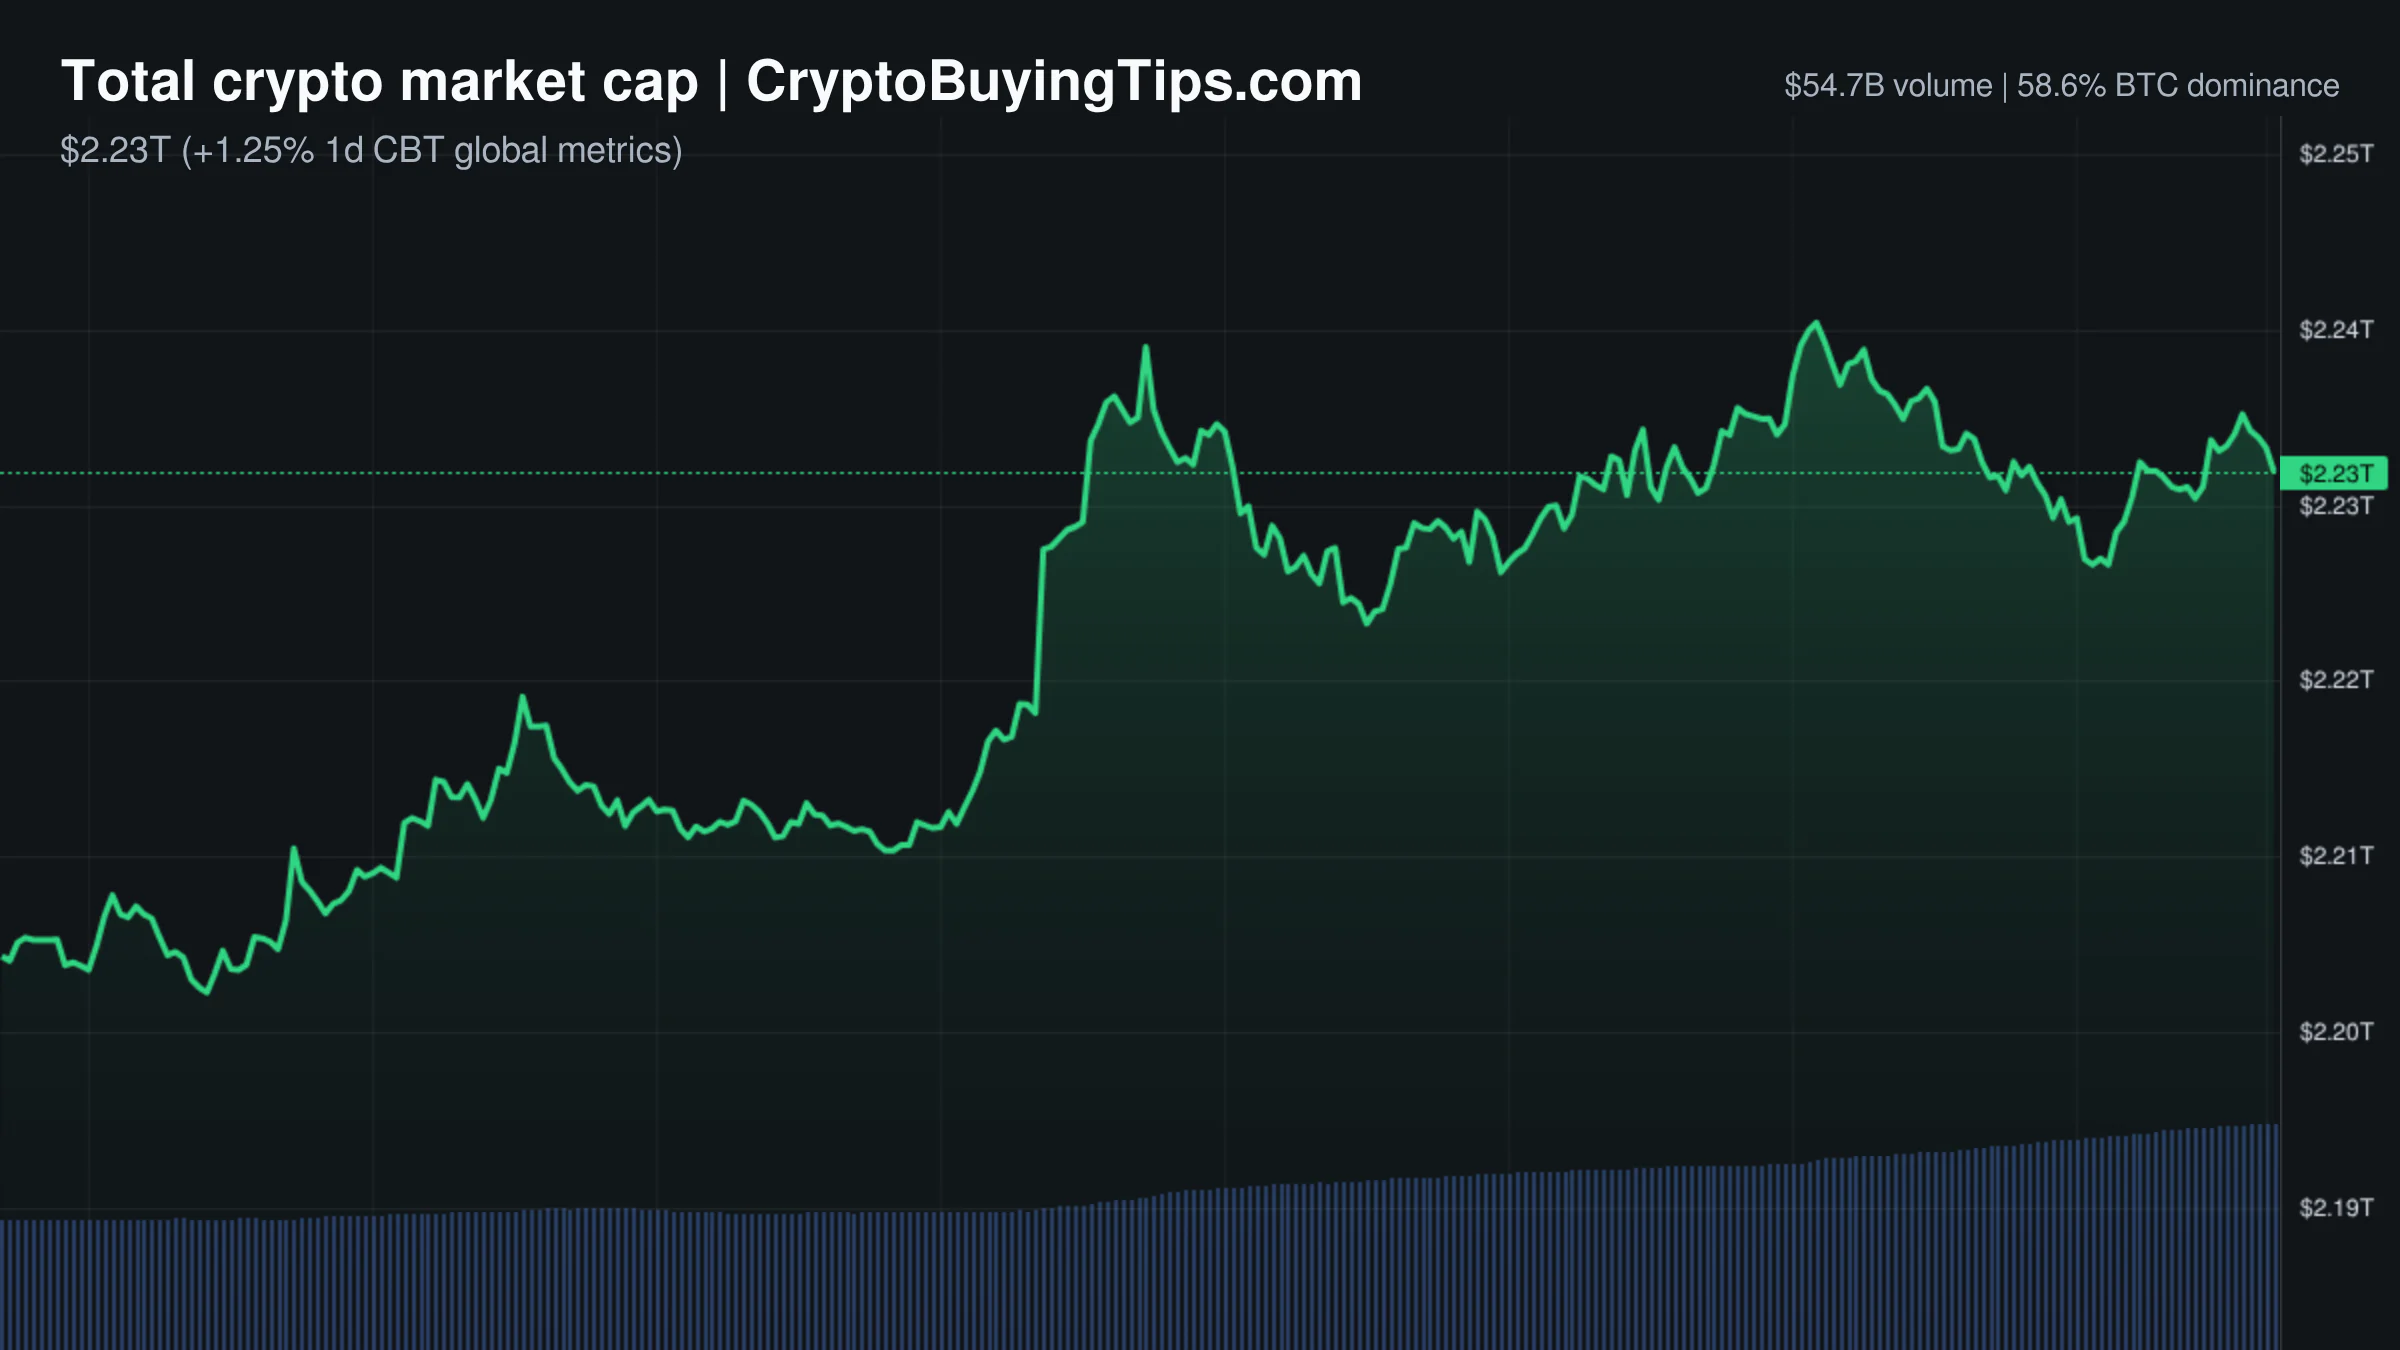
The crypto market is currently operating in a state of profound contradiction. Prices are drifting higher, with the total market cap sitting at $2.32T and a 24-hour gain of 1.36%, yet the Fear and Greed Index remains stubbornly in "Fear" at 39. This disconnect is not a glitch but a signal. We are seeing a classic divergence where price action is being driven by a massive surge in leveraged activity rather than a broad shift in spot conviction. Derivatives volume has spiked by 75.34% to $473.98B, completely dwarfing spot volume. When the crowd is terrified but the leverage is mounting, the market is usually positioning for a volatile move rather than a steady climb.
This leveraged push is mirrored in stablecoin activity, where 24-hour volume rose 51.14%. This suggests that capital is moving into position, but the "Fear" sentiment indicates that this money is not entering with a long-term "buy and hold" mentality. Instead, it looks like tactical positioning for short-term swings. Bitcoin dominance remains high at 56.44%, which tells us that despite the general price lift, capital is not yet rotating into altcoins. The Altcoin Season Index is at 27, firmly in Bitcoin season territory. Money is staying in the safest harbor while the rest of the market waits for a catalyst that doesn't involve a high-leverage gamble.
The macro backdrop adds to this tension. The S&P 500 is flat, while the NASDAQ has slipped 1.12%. This suggests a slight risk-off mood in tech, which usually drags on crypto. However, the crypto market is ignoring the NASDAQ's mood for now. This divergence often happens when institutional flows, such as the recent ETF activity, begin to decouple from the daily noise of the equity markets.
Bitcoin and Ethereum
Bitcoin is currently trading at $65,297.41, up 1.30% over the last 24 hours. The price action is cautious. While it has managed to hold above the $64,000 mark, the lack of aggressive spot buying means the current move is fragile. The dominance figure of 56.44% indicates that Bitcoin is still the primary vacuum for liquidity. We previously covered how BTC dominance data analysis often reflects capital consolidating during liquidity pauses, and today's data supports that read. The market is not yet convinced that a new bull leg has started; it is simply refusing to crash.
Ethereum is showing more relative strength today, trading at $1,966.37 with a 4.36% gain. This outperformance is likely linked to the institutional appetite we are seeing in the ETF space. Spot Ethereum ETFs recorded $104 million in weekly net inflows, extending a three-week streak. This is a meaningful contrast to the broader network state, where gas fees are extremely low at 0.1 Gwei. The lack of on-chain congestion suggests that the price rise is coming from the "wrapper" (ETFs) rather than actual utility on the network.
This creates a strange dynamic where Ethereum market share vanishes in terms of dominance (now at 10.23%), but the price is being propped up by institutional inflows. It is a corporate makeover in real time. The network is quiet, but the ETFs are busy.
Top crypto prices
Bitcoin is at $65,297.41, up 1.30%. Ethereum is at $1,966.37, up 4.36%. BNB is trading at $572.97, a modest increase of 0.42%. XRP is at $1.1, up 0.69%. Solana is at $76.53, gaining 1.88%. TRON has dipped slightly to $0.3306, down 0.43%. Hyperliquid is at $60.27, up 2.60%.
News driving today's market
Institutional adoption continues to move in a fragmented way. Russia's Sberbank is planning to launch crypto trading infrastructure, including a digital depository, by December. This is a significant move for a state-affiliated bank and suggests that even in sanctioned or restricted environments, the drive toward regulated digital asset rails is inevitable. Similarly, BNY Mellon's European subsidiary has joined the MiCA register. When the world's oldest custodian bank moves into the MiCA framework, it provides a structural floor for the market. These are the "slow and steady" wins that build long-term liquidity.
On the other hand, the regulatory hammer is still swinging. Thailand's SEC has filed a criminal complaint against Bitkub over a $47 million hack from 2021 that was allegedly hidden from regulators. This is a reminder that the "trust me" era of regional exchanges is over. The fallout from the fading hopes for the Clarity Act in the U.S. is also weighing on the mood. With BitMEX reportedly shutting down as the market consolidates into five major players, we are seeing a brutal thinning of the herd. The industry is moving toward an oligopoly where only the most compliant or the most massive survive.
We are also seeing a shift toward "agentic finance." Coinbase CEO Brian Armstrong is pushing the narrative that AI agents will drive the next wave of adoption, specifically highlighting the Base network and USDC. While this sounds like typical CEO optimism, the fact that Base has topped 100 million AI payments suggests there is actual data behind the hype. Meanwhile, real-world tokenization is moving beyond pilots. POSCO International and LG CNS are using the Injective network to tokenize commercial invoices. This is a practical use case that doesn't rely on speculation, which is a refreshing change of pace.
Social intelligence
The ETF data is the most actionable signal coming from social feeds. The three-week streak of net inflows for both Bitcoin and Ethereum ETFs suggests a steady institutional accumulation that is ignoring the "Fear" sentiment of retail traders. Bitcoin ETFs saw $33.79M in inflows, while Ethereum's $103.9M is far more impressive given its lower market cap. We are also seeing some interest in SOL and XRP ETFs, which posted inflows of $7.2M and $8.15M respectively.
Macro anxiety is centering on the July 29 FOMC meeting. Markets are pricing in a 36.3% chance of a rate hike. In a world where crypto is essentially a high-beta play on global liquidity, any hint of tighter money is a headwind. This anxiety was compounded by Singapore's central bank unexpectedly tightening monetary policy due to inflation and energy costs. When a major Asian hub tightens, it usually signals a shift in global risk appetite.
Finally, the BitMart wind-down is causing some localized stress. Withdrawals have slowed as wallets fell to around $69M, and the BMX token has crashed over 81% this week. This is a textbook example of how quickly a platform can collapse once the market decides it is no longer viable.
Trading ideas worth watching
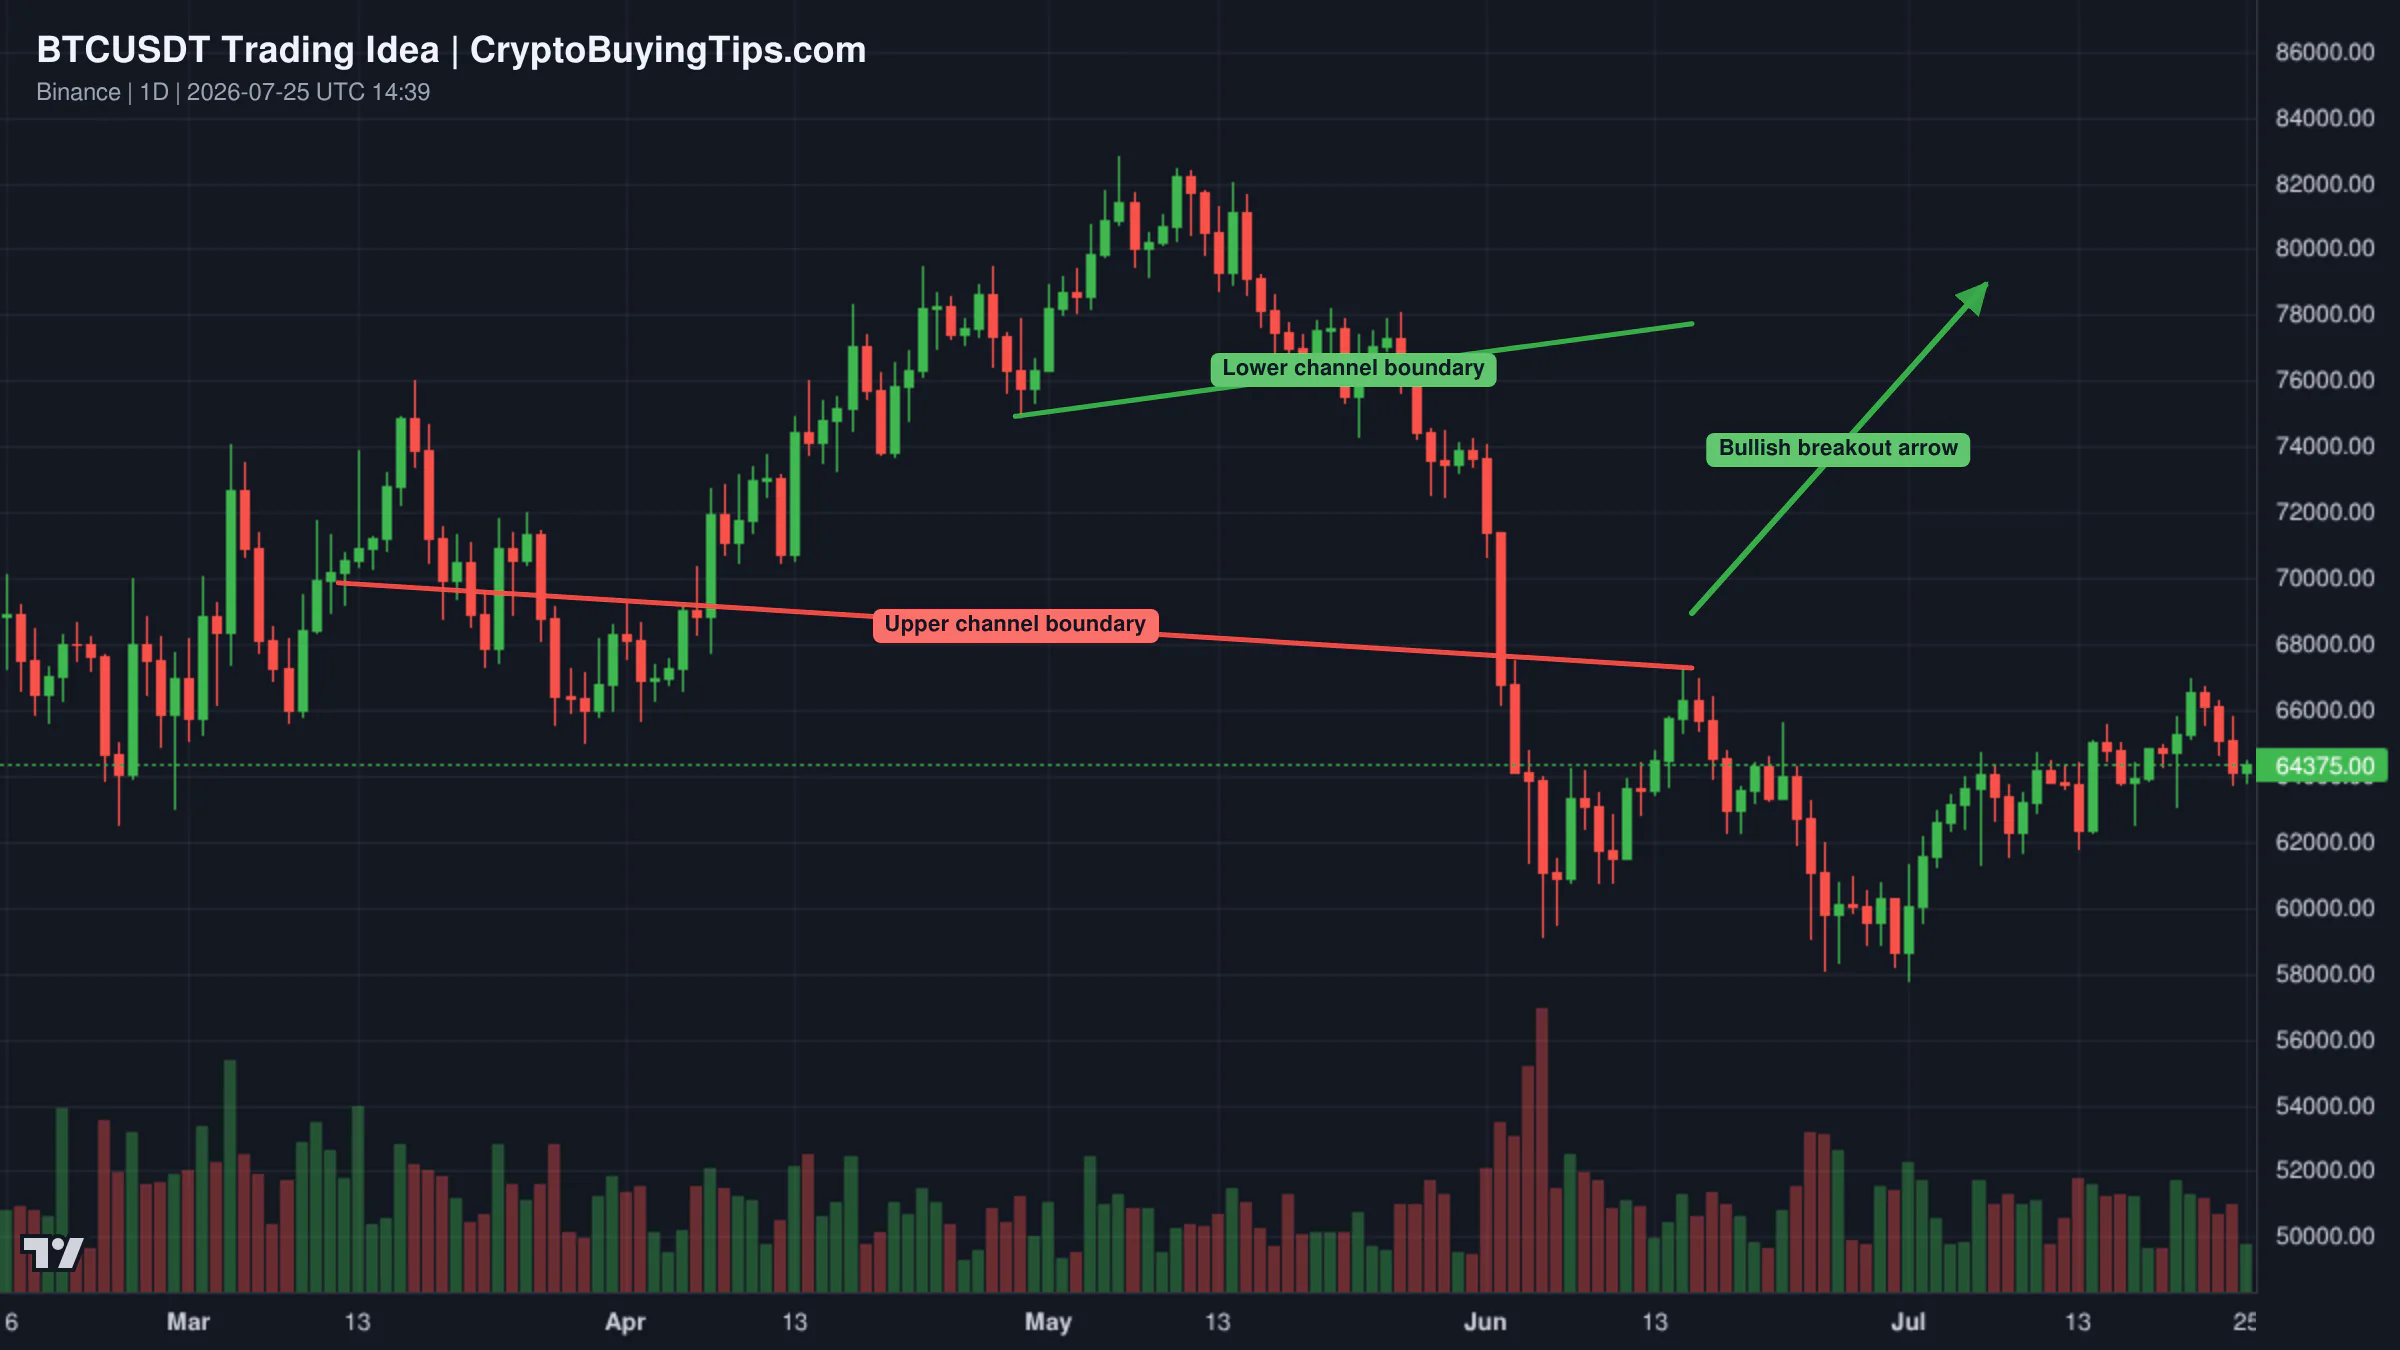
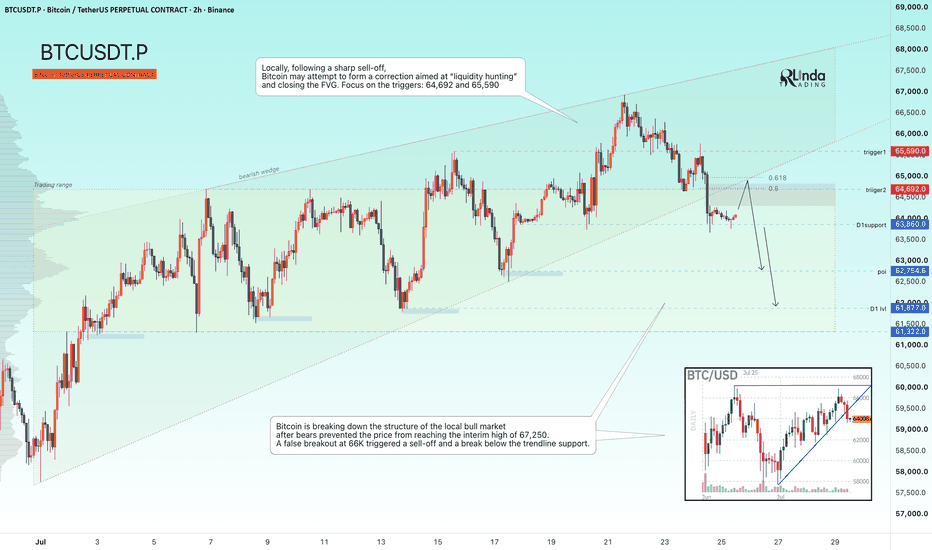
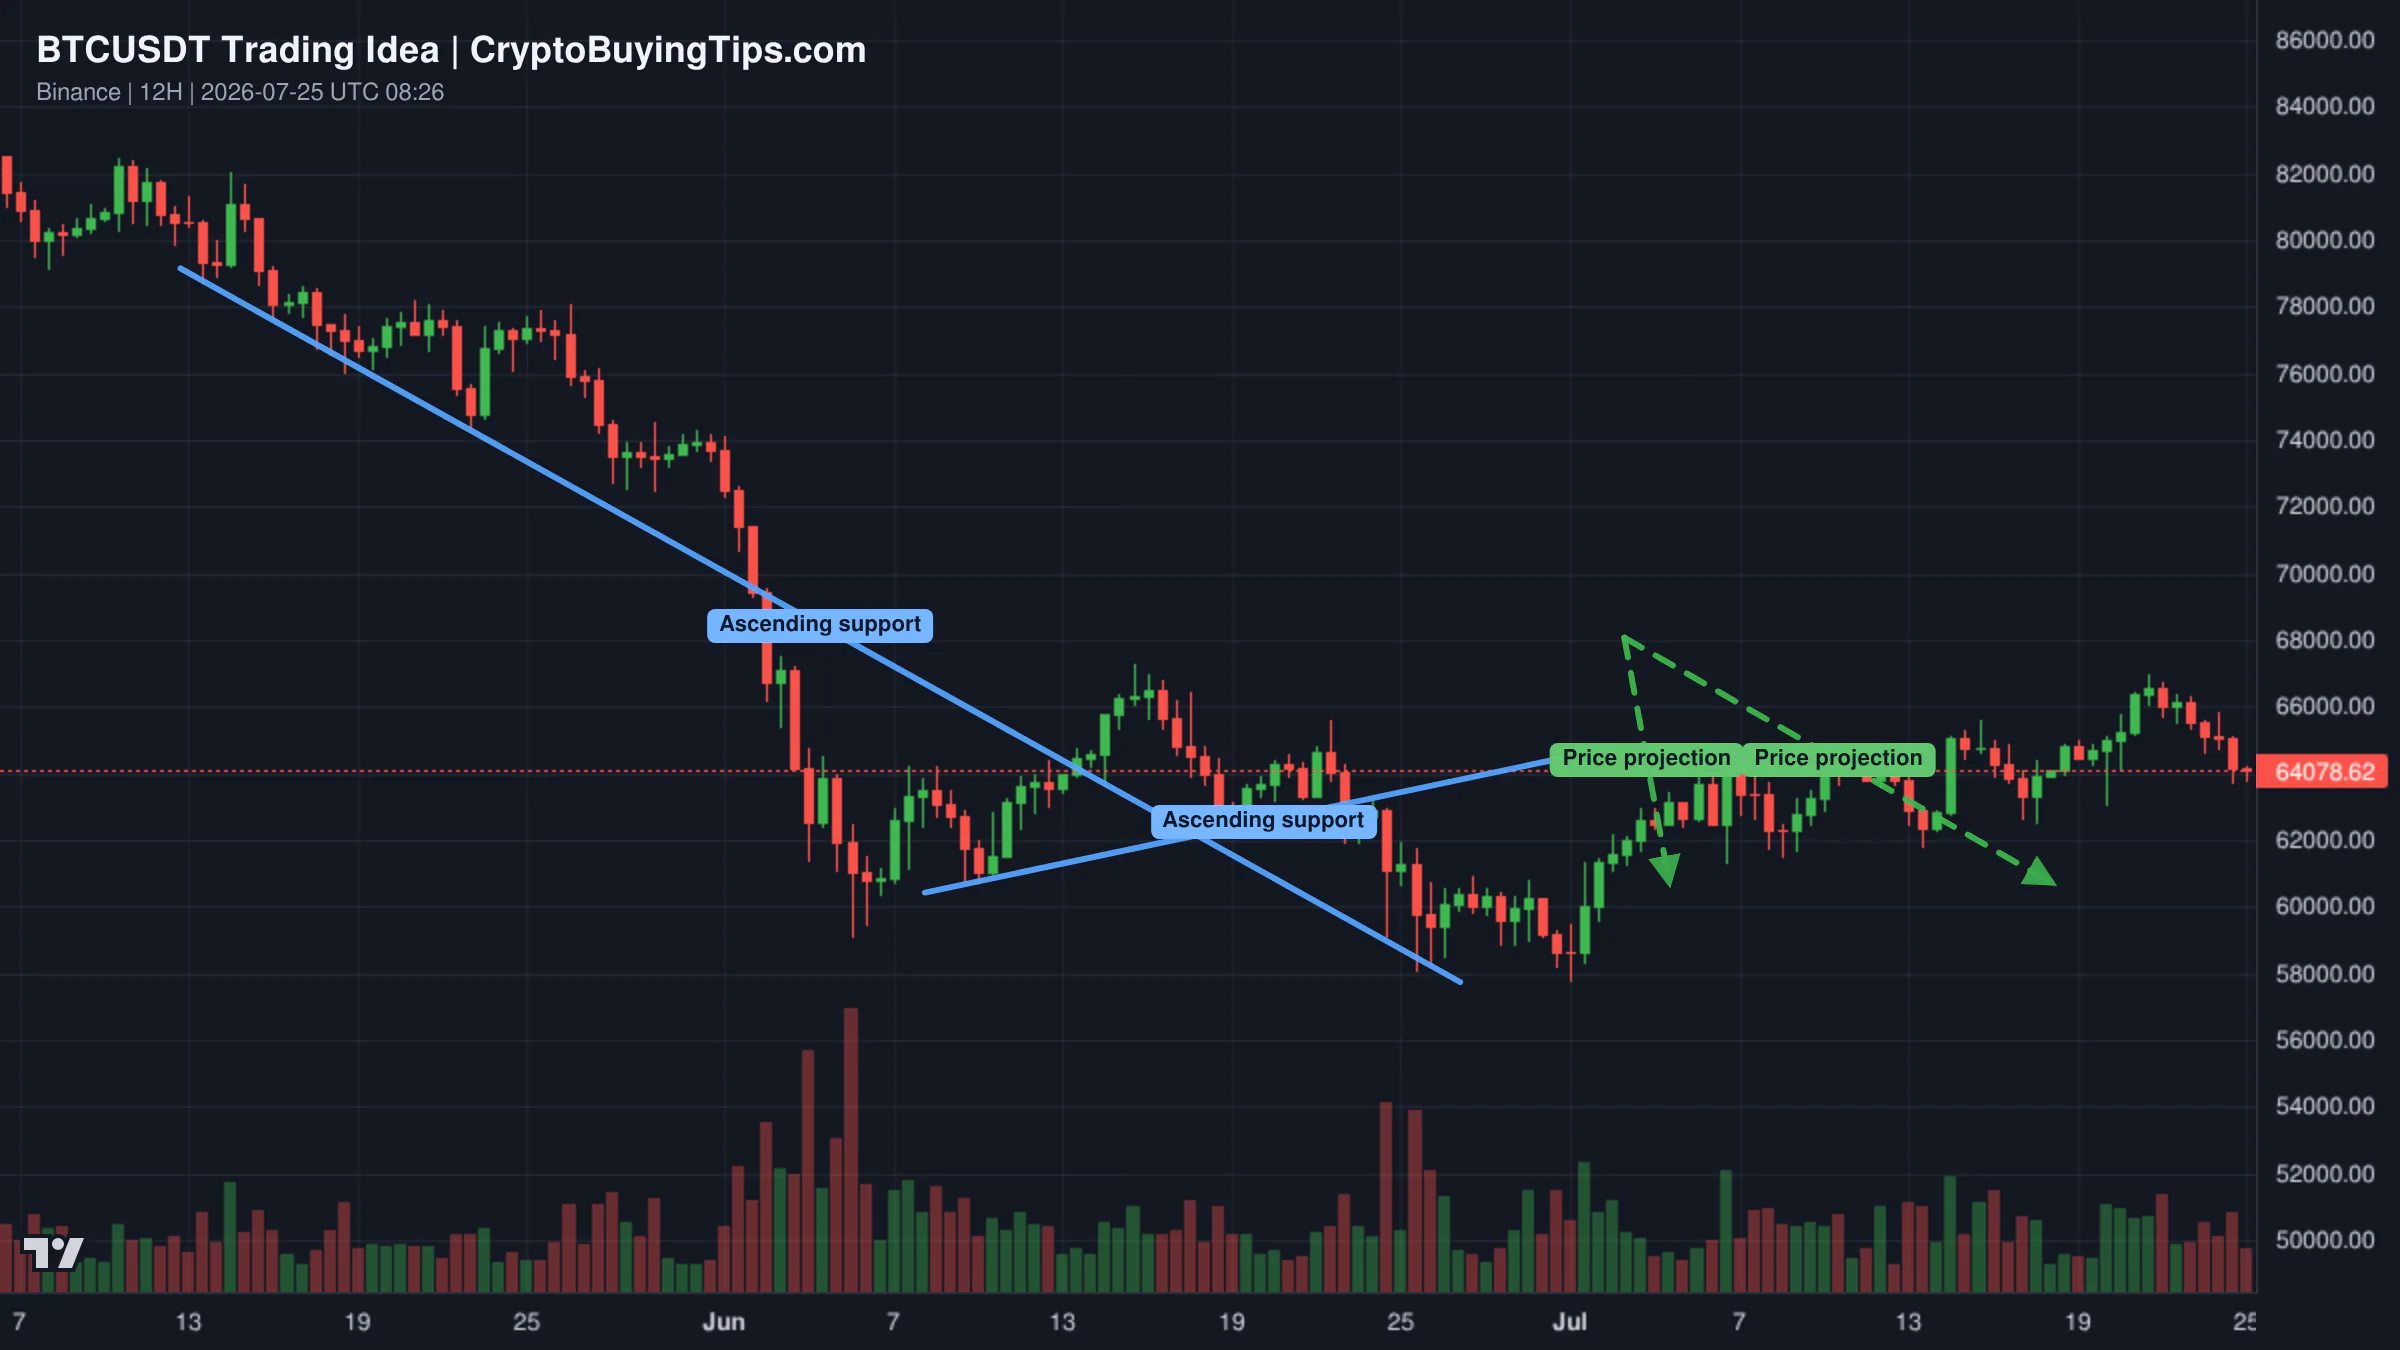
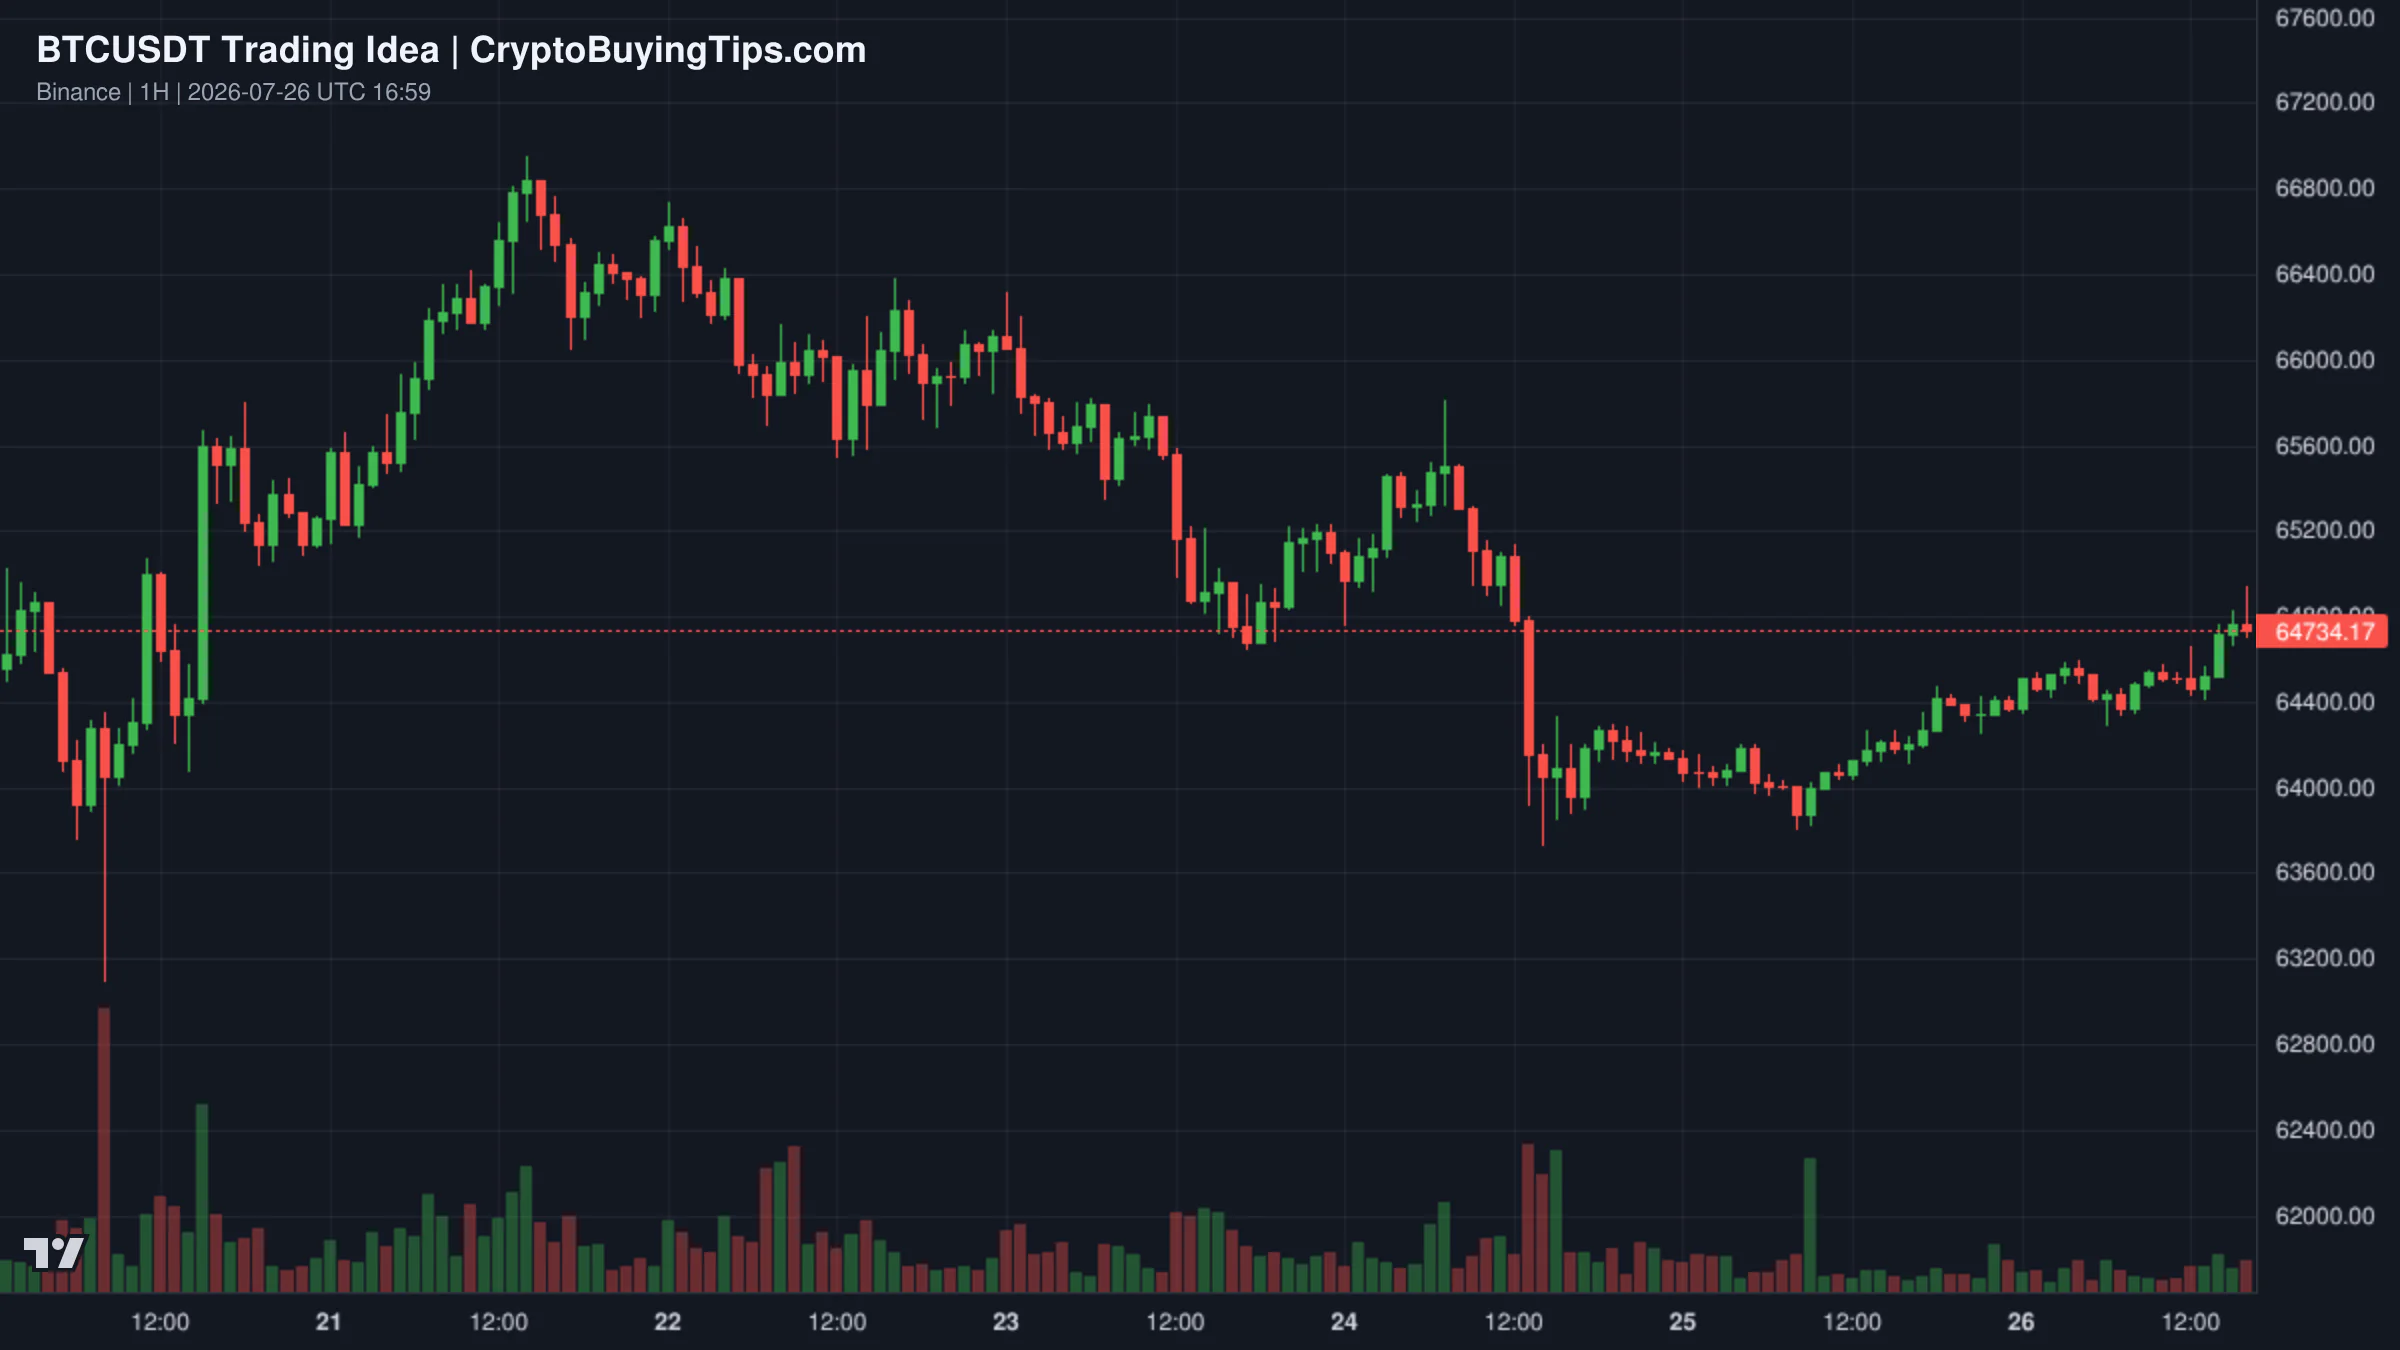
Bitcoin is currently fighting for control around the $64,300 level. According to a bullish setup on the 60-minute chart, if BTC holds this support zone, there is a clear path toward $65,750 and potentially $66,600. The recent bounce suggests that buyers are stepping in, but the move is not yet confirmed. A close below $64,300 would invalidate this short-term bullish structure and likely lead to a retest of lower liquidity.
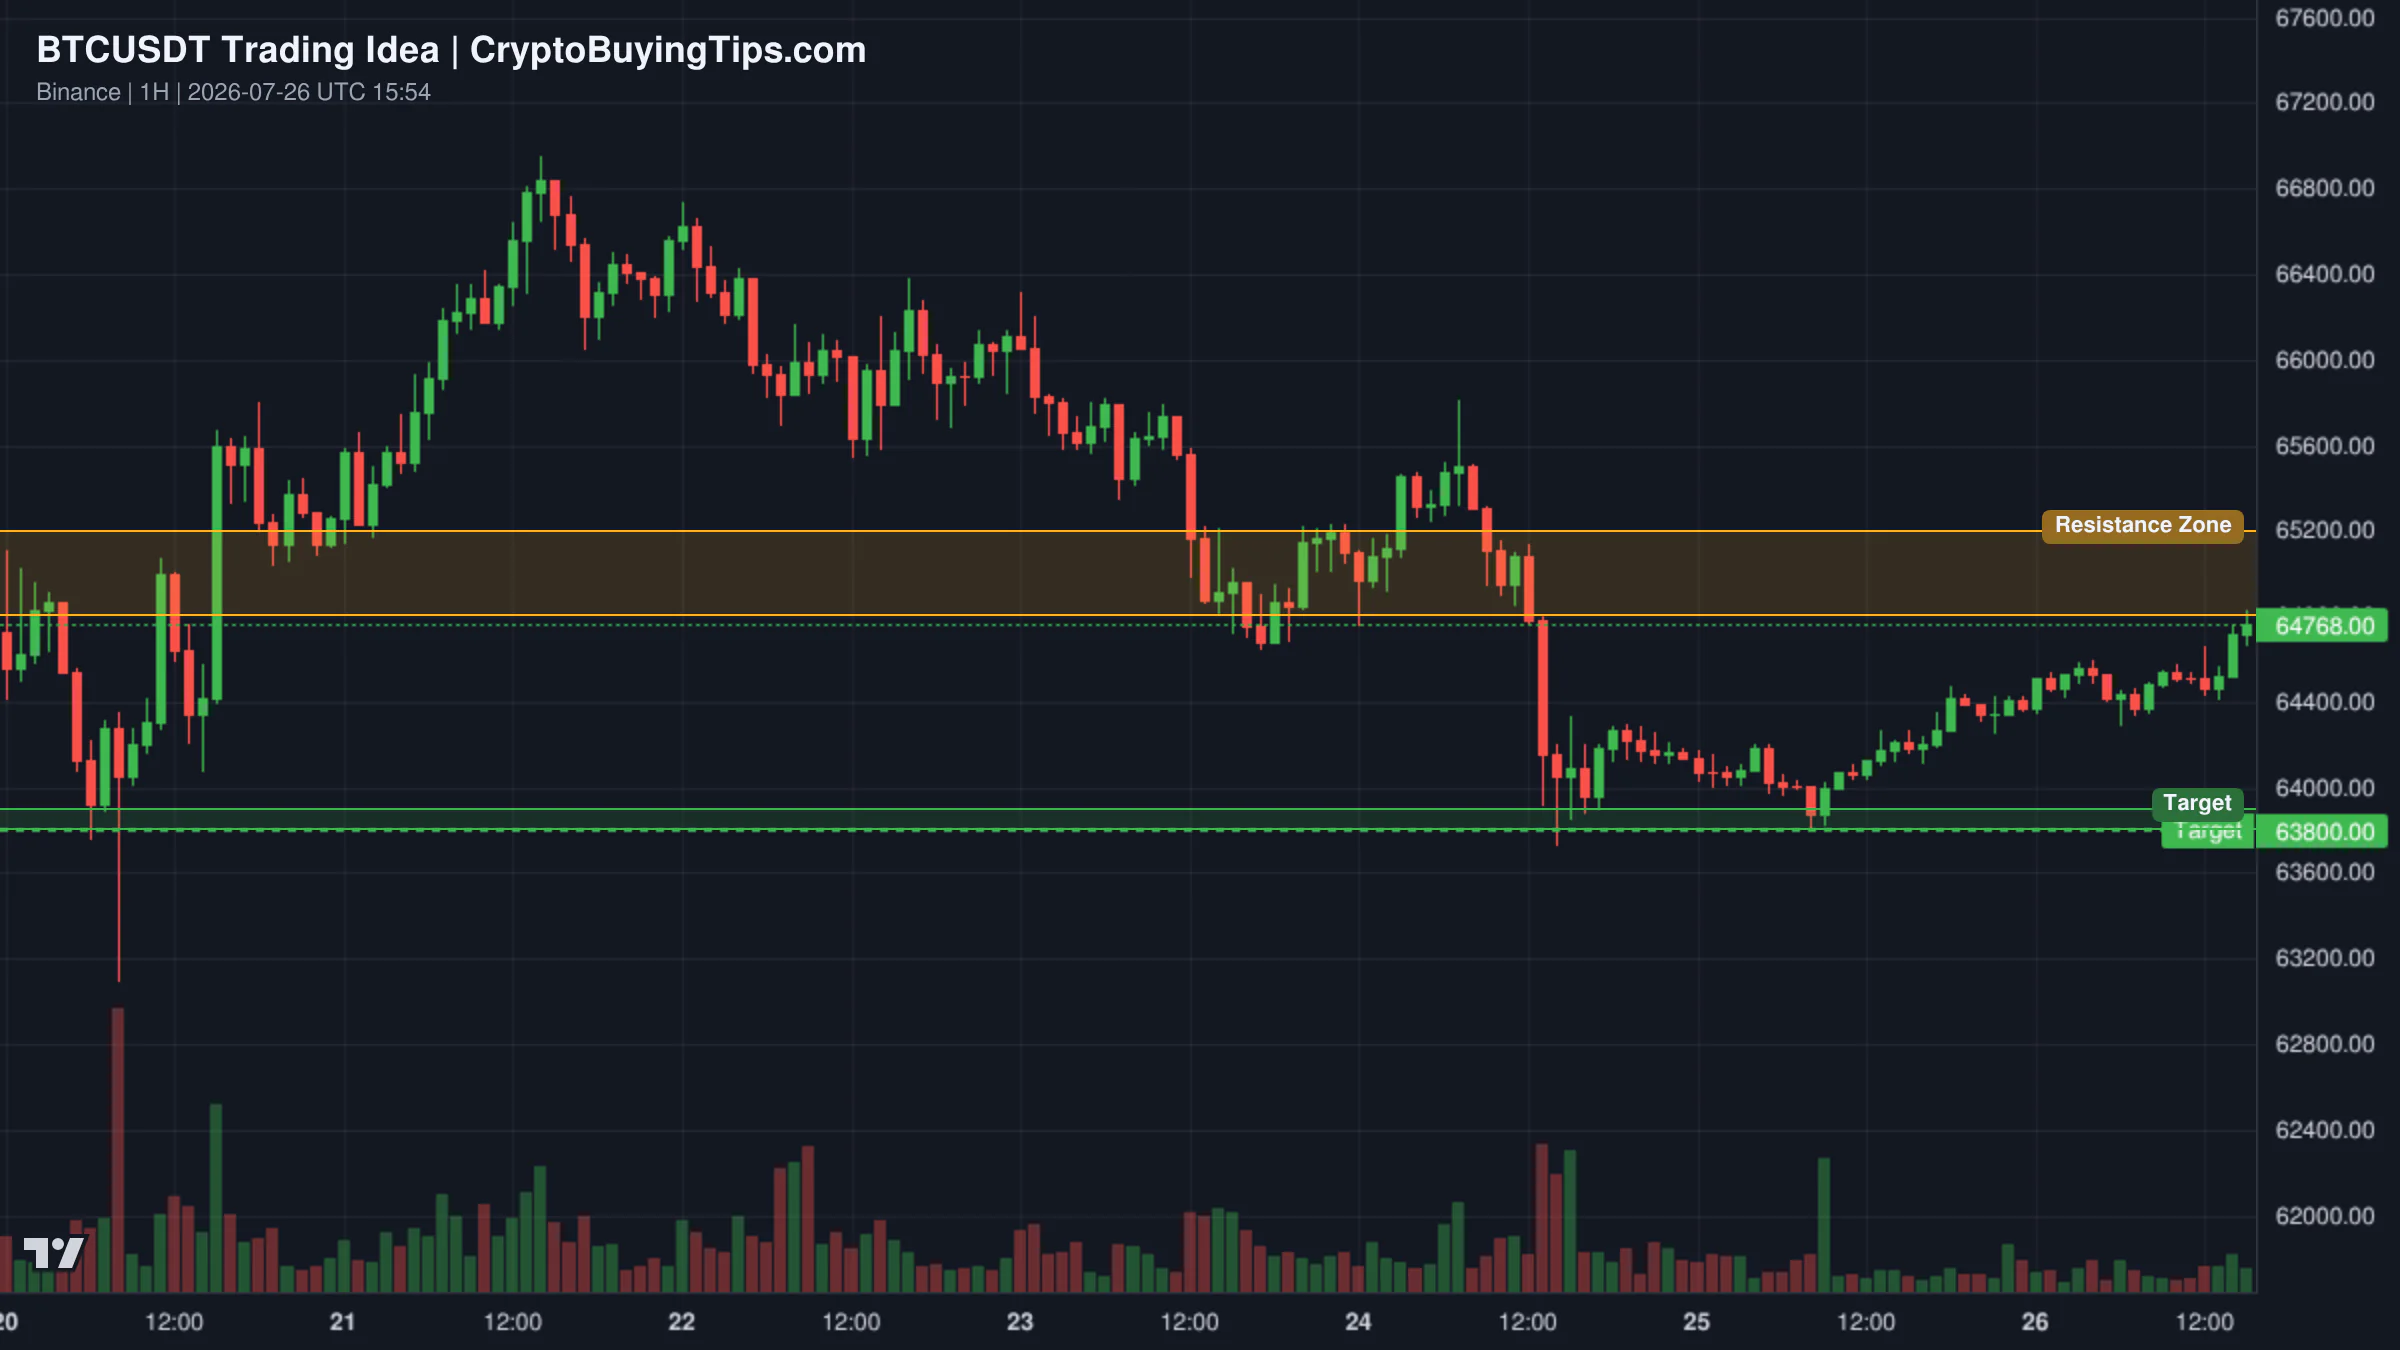
A more cautious read on BTCUSDT suggests we are hitting a wall. Price action has pushed into a major supply zone between $64,800 and $65,200, which aligns with a descending trendline. Having just completed a double bottom pattern with a target near $64,800, the momentum appears to be tapering off. If sellers step in with conviction at this resistance, we could see a move back down to the $63,800 liquidity pool.
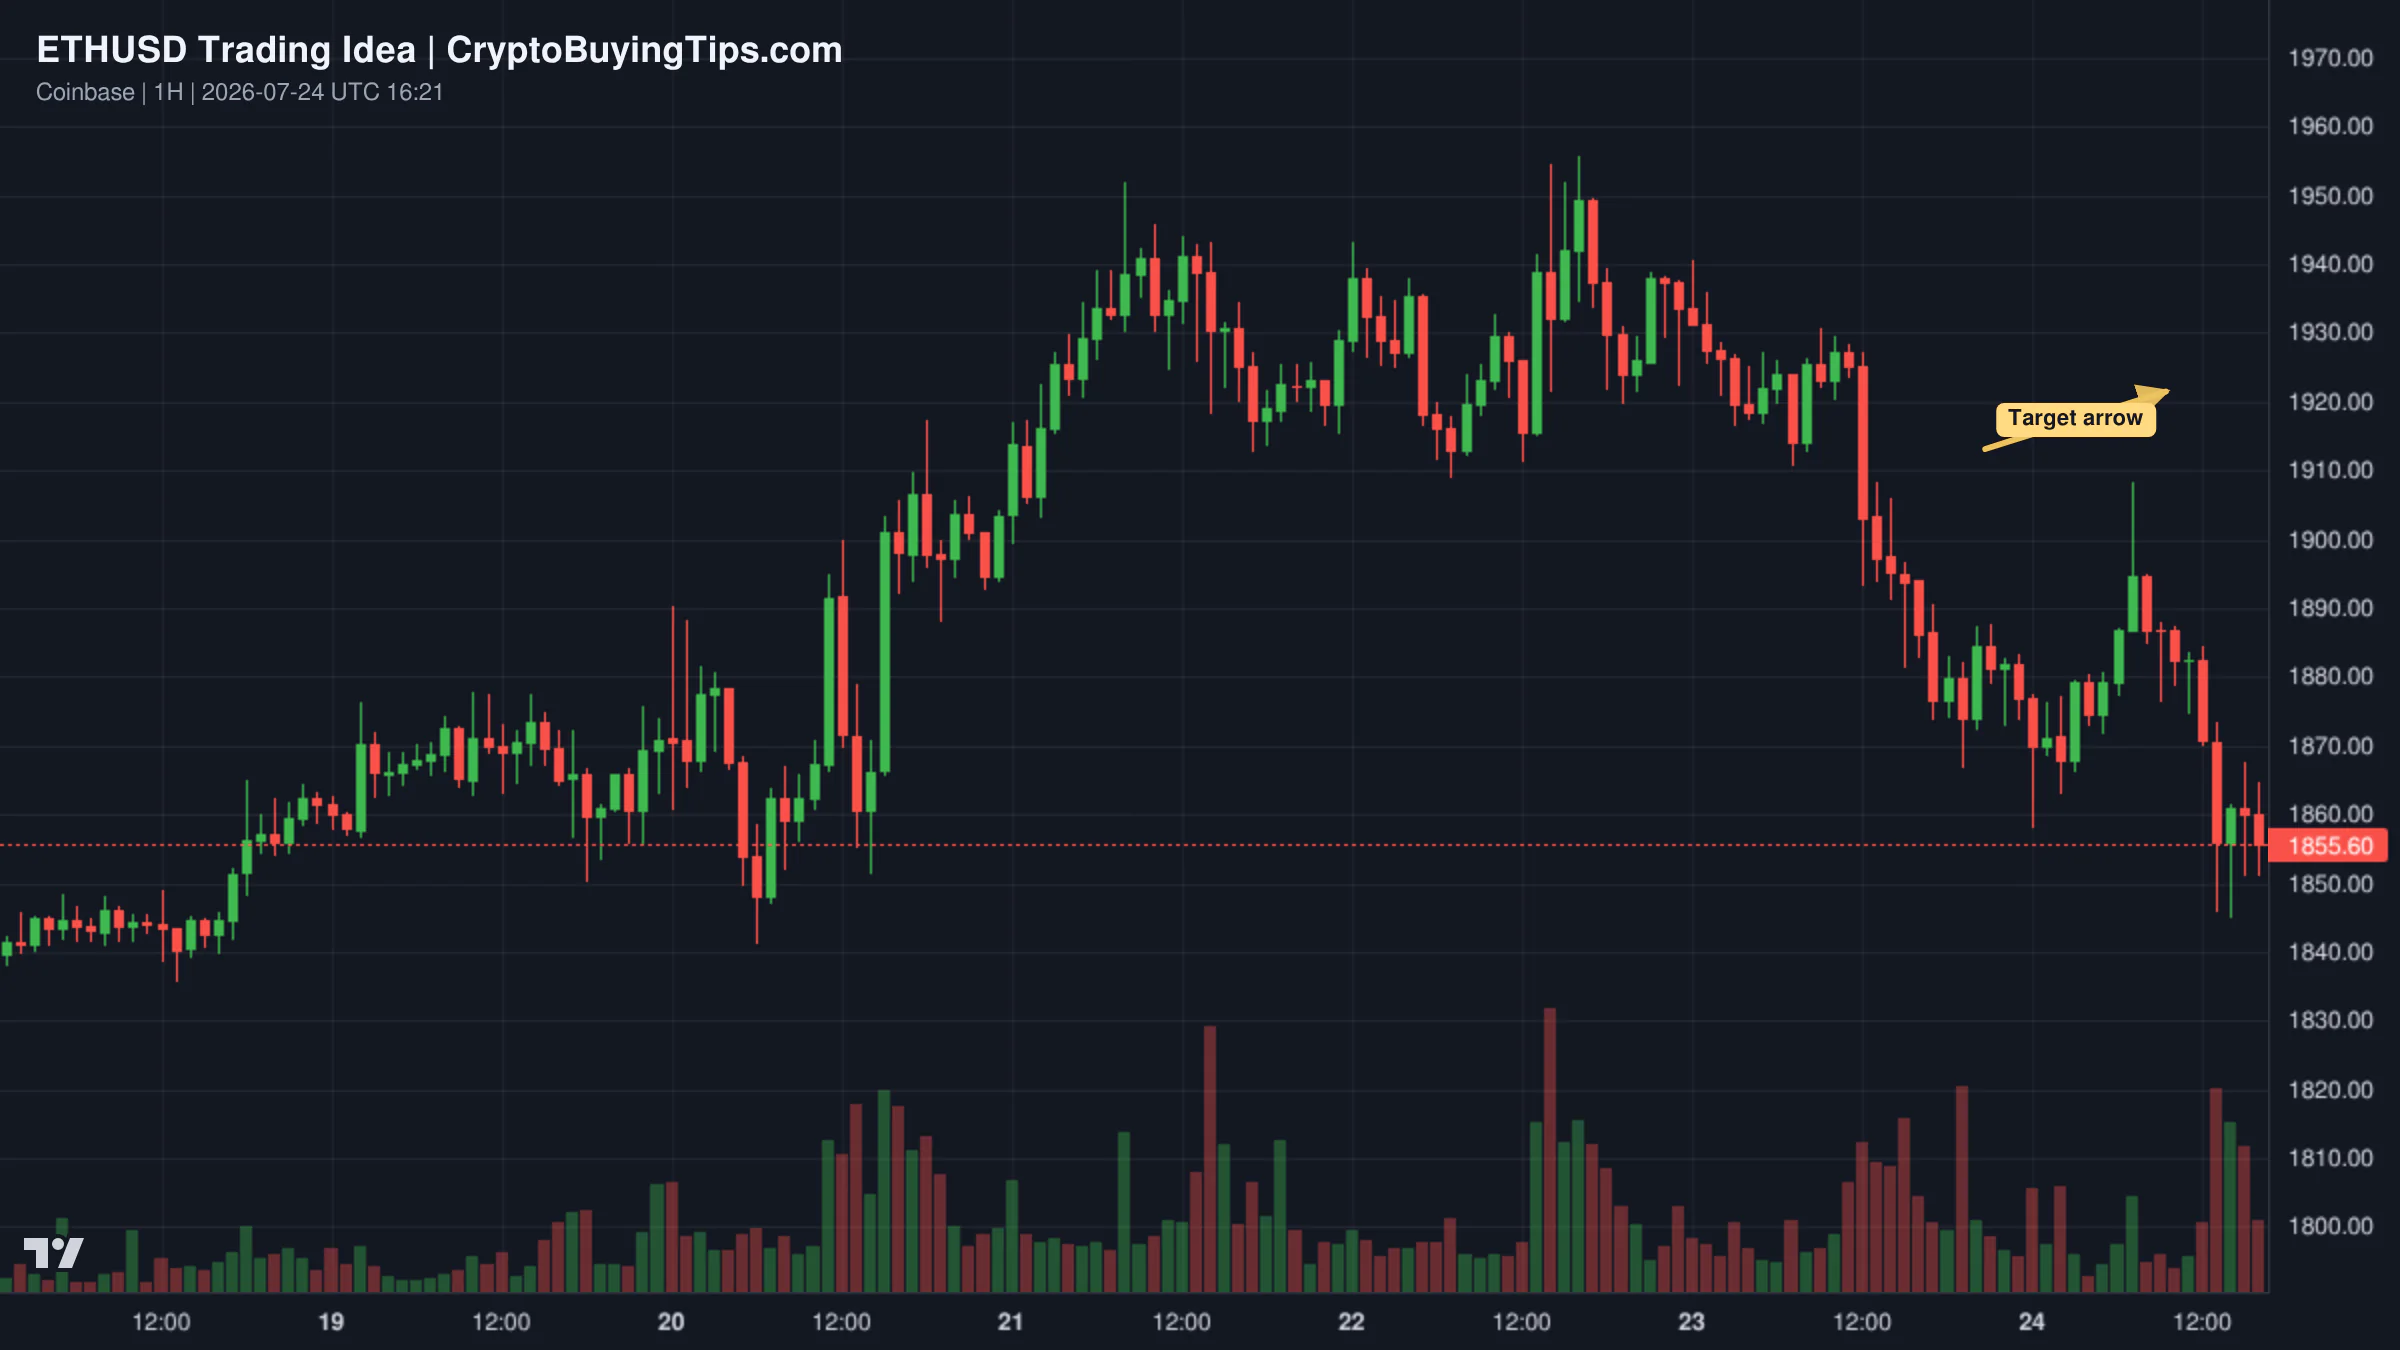
For Ethereum, a 4-hour chart shows the asset coiling inside a massive ascending wedge. After testing the $1,960 resistance ceiling, ETH is experiencing a controlled pullback. The high-confluence demand zone sits between $1,910 and $1,925. A bounce from this wedge support would provide a low-risk entry for a move back toward $1,960. The risk here is a 4-hour close below $1,885, which would break the wedge and signal a deeper correction.
Smart Money Signals — Hyperliquid Leaderboard
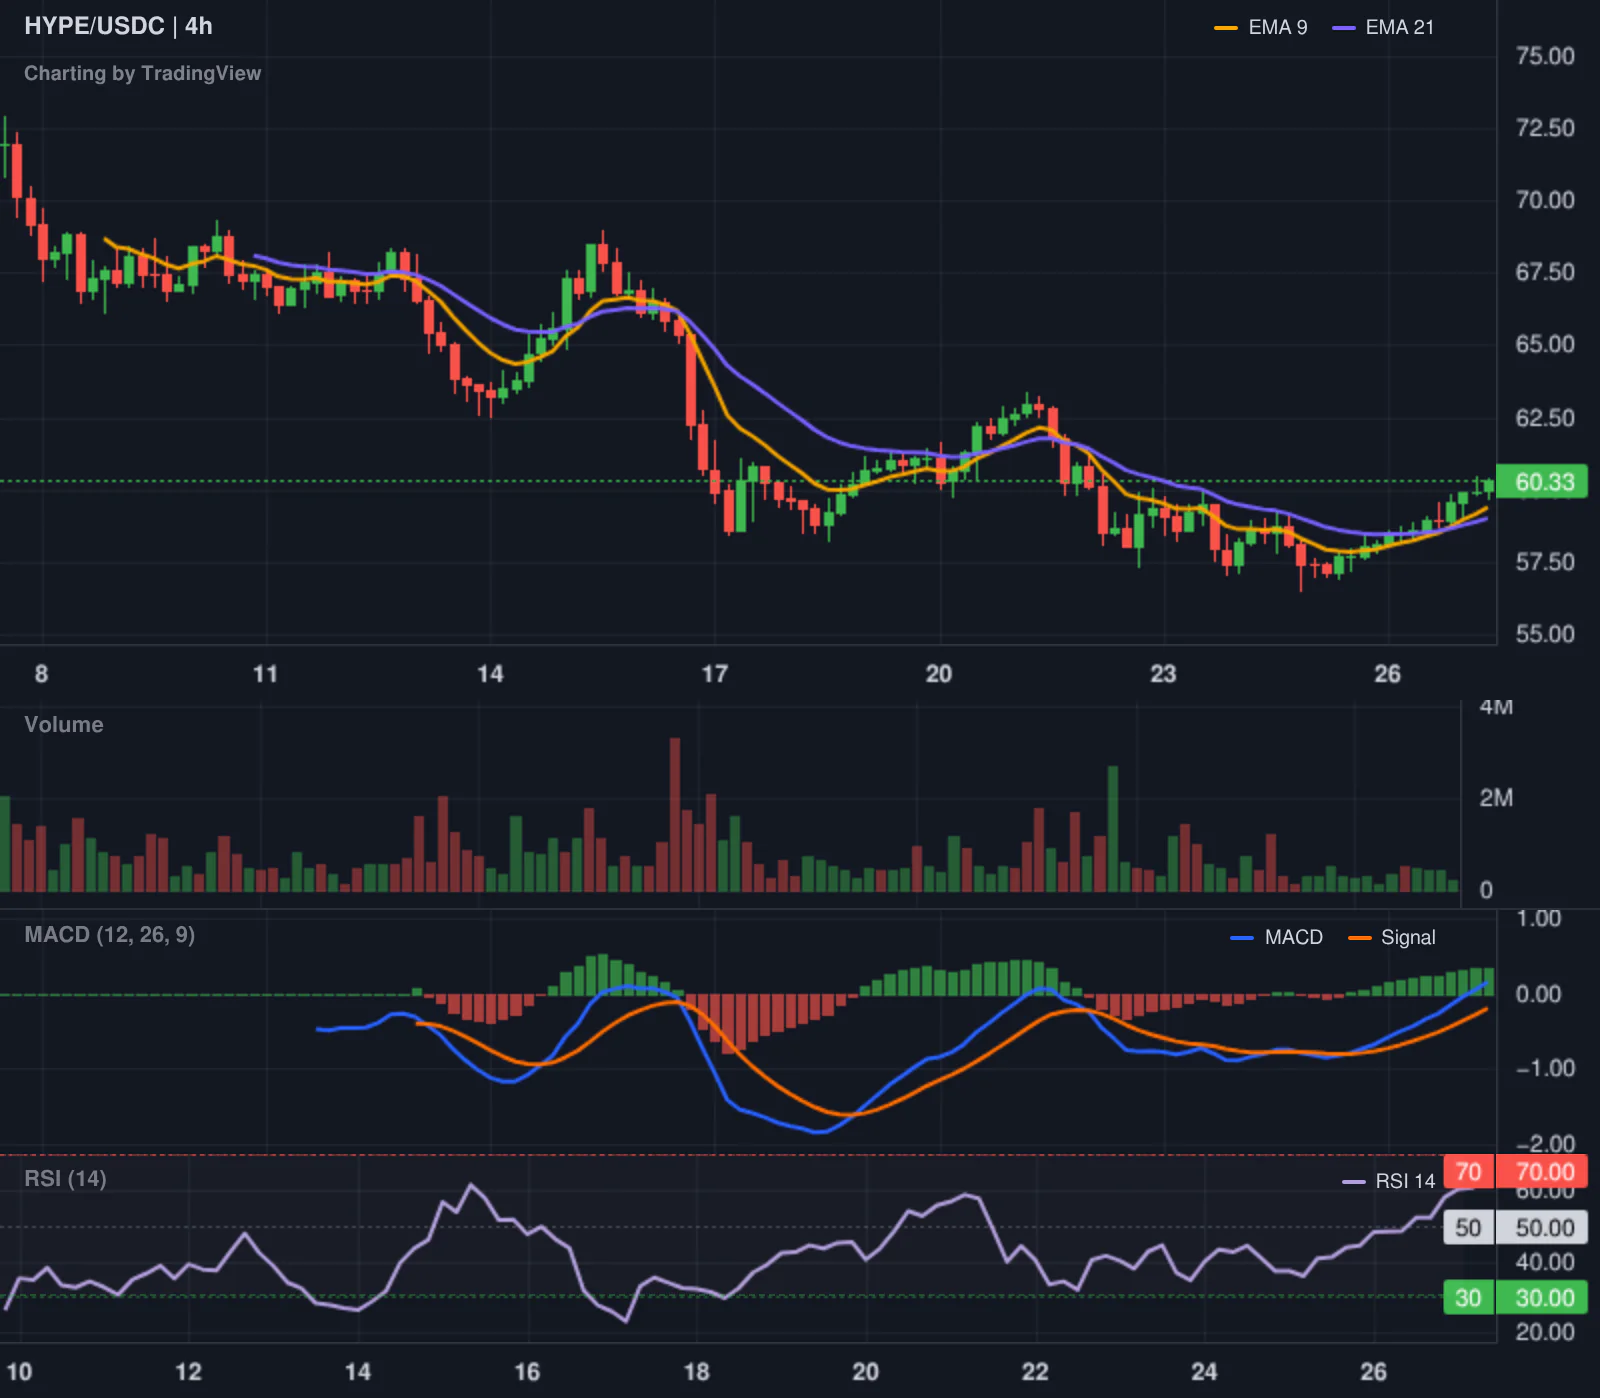
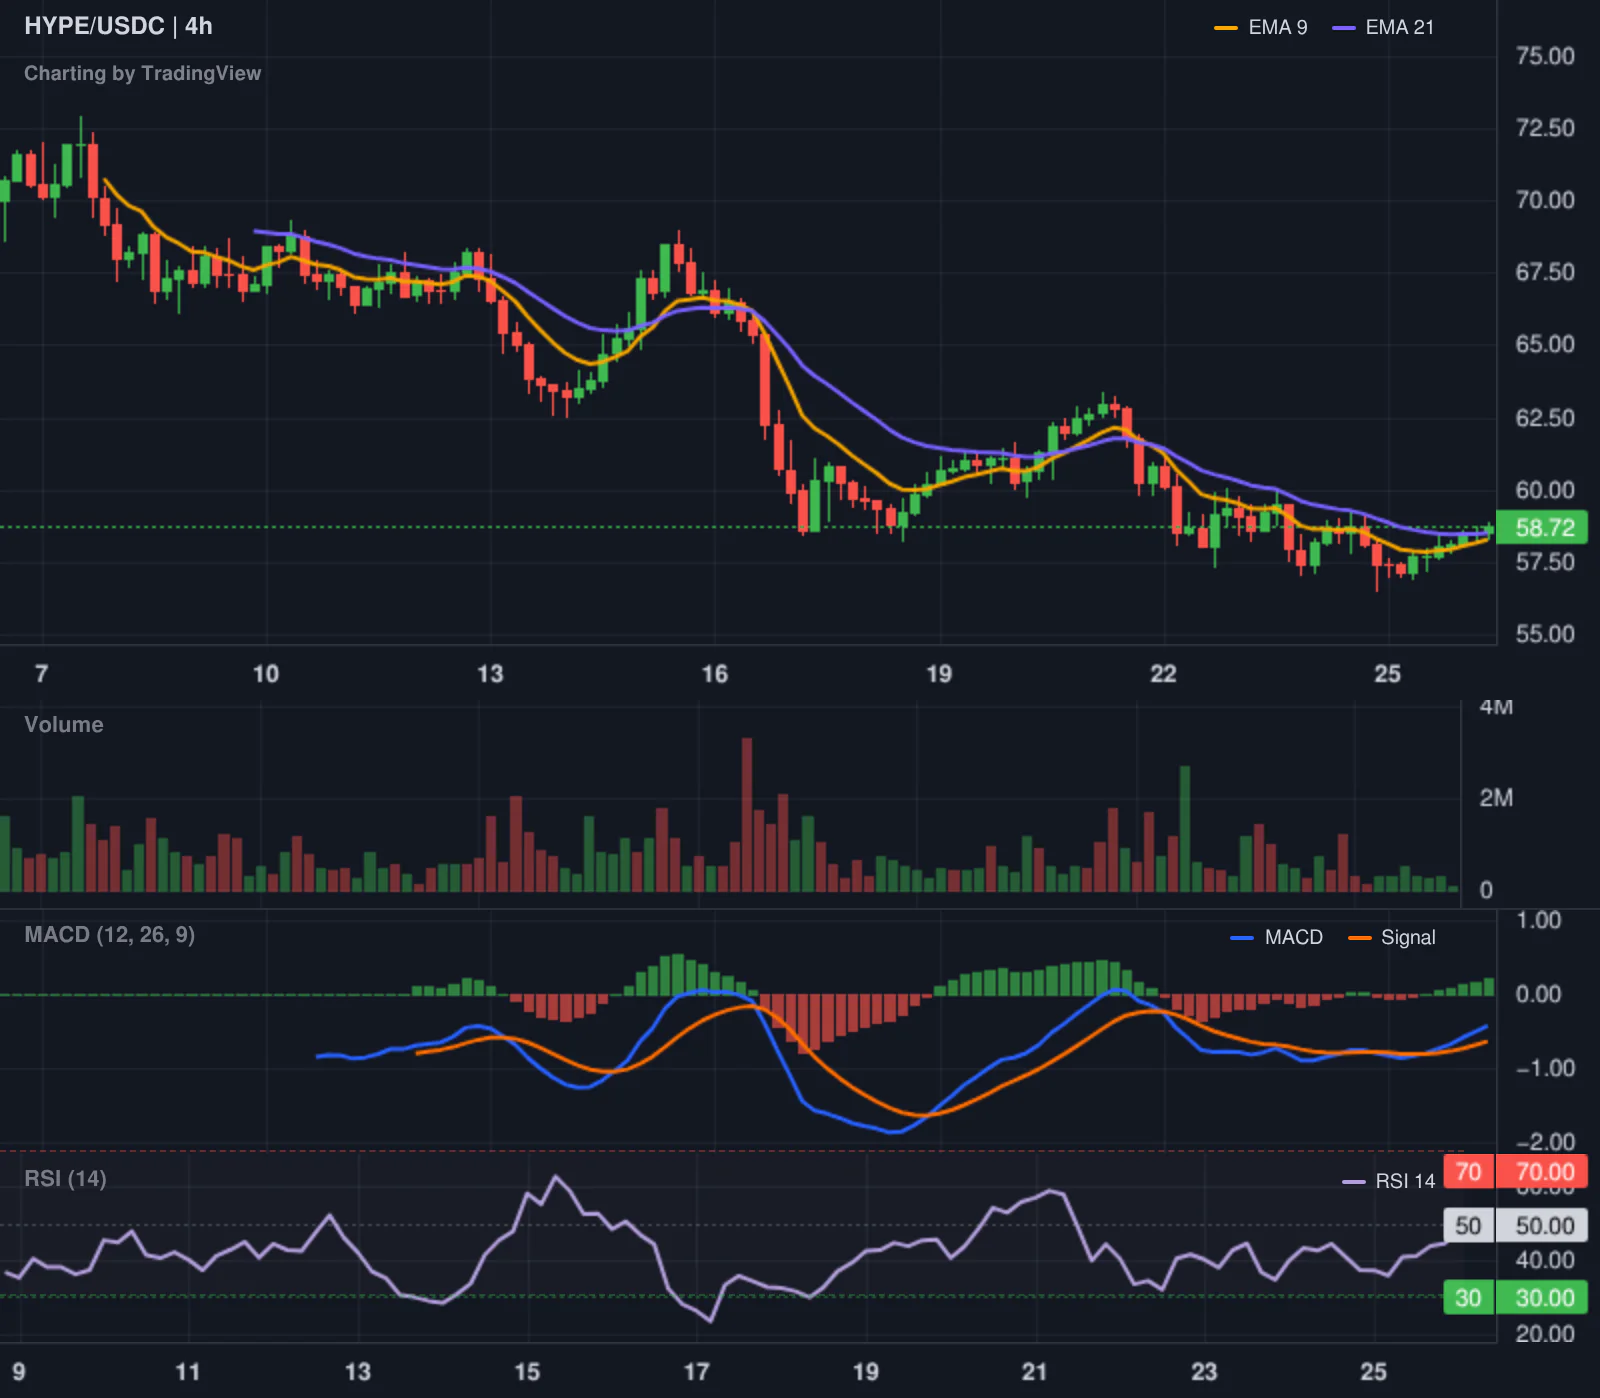
The Hyperliquid leaderboard provides a sharp contrast to the general bullish drift. Top trader @TudorCross, who carries a staggering 6136% 30-day ROI, has opened a short position in HYPE at an entry price of $58.17. The notional value of the trade is $40,676.54. While the asset is currently trading higher at $60.27, the fact that a high-conviction trader is fading the move suggests that the recent rally in HYPE may be overextended.
Altcoin Spotlight
Injective (INJ) deserves attention today, not because of a chart pattern, but because of its emerging role in corporate finance. The partnership with POSCO International and LG CNS to tokenize live commercial invoices is a legitimate utility play. Most altcoins promise to "change the world" with vague roadmaps, but moving actual corporate receivables onto a blockchain is a tangible win. If other South Korean giants follow suit, Injective could move from a speculative asset to a piece of critical financial infrastructure.
What to watch next
The focus for the next 48 hours is the July 29 FOMC meeting. With a 36.3% chance of a rate hike, the market is on edge. A hike, or even a hawkish tone from the Fed, could quickly flush out the excessive leverage we are currently seeing in the derivatives market.
We are also keeping an eye on the BitMart wind-down. If the withdrawal issues escalate, it could trigger a wider contagion of distrust among users of mid-tier exchanges. The gap between the "Fear" sentiment and the rising prices is a coiled spring. Whether that spring shoots upward or snaps downward depends entirely on whether the institutional ETF inflows can outweigh the retail panic and the Fed's next move.