Market Overviews

Daily crypto market overviews, trend analysis, and key updates from our editorial team.

Crypto Market Overview | Derivatives volume spikes amid regulatory divergence across Asia | July 13, 2026
Sigrid Voss·

Crypto Market Overview | Derivatives volume spikes amid regulatory divergence across Asia | July 13, 2026

Market overview

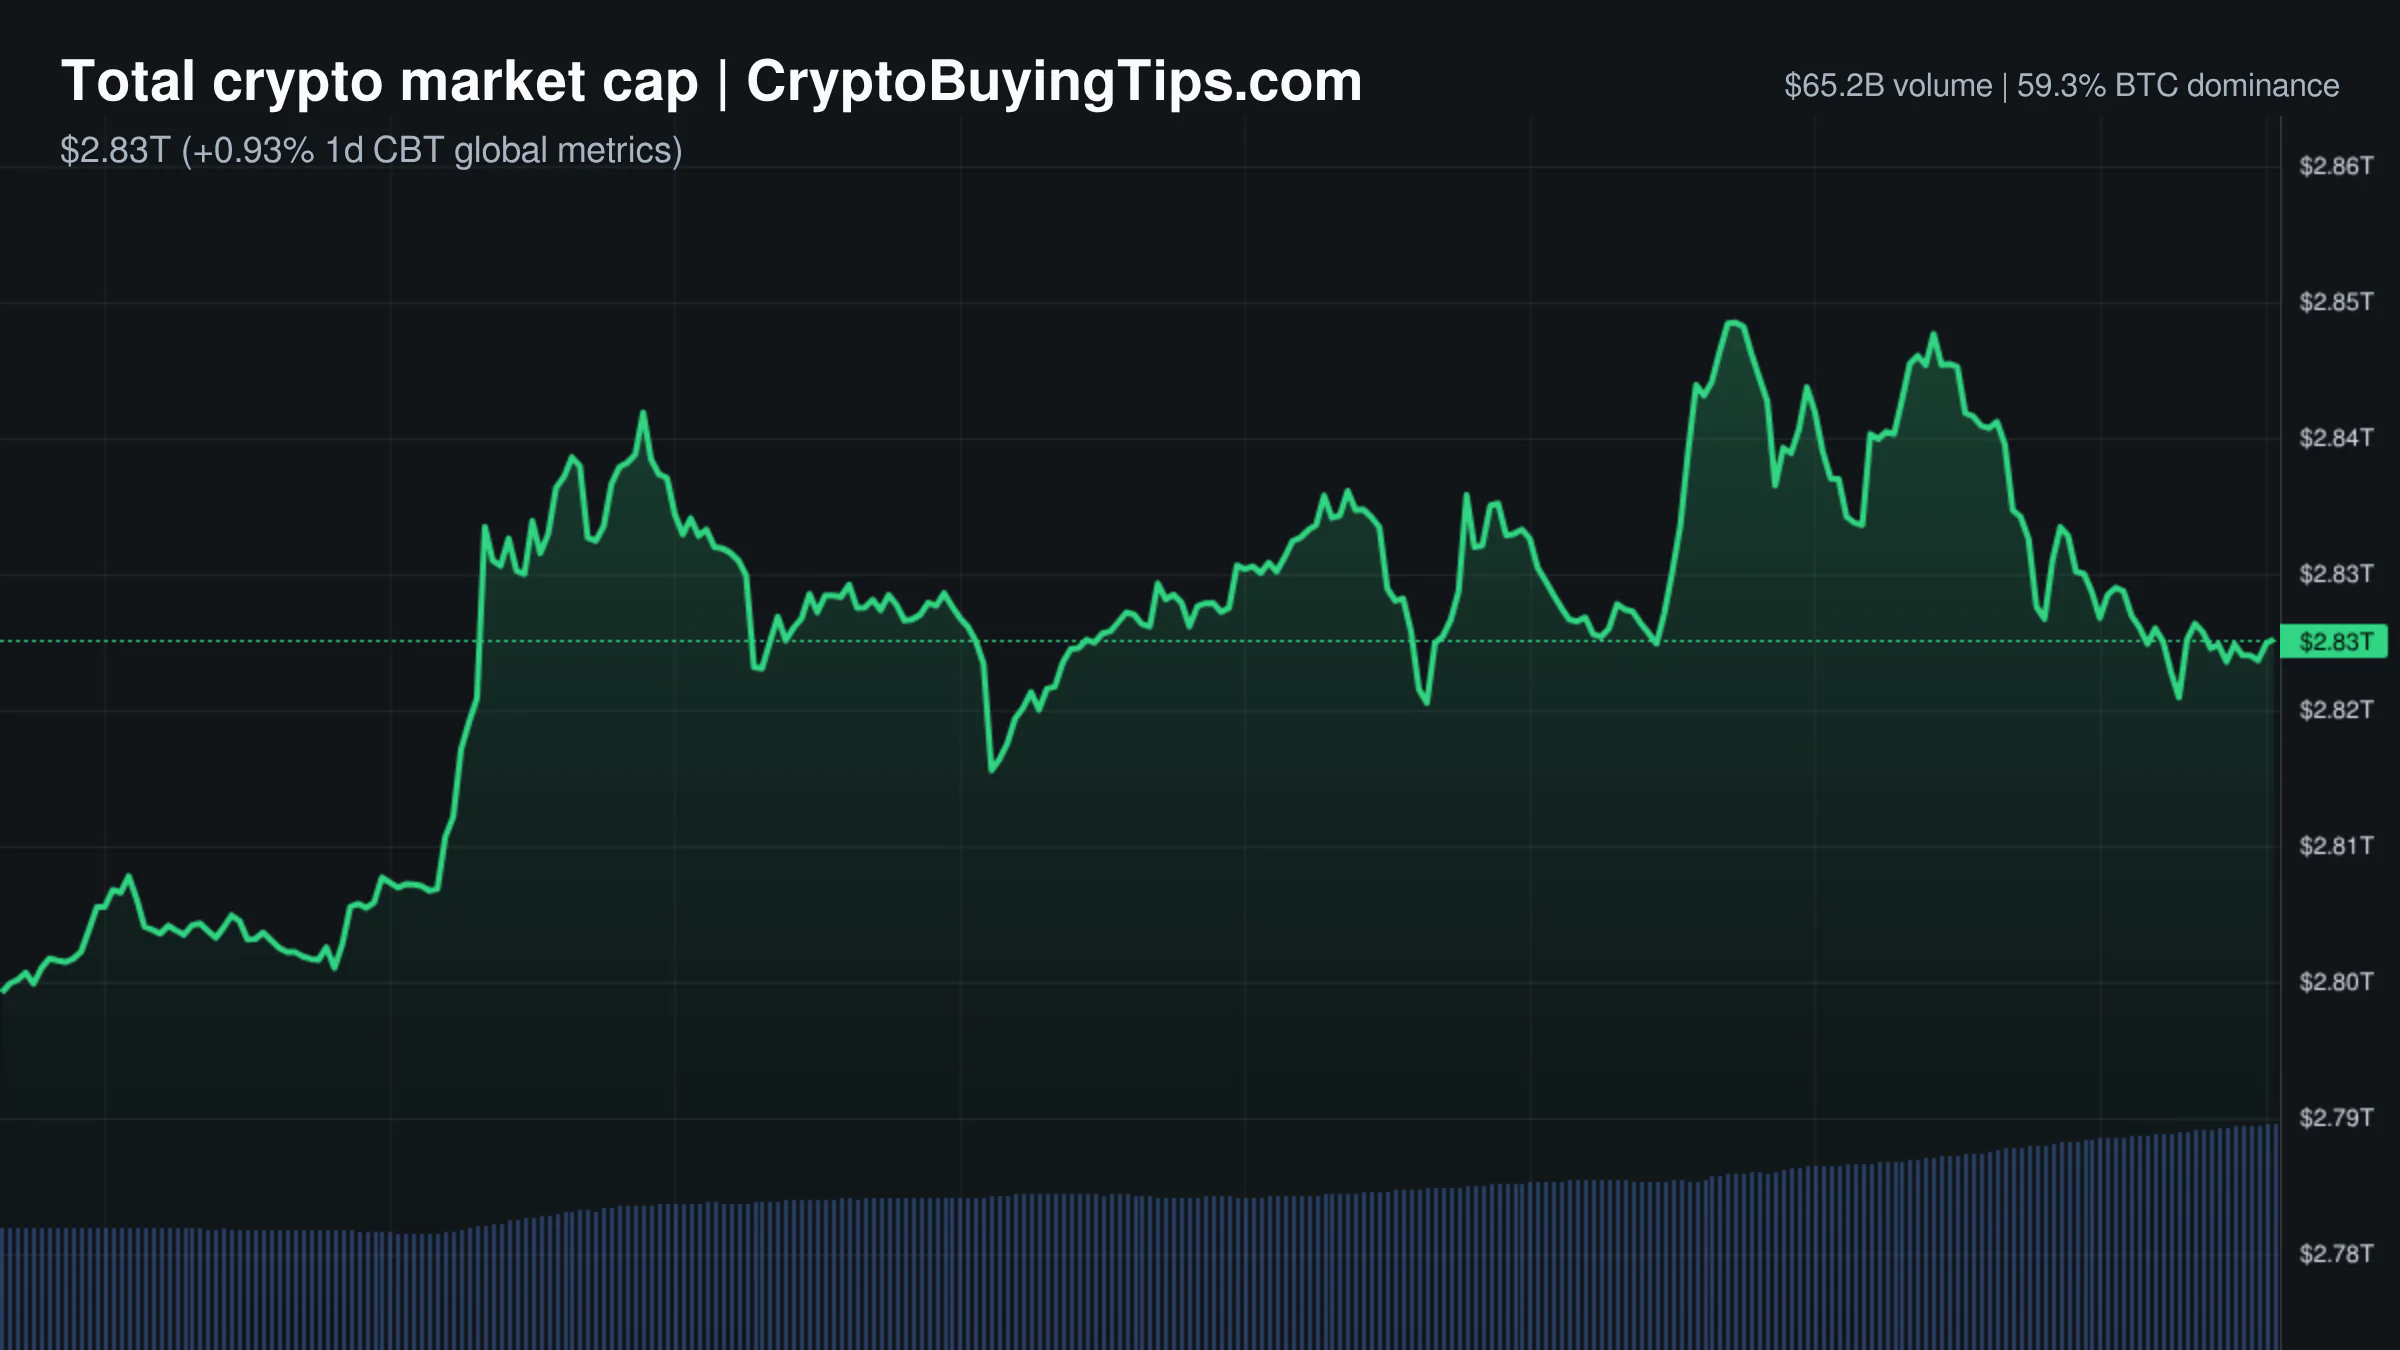
The crypto market is currently experiencing a curious disconnect between price action and trader activity. While the total market cap has dipped to approximately $2.25 trillion, representing a 1.19% decline over the last 24 hours, the derivatives market is in a state of high agitation. Trading volume in derivatives has spiked by 36.33% to reach $530.91 billion, vastly outpacing the modest 2.88% growth in spot volume. This suggests that the current price decline is not a simple lack of interest but rather a high-leverage battle where positioning is shifting rapidly.

Sentiment has soured significantly, with the Fear and Greed Index sitting at 29. This level of fear usually indicates that retail participants are retreating, though it often provides the liquidity that institutional buyers require to build positions. Bitcoin dominance remains high at 56.08%, while Ethereum dominance lingers around 9.54%. The Altcoin Season Index is neutral at 59, meaning capital is not yet rotating aggressively into smaller assets.

The macro environment offers a slight contrast. The S&P 500 and NASDAQ are both trading in the green, up 0.43% and 0.32% respectively. Crypto is currently ignoring the relative strength of traditional equities, which points to asset-specific headwinds rather than a general risk-off event. Stablecoin dominance at 11.45% indicates that a meaningful amount of capital is sitting on the sidelines, waiting for a clear signal to re-enter.

Bitcoin and Ethereum

Bitcoin is trading at $62,894.57, down 1.43% today. The price action is a tug-of-war between institutional absorption and a lack of spot momentum. On the bullish side, spot Bitcoin ETFs snapped an eight-week outflow streak with a net inflow of $197 million. Simultaneously, a whale moved $188 million in BTC after seven years of dormancy. This suggests that long-term holders and institutional desks are repositioning, even as the price drifts lower.

Ethereum is struggling more, priced at $1,778.11 and down 1.13%. The network is currently a ghost town. Gas fees have plummeted to 0.16 Gwei, which is an indicator of exceptionally low on-chain congestion. While BlackRock has $1.1 billion in tokenized assets on Ethereum, this institutional plumbing has not yet translated into a price recovery. We previously covered how Ethereum market share vanishes as the asset trades off its dominance, and today's data supports that continued trend.

Top crypto prices

The broader market is largely red. BNB is down 0.90% to $568.47, and XRP has dropped 1.60% to $1.07. Solana is showing slightly more resilience, down only 0.70% at $76.13. TRON is down 1.03% to $0.3268. Notably, Hyperliquid has seen a sharper decline of 2.56%, bringing its price to $64.99.

News driving today's market

Regulatory pressure in Asia is creating a pincer movement for the industry. Chinese prosecutors are proposing a framework that treats the use of crypto mixers and privacy coins as a presumption of criminal intent for money laundering. This is a direct threat to the perceived usability of privacy-preserving tools. Similarly, the Bank of Thailand is auditing high-volume stablecoin trades, specifically targeting USDT, to crack down on illicit finance. This focus on the "gray economy" increases the operational risk for stablecoin rails in the region.

In contrast, Japan is leaning into adoption. Lawson convenience stores are piloting stablecoin payments using JPYC, and SBI Holdings is launching yen stablecoin lending with a 3% yield. SBI is also partnering with the Solana Foundation to build an on-chain financial market. This institutional embrace in Japan provides a necessary counterweight to the regulatory hostility seen elsewhere.

The institutional flow into Bitcoin ETFs is a critical data point. The $197 million inflow suggests that the "physical floor" for BTC is being established by TradFi capital. However, this is happening while BTC dominance data analysis suggests that capital is consolidating rather than aggressively expanding.

Social intelligence

On-chain activity is a mix of institutional progress and retail chaos. BlackRock now holds $2.93 billion in tokenized assets, with Ethereum and Solana being primary beneficiaries. This is a structural shift that moves crypto away from pure speculation and toward actual financial utility. Circle CEO Jeremy Allaire is also pushing a narrative regarding the "Agentic Economy," where AI agents and on-chain systems converge into a programmable economy.

The retail side remains a minefield. A hacker recently compromised SpaceXAI and Starlink accounts to promote a token called $SCATMAN. The attacker minted 10 trillion tokens and dumped them for roughly $125,000 in ETH. It is a reminder that while the "smart money" builds tokenized funds, the "fast money" is still primarily focused on account compromises and rug pulls.

Trading ideas worth watching

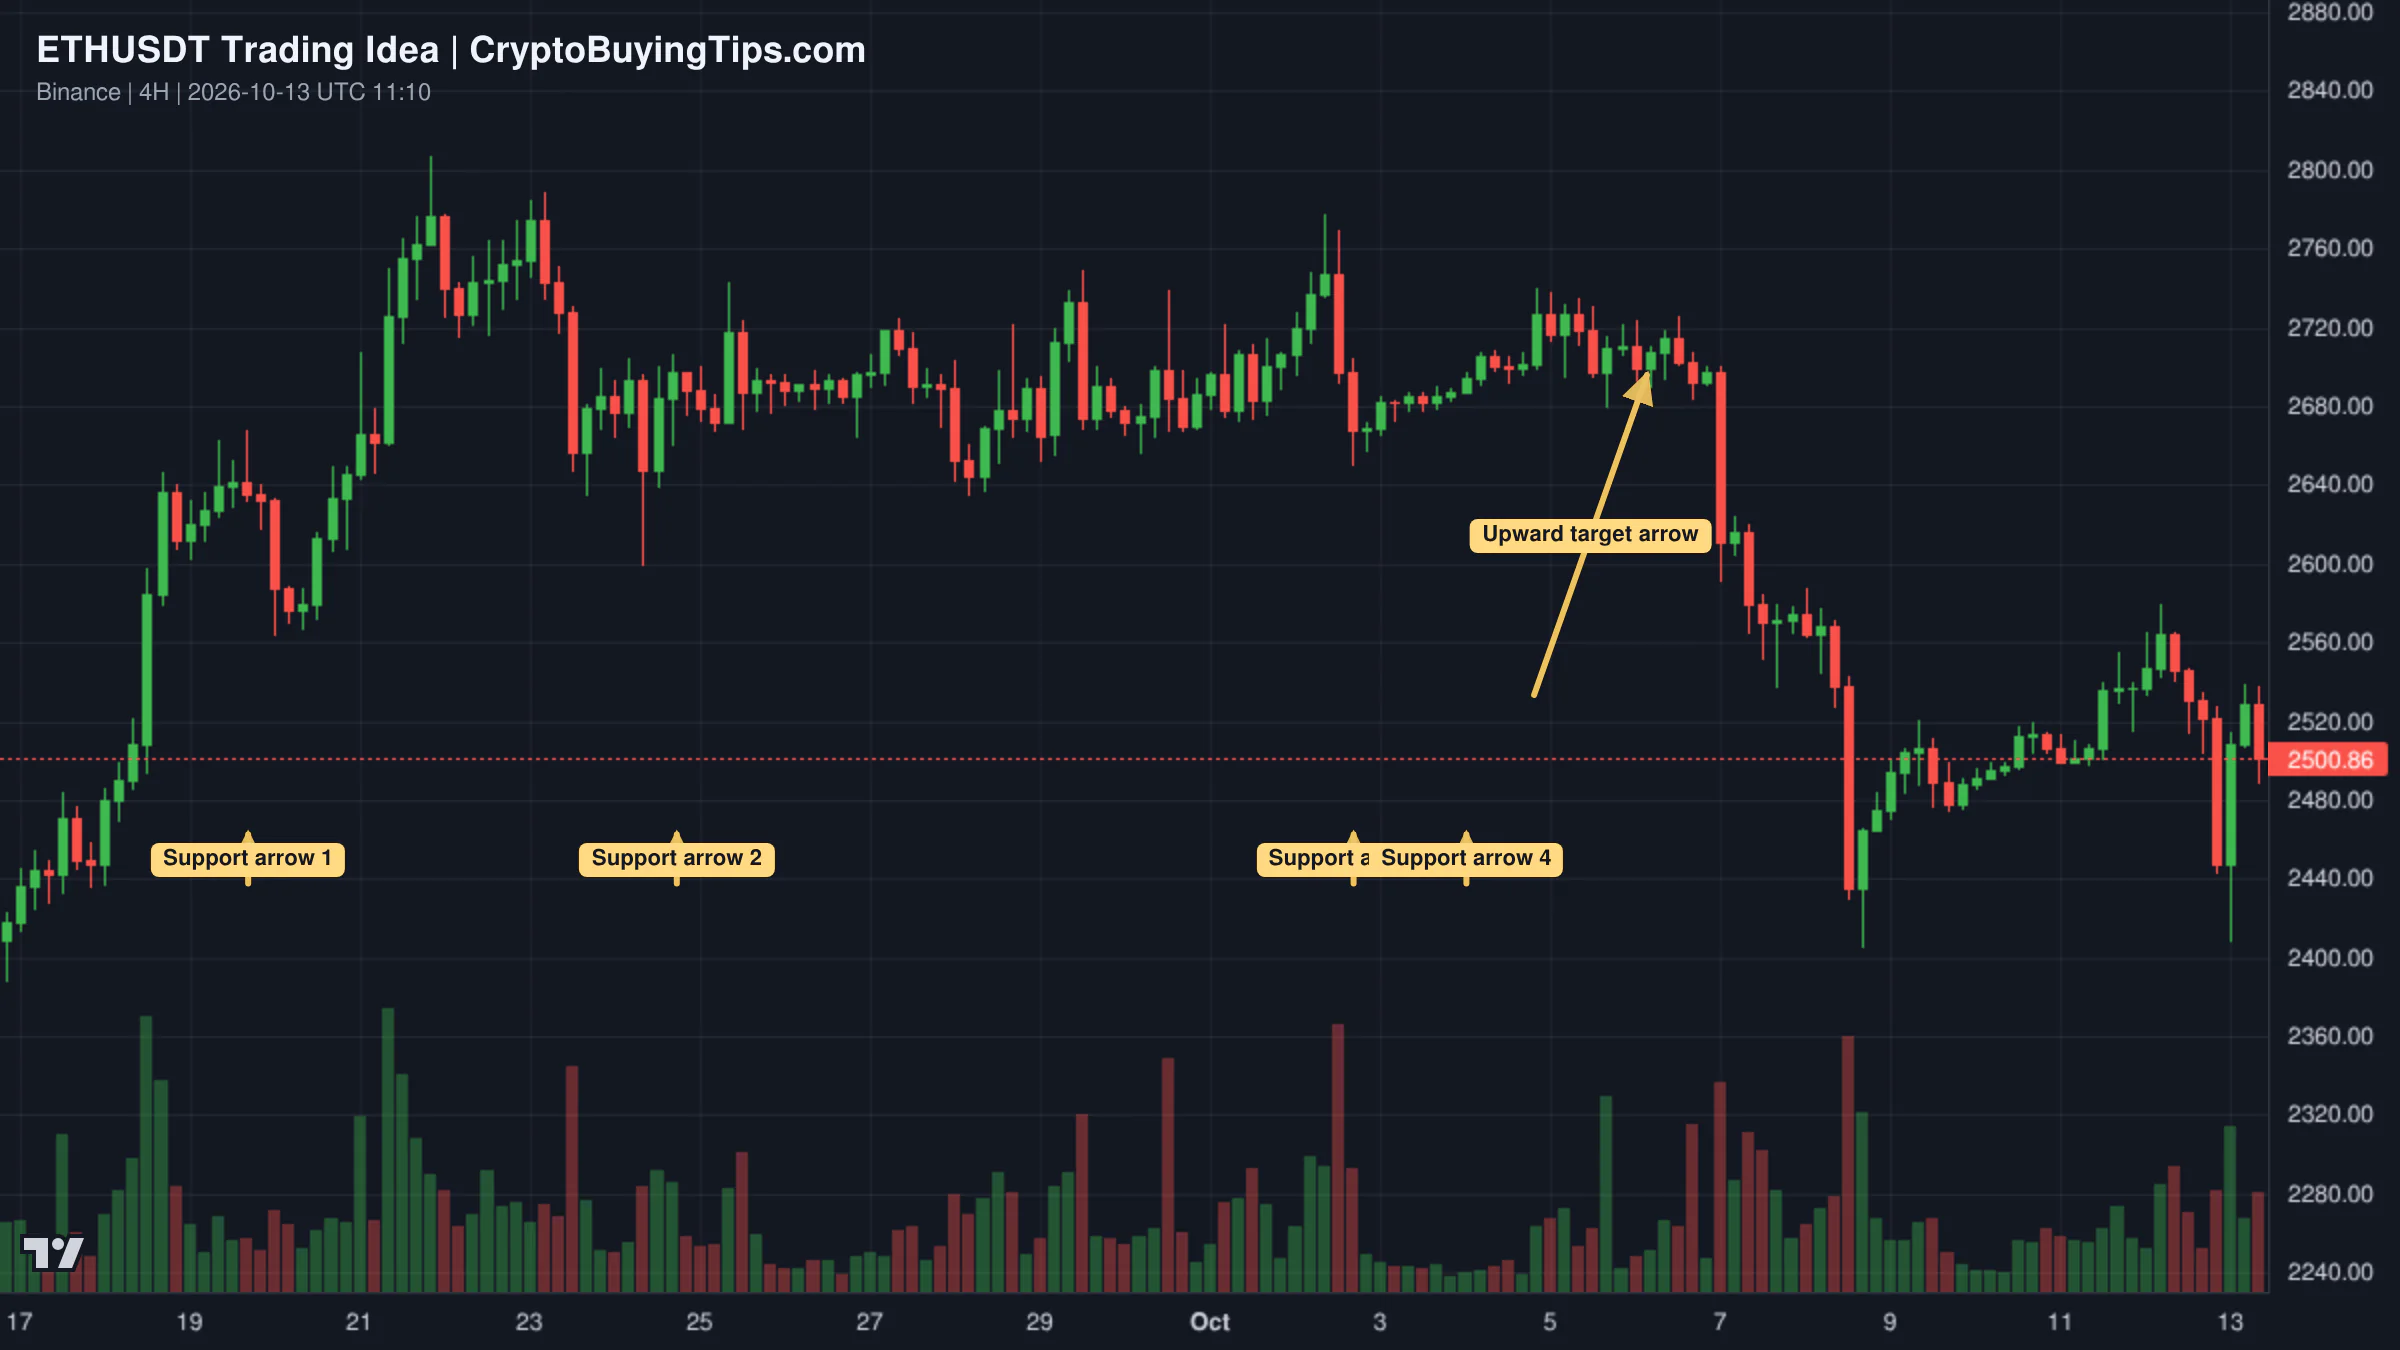
Ethereum is currently consolidating just below a resistance zone between $1,820 and $1,830. Analysis suggests that a confirmed breakout above this range could trigger a bullish leg toward $1,950, with a secondary target at $2,150. The setup relies on buyers maintaining control during this accumulation phase. If the price fails to hold current support, the bullish thesis is invalidated.

Redrawn ETHUSDT 240 trading idea chart for Ethereum: Breakout Could Open the Door to $2,150

Bitcoin is forming an ascending triangle on the 1-hour chart, with a key squeeze happening near $66,500. The macro setup is influenced by the recent reversal in ETF flows and a crash in the realized profit-to-loss ratio to a 43-month low. This level of capitulation historically signals an exhaustion of sellers. A break above the triangle could lead to a supply shock, especially as the market looks toward the July 28-29 Fed interest rate decision.

Redrawn BTCUSDT 60 trading idea chart for BTC/USDT: The $66,500 Ascending Triangle Squeeze

Altcoin Spotlight

Solana deserves attention due to its deepening ties with Japanese finance. The partnership between SBI Holdings and the Solana Foundation to create a Japan-based on-chain financial market is a significant development. Unlike many "partnerships" that result in a vague press release, this involves the rebranding of SBI R3 to SBI Solana Global. This provides SOL with a legitimate institutional use case in a G7 economy, which may help it decouple from the general altcoin slump.

What to watch next

The primary catalyst for the coming weeks is the Federal Reserve's interest rate decision on July 28 and 29. The market is currently in a consolidation phase, cleansing speculative leverage while waiting for a macro direction.

We will be watching the ETH/BTC ratio closely. As noted by analysts, this ratio is often a signal for a broader crypto revival. If Ethereum can break its current consolidation and regain ground against Bitcoin, it would suggest that the "fear" currently dominating the market is misplaced.

Finally, the regulatory fallout from China and Thailand regarding stablecoins and mixers will be important. If these measures lead to a significant drop in USDT liquidity or a migration to more regulated alternatives, it could cause short-term volatility in stablecoin pegs and DeFi liquidity pools.

Crypto Market Overview | bearish sentiment meets institutional accumulation amid geopolitical tension | July 12, 2026
Sigrid Voss·

Crypto Market Overview | bearish sentiment meets institutional accumulation amid geopolitical tension | July 12, 2026

Market overview

The crypto market is currently in a state of coordinated hesitation. Total market capitalization sits at $2.19T, down 0.35% over the last 24 hours. On the surface, the data looks grim. The Fear and Greed Index has plummeted to 31, placing the market firmly in fear territory. However, the underlying mechanics suggest a more complex story than a simple slide.

There is a glaring divergence in volume. Spot trading volume is $51.35B, but derivatives volume is a massive $389.42B. This means the vast majority of activity is speculative. Interestingly, derivatives volume is contracting sharply, falling 10.32%. When leverage exits the room while prices stay relatively stable, it often suggests a washout of over-leveraged longs rather than a capitulation of holders.

Bitcoin dominance remains high at 58.42%. This confirms that the broader market is still leaning on the primary asset for stability. Altcoins are not finding a safe haven here. The Altcoin Season Index is at 52, which is neutral, but the price action in the mid-caps tells a different story of struggle. Stablecoin dominance is also declining by 7.31%, which usually means capital is not moving into the sidelines but is instead being absorbed or shifted.

The macro backdrop is tense. US strikes on Iran have introduced a geopolitical risk premium that typically forces a flight to safety. In a strange twist, the S&P 500 and NASDAQ are both slightly positive. This suggests that traditional equity markets are ignoring the noise, while crypto traders are using it as an excuse to remain cautious.

Bitcoin and Ethereum

Bitcoin is trading at $63,807.2, a slight dip of 0.50%. The asset is caught between two opposing forces. On one side, institutional appetite is returning. Bitcoin and ether ETFs snapped an eight-week outflow streak with a combined $282 million inflow. This is a small recovery compared to the $9.46 billion lost over the previous two months, but the trend reversal is the point.

On the other side, the network is facing internal friction. The BIP-110 proposal to cap arbitrary data is causing a rift. High-profile figures like Michael Saylor and Adam Back are opposing the move, arguing that it turns a spam dispute into a consensus fight. This creates a layer of technical uncertainty that makes the $64,000 level a difficult ceiling to break.

Ethereum is holding steady at $1,798.26, managing a marginal gain of 0.06%. The network is essentially a ghost town right now. Gas fees are extremely low at 0.08 Gwei. While low fees are great for users, they signal a lack of on-chain activity.

The narrative for ETH is currently tied to tokenization. The launch of the Robinhood Chain, an L2 built on Arbitrum technology for tokenized stocks and ETFs, is a positive development for institutional adoption. However, this corporate polish is not yet reflecting in the price. We previously covered how Ethereum market share vanishes even as the institutional PR improves. Furthermore, a recently discovered bug that could take validators offline adds a layer of systemic risk that keeps the bulls cautious.

Top crypto prices

Bitcoin (BTC) is at $63,807.2, down 0.50%.

Ethereum (ETH) is at $1,798.26, up 0.06%.

BNB (BNB) is at $573.57, down 0.76%.

XRP (XRP) is at $1.09, down 1.26%.

Solana (SOL) is at $76.69, down 1.64%.

TRON (TRX) is at $0.3301, up 0.30%.

Hyperliquid (HYPE) is at $66.71, down 0.17%.

News driving today's market

The most immediate pressure comes from geopolitical instability. The US has hit Iran for the third time this week, and the closure of the Strait of Hormuz is a classic macro risk event. This usually triggers a de-risking phase where traders dump high-beta assets.

In the regulatory sphere, the UK is finally acting like a global crypto hub. The FCA and Bank of England have introduced rules for capital requirements and lowered stablecoin reserve requirements from 40% to 30%. This is a genuine step toward institutional maturity for the region.

The tokenization trend continues to be the primary catalyst for ETH. Robinhood Chain is now live, aiming to bring tokenized real-world assets to an L2. While this is bullish for utility, we have warned before that the tokenizing stocks trap often involves centralized receipts rather than true decentralization. We also noted in our Hyperliquid volume tracker that capital is often chasing momentum in these L2 launches rather than long-term utility.

For XRP, sentiment is being buoyed by a revelation from CEO Brad Garlinghouse. He admitted that Ripple nearly shut down and handed the asset to shareholders before deciding to fight the SEC. This kind of "survival" narrative often attracts retail buyers who view the asset as battle-tested.

Conversely, the crypto IPO market is stalling. Capital is rotating back into AI, and macro uncertainty is weighing on new listings. This suggests a cooling liquidity environment for the broader altcoin market.

Social intelligence

The social data shows a sharp contrast between retail fear and whale behavior. While the Fear and Greed Index sits at 31, whale 0x2684 is aggressively accumulating. Since June 30, this wallet has withdrawn over 49,000 ETH and 250 WBTC from Binance. This is a clear signal that some large players view these prices as a buying opportunity.

On the macro side, SK Hynix has warned that the AI boom will lead to a severe memory chip shortage by 2027. This is a subtle but important risk. If the hardware that powers AI cannot keep up, the AI-driven growth that has been lifting tech assets could hit a physical wall.

The tech world is also distracted by a public spat between Elon Musk and Sam Altman. Musk has accused Altman of stealing technology from Apple and an open-source AI charity. While this is mostly noise, it keeps the spotlight on the volatility of the AI sector, which often correlates with the risk appetite in crypto.

Finally, the opposition to BIP-110 is gaining traction on Twitter. Adam Back and Michael Saylor are framing the proposal as a threat to Bitcoin's core principles of permissionlessness. This suggests that the community is not in agreement, which often precedes volatility or, in extreme cases, a fork.

Trading ideas worth watching

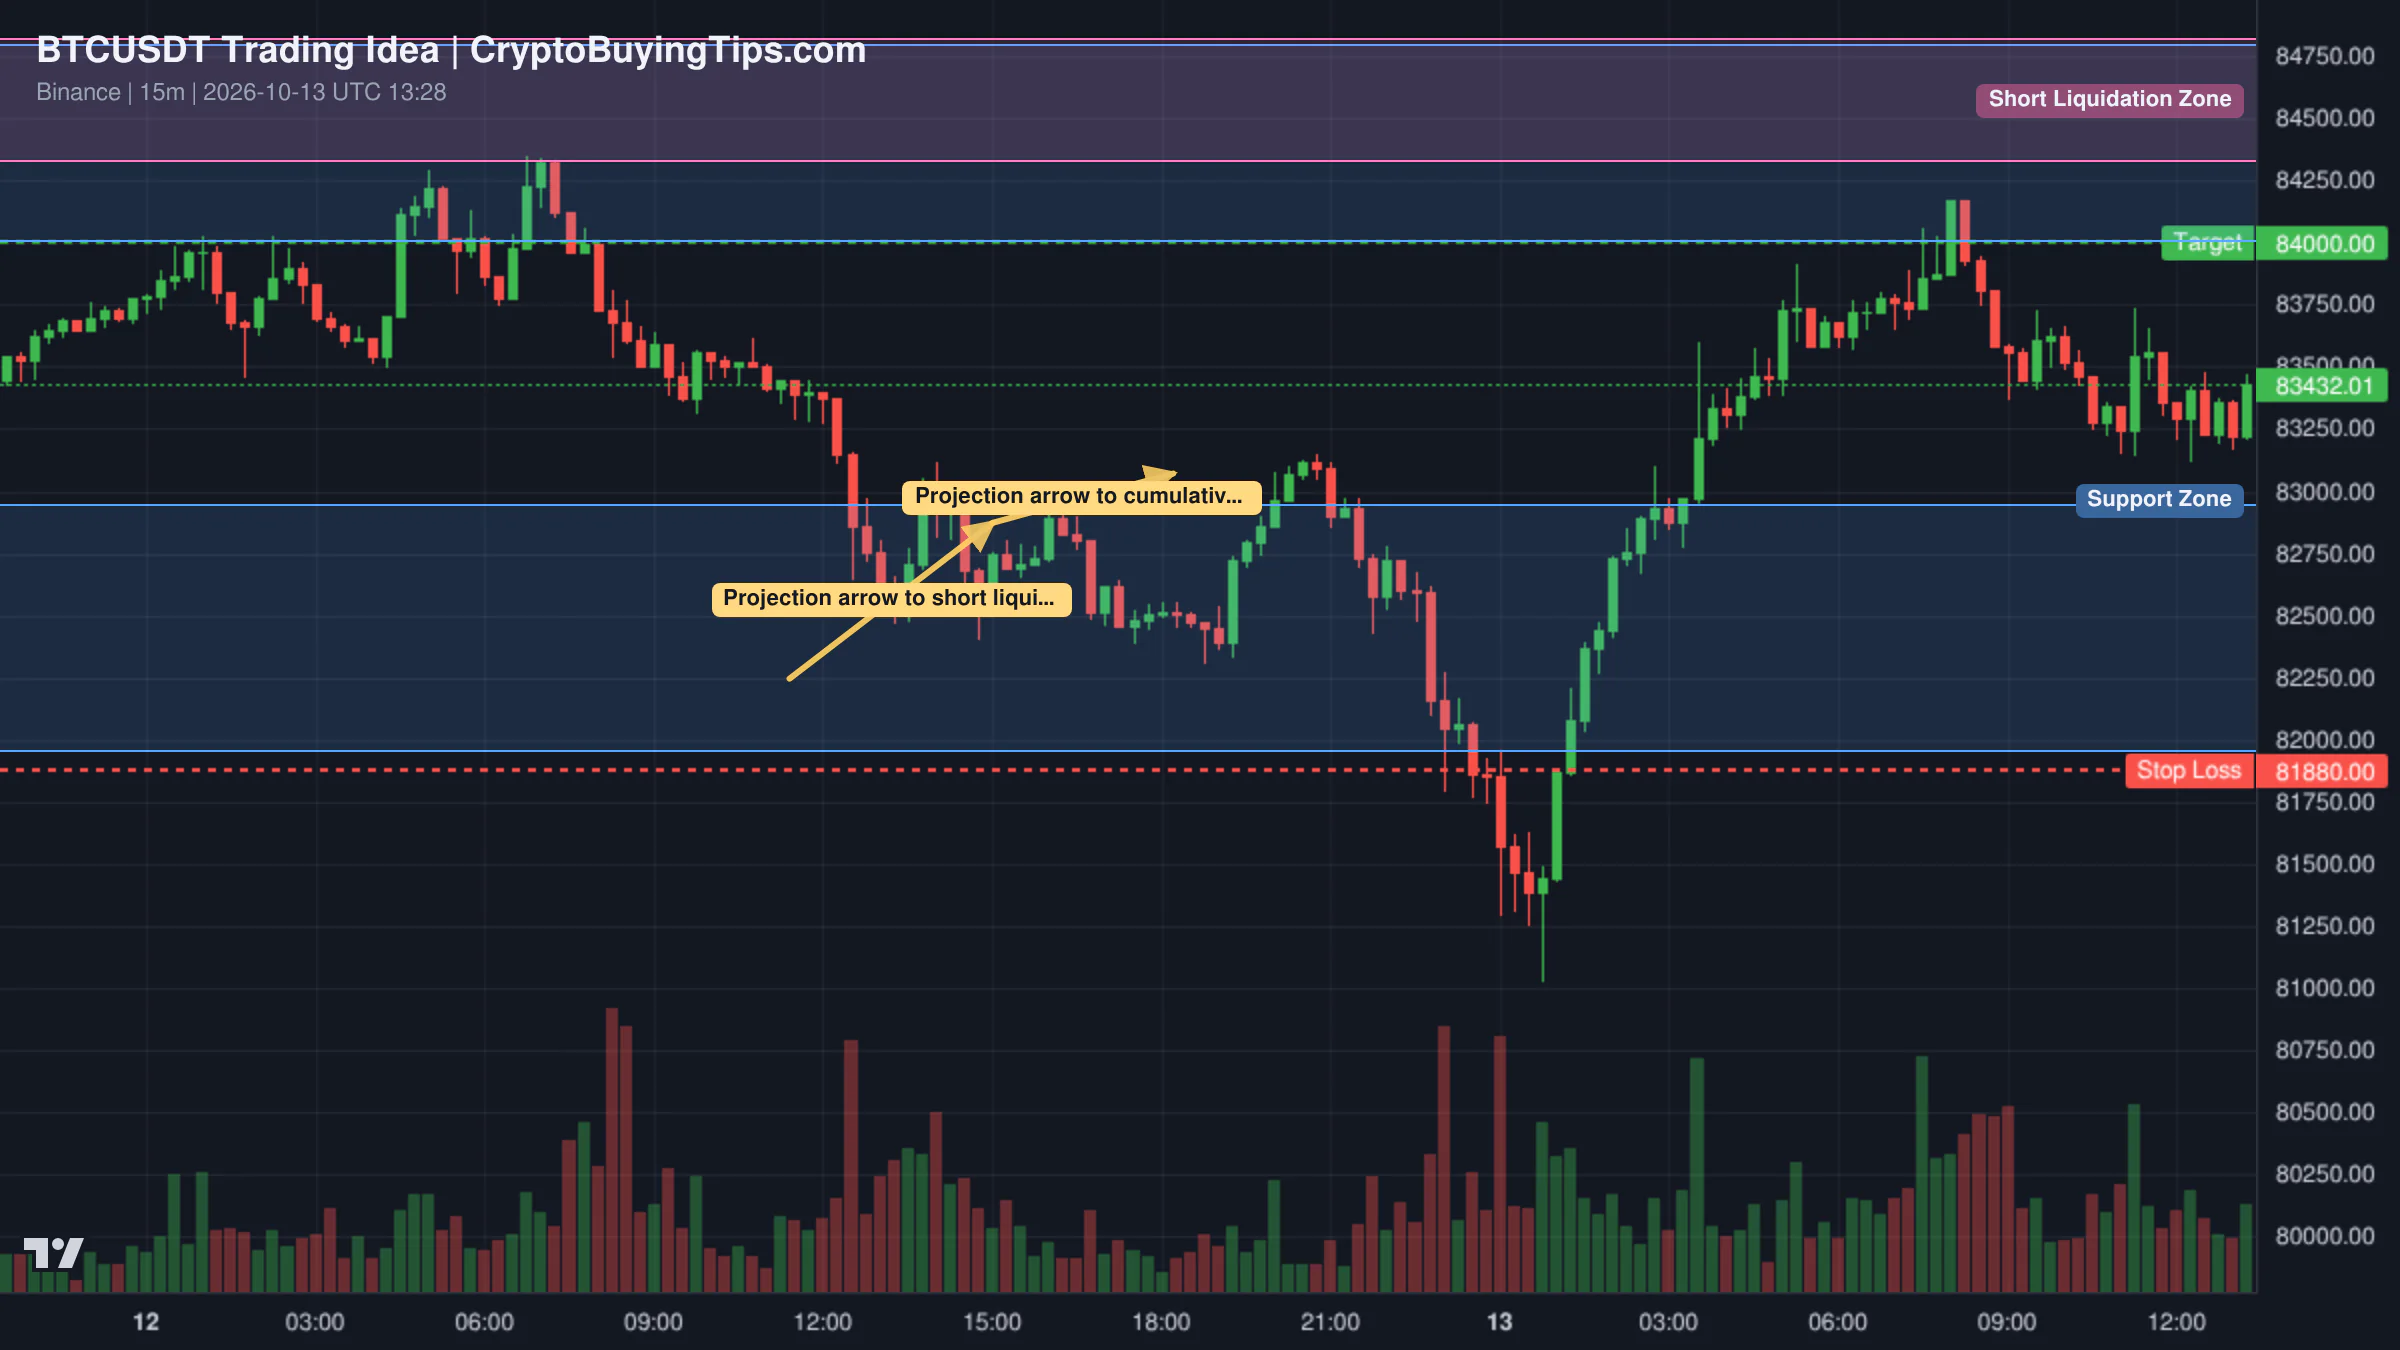
Bitcoin is currently testing a neutral range around $64,200. The loss of momentum near the $64,400 resistance indicates that buyers are stepping back. The key area to watch is the demand zone between $63,300 and $63,450. A healthy retracement into this support could provide the foundation for a new bullish leg. If buyers defend this zone, the next targets are $64,400 and $64,700. However, a failure to hold $63,300 would invalidate the constructive market structure.

Redrawn BTCUSDT 15 trading idea chart for BTCUSDT Analysis

TRON is showing signs of a bullish accumulation. The asset has printed a selling climax followed by a high-volume momentum candle. This is a textbook sign that smart money is positioning itself. TRX has swept the lower trigger line of the selling climax and is now respecting an ascending support trend-line. If the price maintains this momentum, it could move toward the major structural resistance at $0.3670.

Redrawn TRXUSDT 240 trading idea chart for TRX Is Quietly Preparing for an Explosive Move…!

What to watch next

The immediate focus remains on the BIP-110 fork deadline. With miner support currently at zero and heavyweights like Saylor opposing it, the risk of a messy consensus fight is real. Any sudden shift in miner alignment could lead to a sharp move in BTC price.

Geopolitically, the situation in the Strait of Hormuz is the primary wild card. If the conflict escalates, we expect a broad de-risking event across all high-beta assets. The market is already in a state of fear, so there is a risk of a "flush" if a major macro catalyst hits.

For Ethereum, the focus is on whether the tokenization narrative can actually drive on-chain activity. Low gas fees are a double-edged sword. We need to see if the Robinhood Chain launch translates into actual network usage or if it remains a corporate exercise in marketing. If the $1,700 level is retested and fails to hold, the bullish tokenization narrative will lose a lot of its credibility.

Crypto Market Overview | Speculative retreat amid regulatory wins | July 11, 2026
Sigrid Voss·

Crypto Market Overview | Speculative retreat amid regulatory wins | July 11, 2026

Market overview

The crypto market is in a strange state. Total market cap sits at $2.28T, while the Fear and Greed Index has plummeted to 31. This level of fear is almost impressive given the fundamental news of the day. The market is currently ignoring a massive regulatory victory in the United States. While traders panic, the US government has effectively banned its own digital competitor.

Liquidity is drying up. 24h volume is down to $52.2B. The most telling data point is the collapse in derivatives volume, which has dropped by roughly 27%. This suggests a sharp exit of speculative leverage. When derivatives volume falls while spot prices remain relatively stable, it often means the "gamblers" have left the room. This is a cleansing process. It removes the fragile long positions that usually lead to cascading liquidations.

Bitcoin dominance is high at 56.31%. Capital is not rotating into altcoins. Instead, it is consolidating in the primary asset. Stablecoin dominance is at 11.27%. This indicates that a significant amount of capital is sitting on the sidelines. Investors are waiting for a clear signal before they deploy. The Altcoin Season Index is neutral at 34.

The disconnect between sentiment and news is the main story. We have a legislative ban on a US CBDC and a major stablecoin issuer winning a federal banking charter. In any other cycle, these would be catalysts for a rally. Now, they are met with a collective shrug and a dip in volume.

Bitcoin and Ethereum

Bitcoin is trading at $64,125.8. It is the only asset currently acting as a safe haven. The high dominance of 58.50% shows that investors trust the orange coin more than anything else in the ecosystem. On-chain data from CryptoQuant suggests that spot selling pressure is easing. Buy pressure is returning near the short-term holder cost basis. This suggests the start of a new accumulation phase.

Ethereum is in a much more precarious position. The price is $1,796.78. The network is essentially a ghost town. Gas fees are at extreme lows, between 0.10 and 0.15 Gwei. This is a sign of very low network demand. If no one is using the network, the value proposition for the token weakens.

There is also a systemic risk emerging. Cambridge research indicates that 31% of Ethereum node activity is concentrated in the US. Much of this is clustered on AWS, Hetzner, and OVH. This concentration is a vulnerability. If a few US-based providers face technical or legal issues, the finalization of the network could stall. This is the opposite of the decentralization promise. It is a centralized risk hiding in a decentralized protocol.

Top crypto prices

Bitcoin (BTC) is $64,125.8, down 0.38% over 24 hours. Ethereum (ETH) is $1,796.78, nearly flat with a 0.01% change. BNB (BNB) is $578.1, up 0.37%. XRP (XRP) is $1.1, down 0.73%. Solana (SOL) is $77.97, down 1.88%. TRON (TRX) is $0.3292, down 0.18%. Hyperliquid (HYPE) is $66.81, down 3.07%.

News driving today's market

The biggest story is the 21st Century ROAD to Housing Act. This bill has become law without a signature from President Trump. It includes a provision that bans the Federal Reserve from issuing a central bank digital currency (CBDC) until December 31, 2030. This is a massive win for the industry. A CBDC would have been a direct state competitor to private stablecoins and decentralized assets. By removing this threat, the US government has cleared the path for private digital rails. We previously covered how The US banning a digital dollar is an act of outsourcing infrastructure to the private sector.

Circle has also achieved a major milestone. The issuer of USDC has received final OCC approval for a national trust bank charter. This is a huge step for institutional adoption. It means a major crypto firm is now integrated into the federal banking framework. This reduces the regulatory risk for institutions that want to use USDC for settlement. It legitimizes the entire stablecoin ecosystem. We previously covered Ethereum market share vanishes for more background.

On the policy front, the Fed has named Marc Andreessen to co-lead an AI productivity and jobs task force. This is a signal that the Fed is looking toward tech-driven productivity to shape its future policy. It is a positive sign for the broader tech sector.

Social intelligence

The social mood is a mix of on-chain optimism and existential dread. CryptoQuant analysts are noting that Bitcoin selling pressure is easing. This is a bullish sign for the short term.

However, a former Meta engineer is warning about "ticking time bombs." The first is quantum computing. If quantum advances break current wallet security, the entire trust model of the blockchain fails. The second is miner incentives. As block rewards decline, the network must rely on a sustainable fee market. If that market does not materialize, network security could drop. These are long-term structural risks that the current market is too distracted to notice.

In the Solana ecosystem, there is a reminder of the risks of custody. A Solana OG had 181,000 SOL stolen. The thief quickly swapped the funds for ETH. This is a standard reminder that "not your keys, not your coins" still applies, even for the OGs.

Trading ideas worth watching

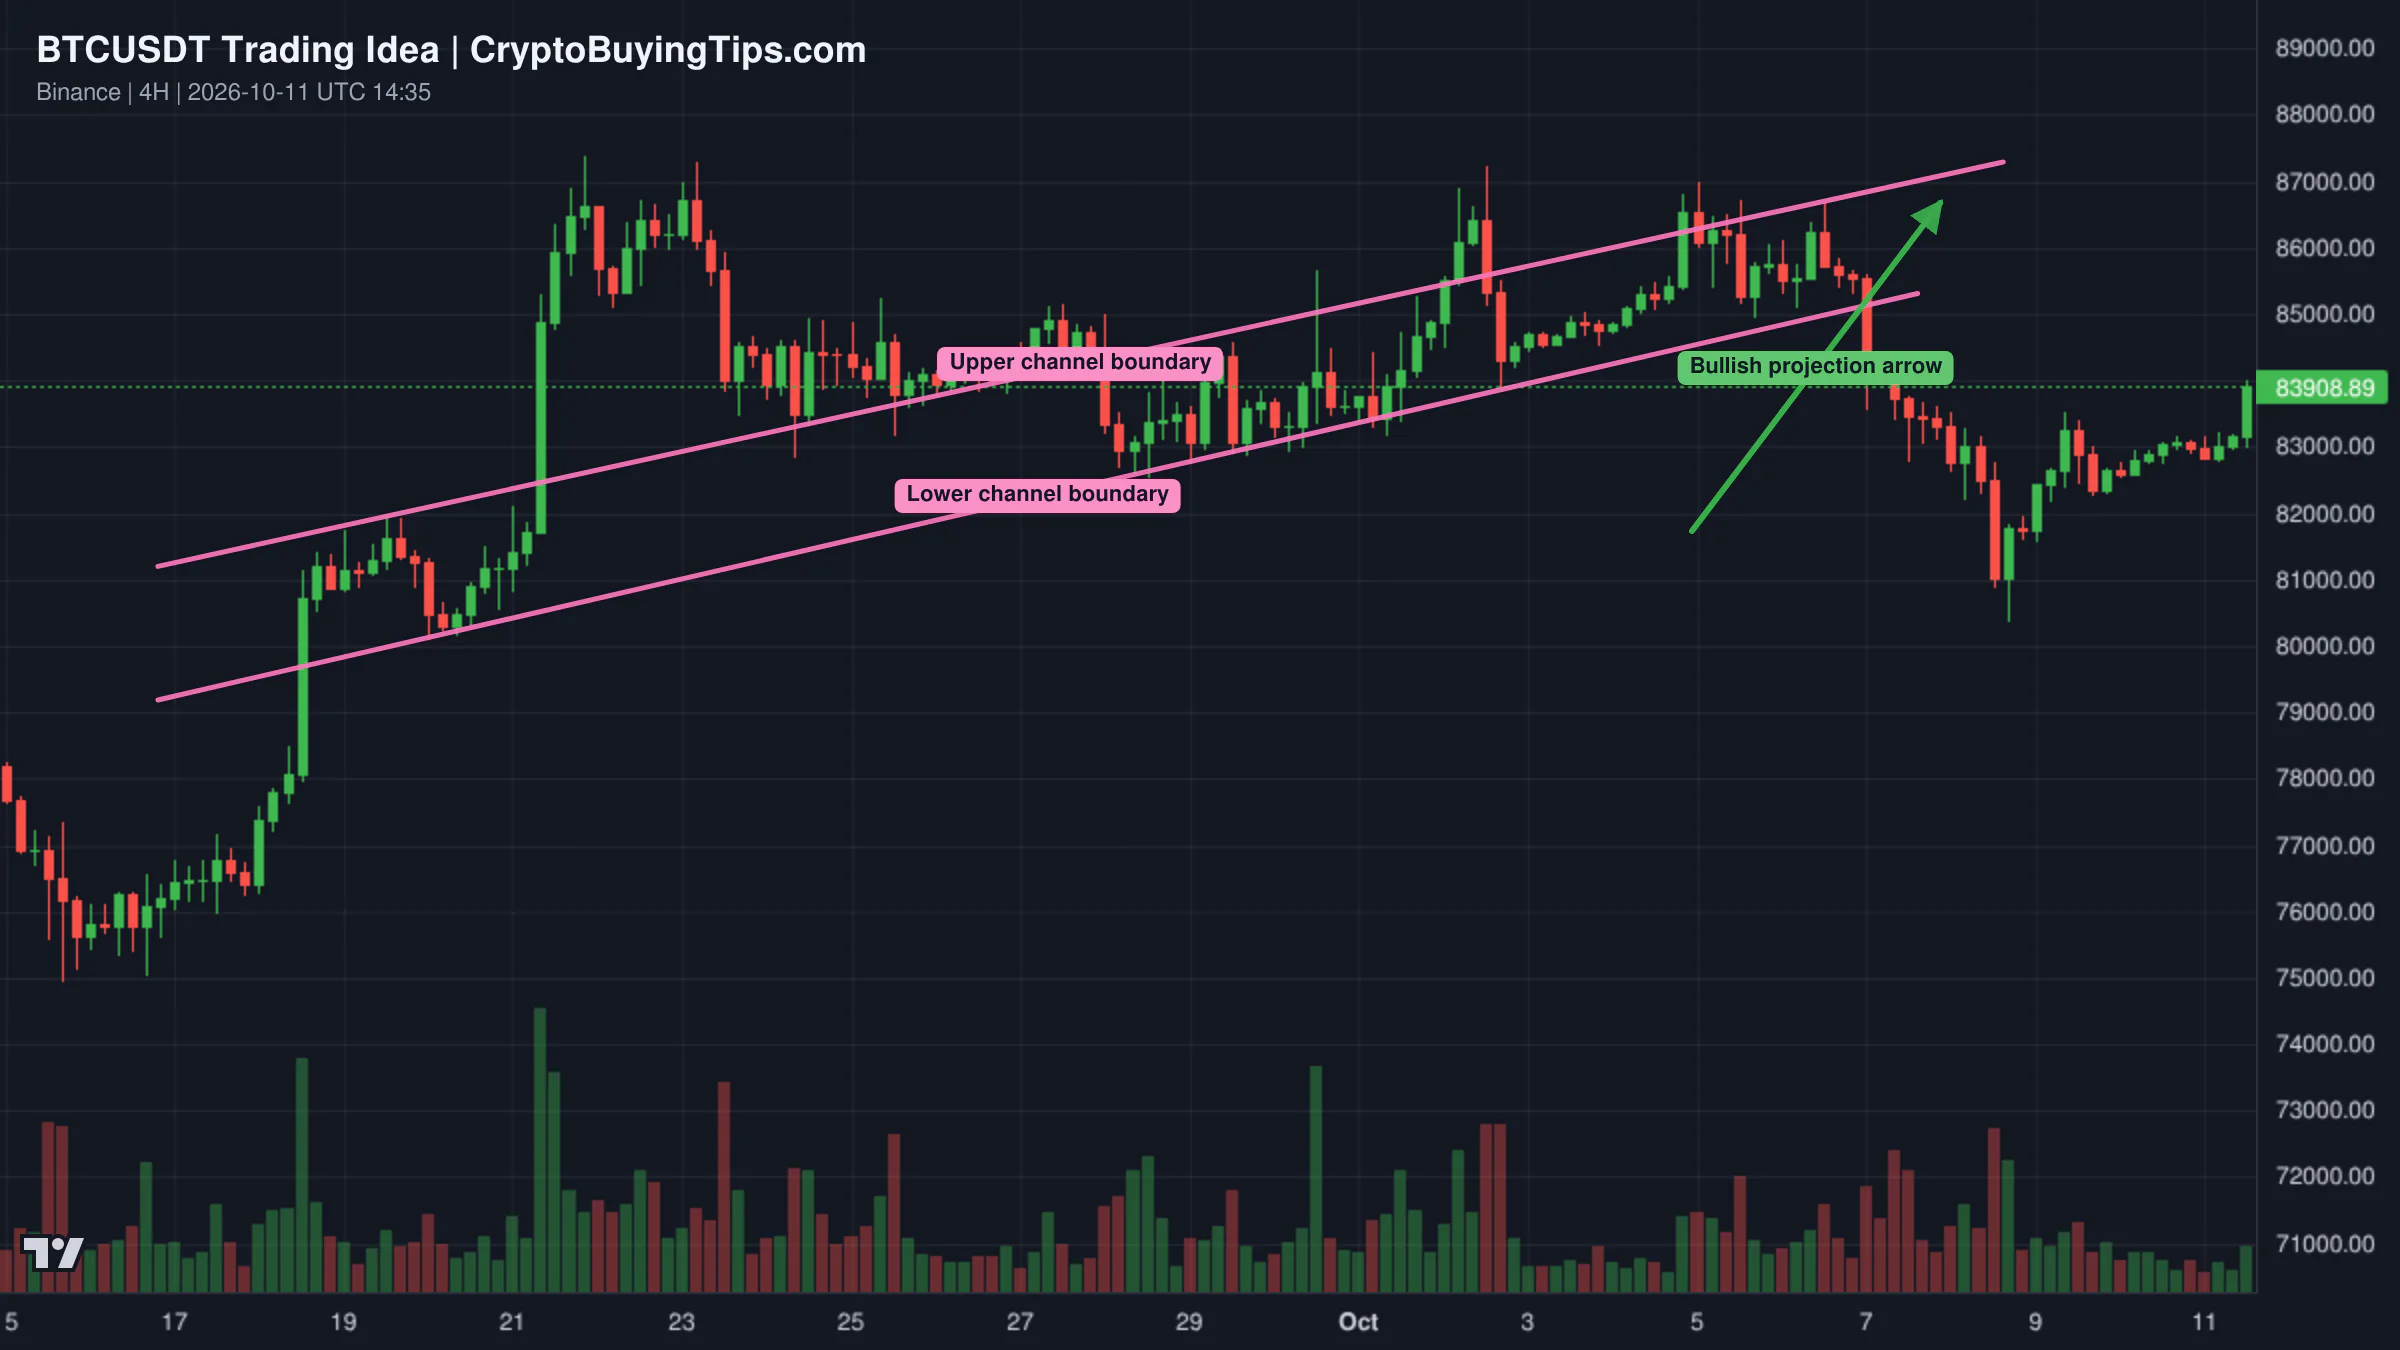
Bitcoin is currently fighting a battle at the $65,000 level. One analysis suggests a bearish outlook based on a negative divergence between price and volume. While the price has attempted to climb, the volume has declined. This is a warning sign. The asset is trading within a resistance zone between $64,750 and $63,700. If the DXY index continues to strengthen, BTC may struggle to sustain these levels and could face another corrective move.

Redrawn BTCUSDT 240 trading idea chart for $1.2B Is Betting on $80K, but BTC Must Break This FirstRedrawn BTCUSDT 240 trading idea chart for Bitcoin Faces Multiple Bearish Signals — Can Bulls Hold $65K?

Another perspective is more bullish. There is roughly $1.2B in call open interest concentrated at the $80,000 strike. This is a massive bet on a move higher. However, this is not a guarantee of spot demand. The immediate breakout level to watch is $64,691. A confirmed 4-hour close above this level would strengthen the thesis for a move toward $67,300. Until then, the asset is trapped in a converging wedge.

For those looking at small caps, ACX presents an interesting, if depressing, case. The asset is down 97% from its high. It is the financial equivalent of something found behind a radiator. But the RSI is showing a strong bullish divergence. Price has made lower lows for 18 months, but the RSI has made higher lows. This suggests that selling pressure is finally exhausting itself. Support is confirmed at $0.0328. It is a high-risk play, but the oscillators are in agreement for the first time in years.

What to watch next

The coming days will reveal if the CBDC ban actually triggers a rotation back into risk assets. The fundamental news is bullish, but the sentiment is fear. This gap is where the opportunity usually lives.

We need to see Bitcoin reclaim and hold $65,000 to confirm that the "fear" is just a temporary liquidity pause. For Ethereum, the focus must be on network activity. If gas fees stay at these historic lows, the narrative of a "corporate makeover" will continue to clash with the reality of a vanishing market share. Keep an eye on the $64,691 level for BTC as the primary pivot for the next move.