Market Overviews

Daily crypto market overviews, trend analysis, and key updates from our editorial team.

Crypto Market Overview | Volume surges as prices slip amid regulatory shifts | August 11, 2026
Sigrid Voss·

Crypto Market Overview | Volume surges as prices slip amid regulatory shifts | August 11, 2026

Market overview

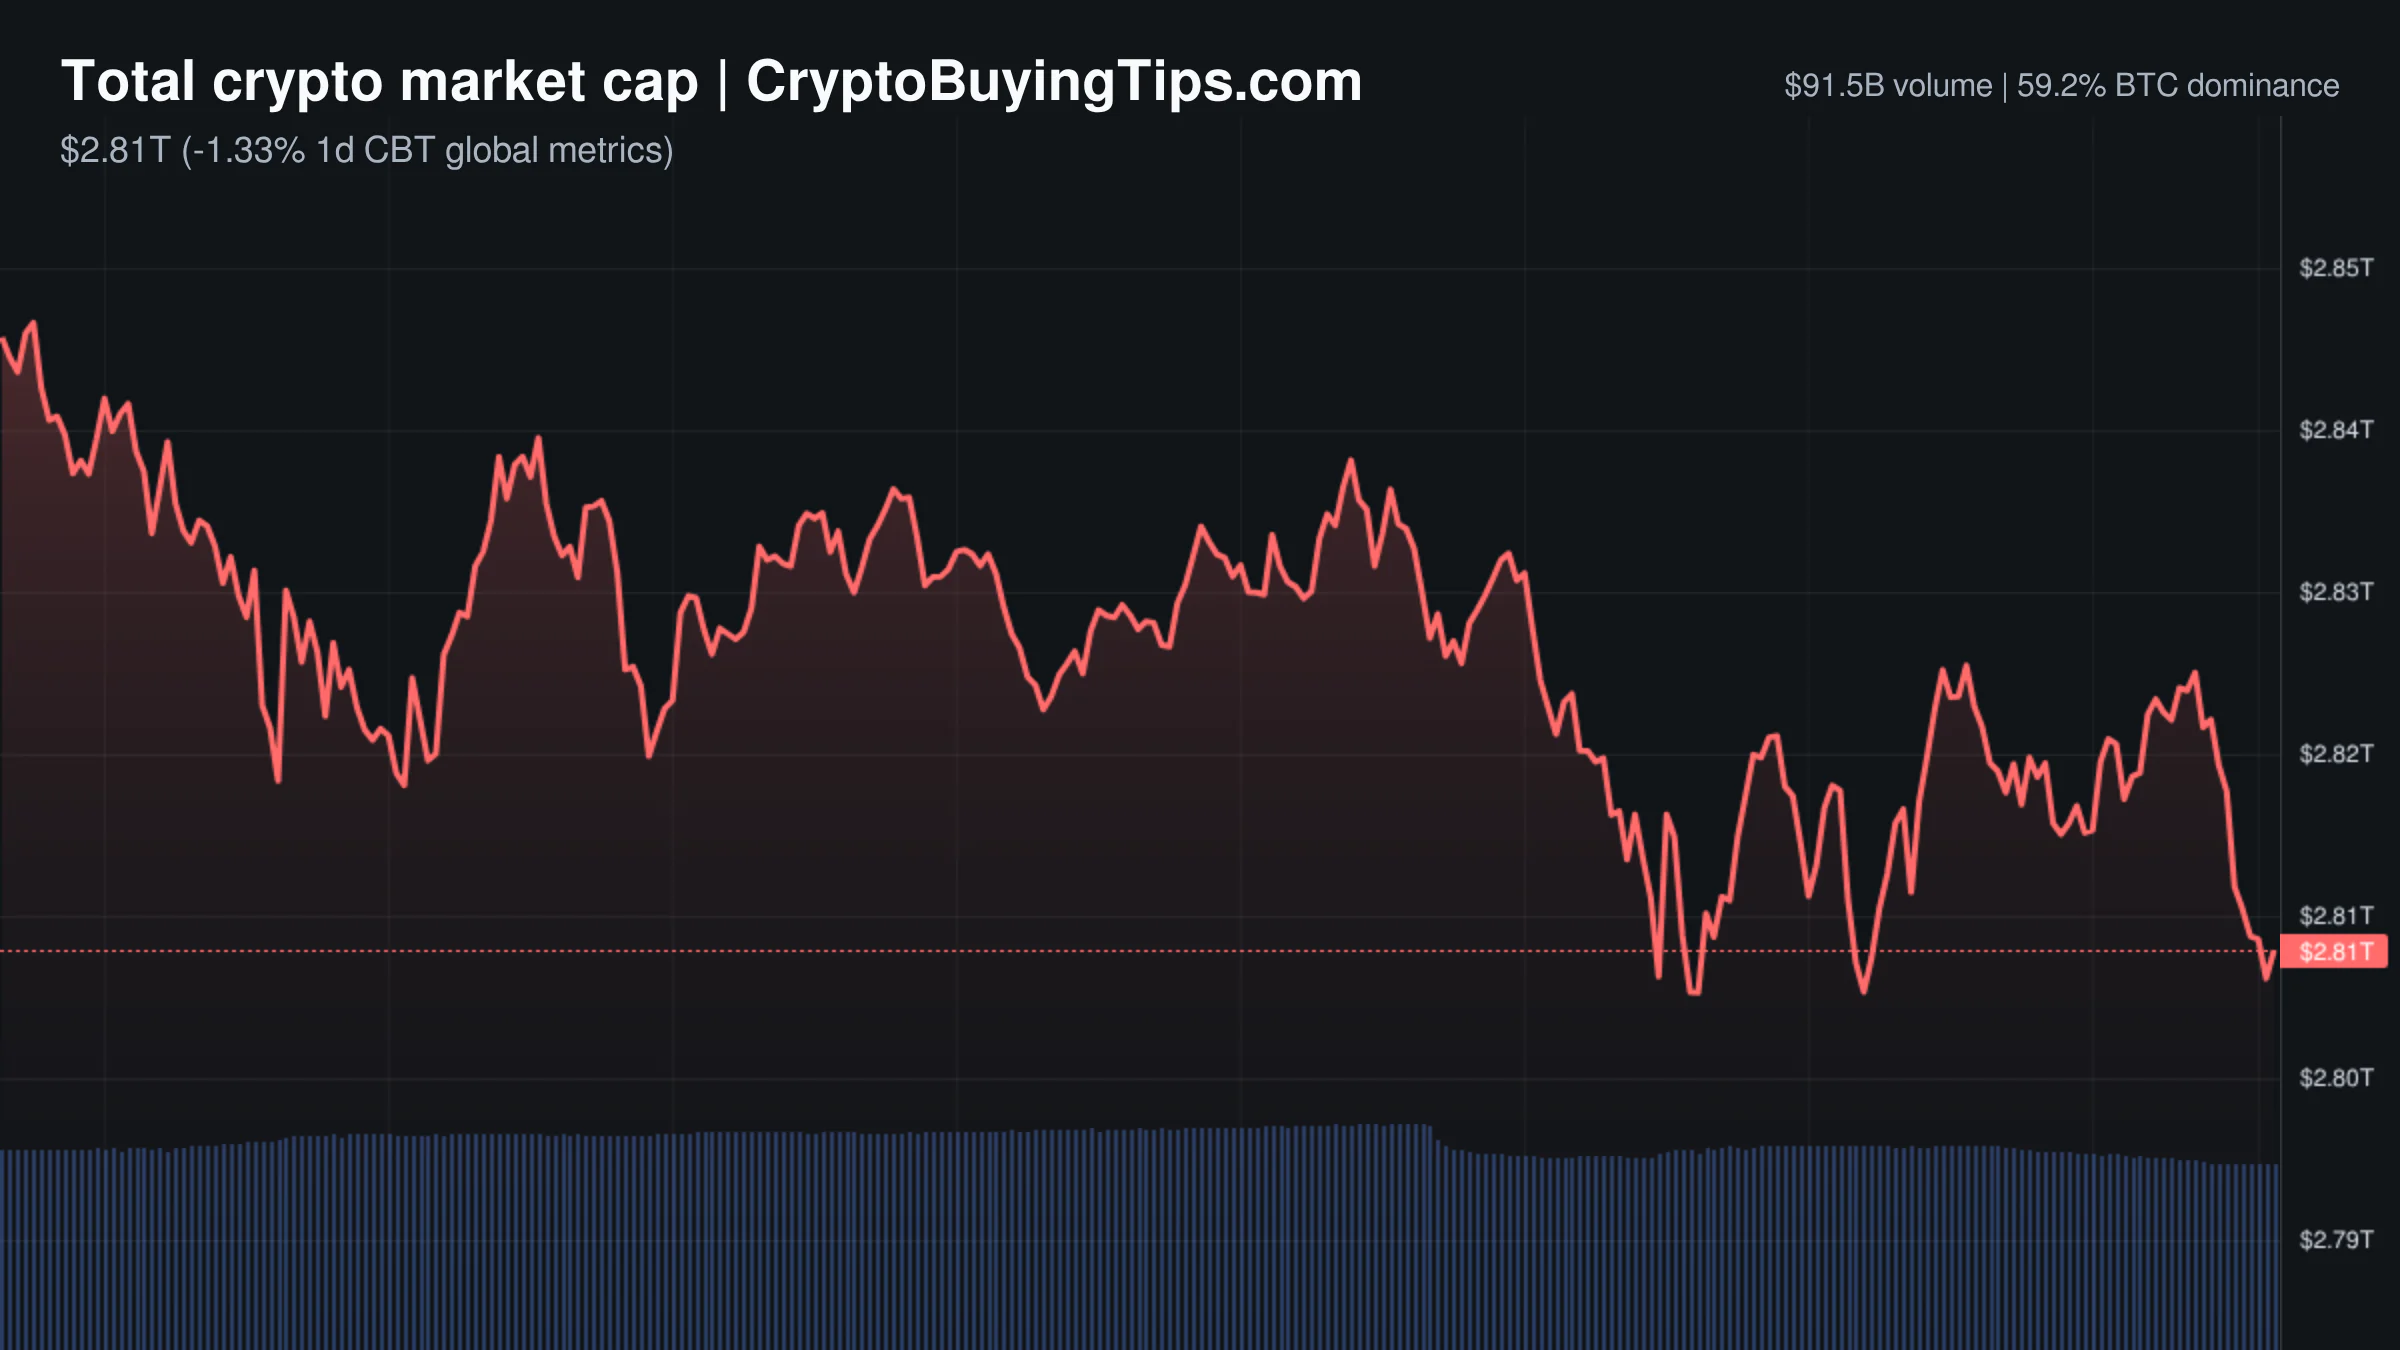
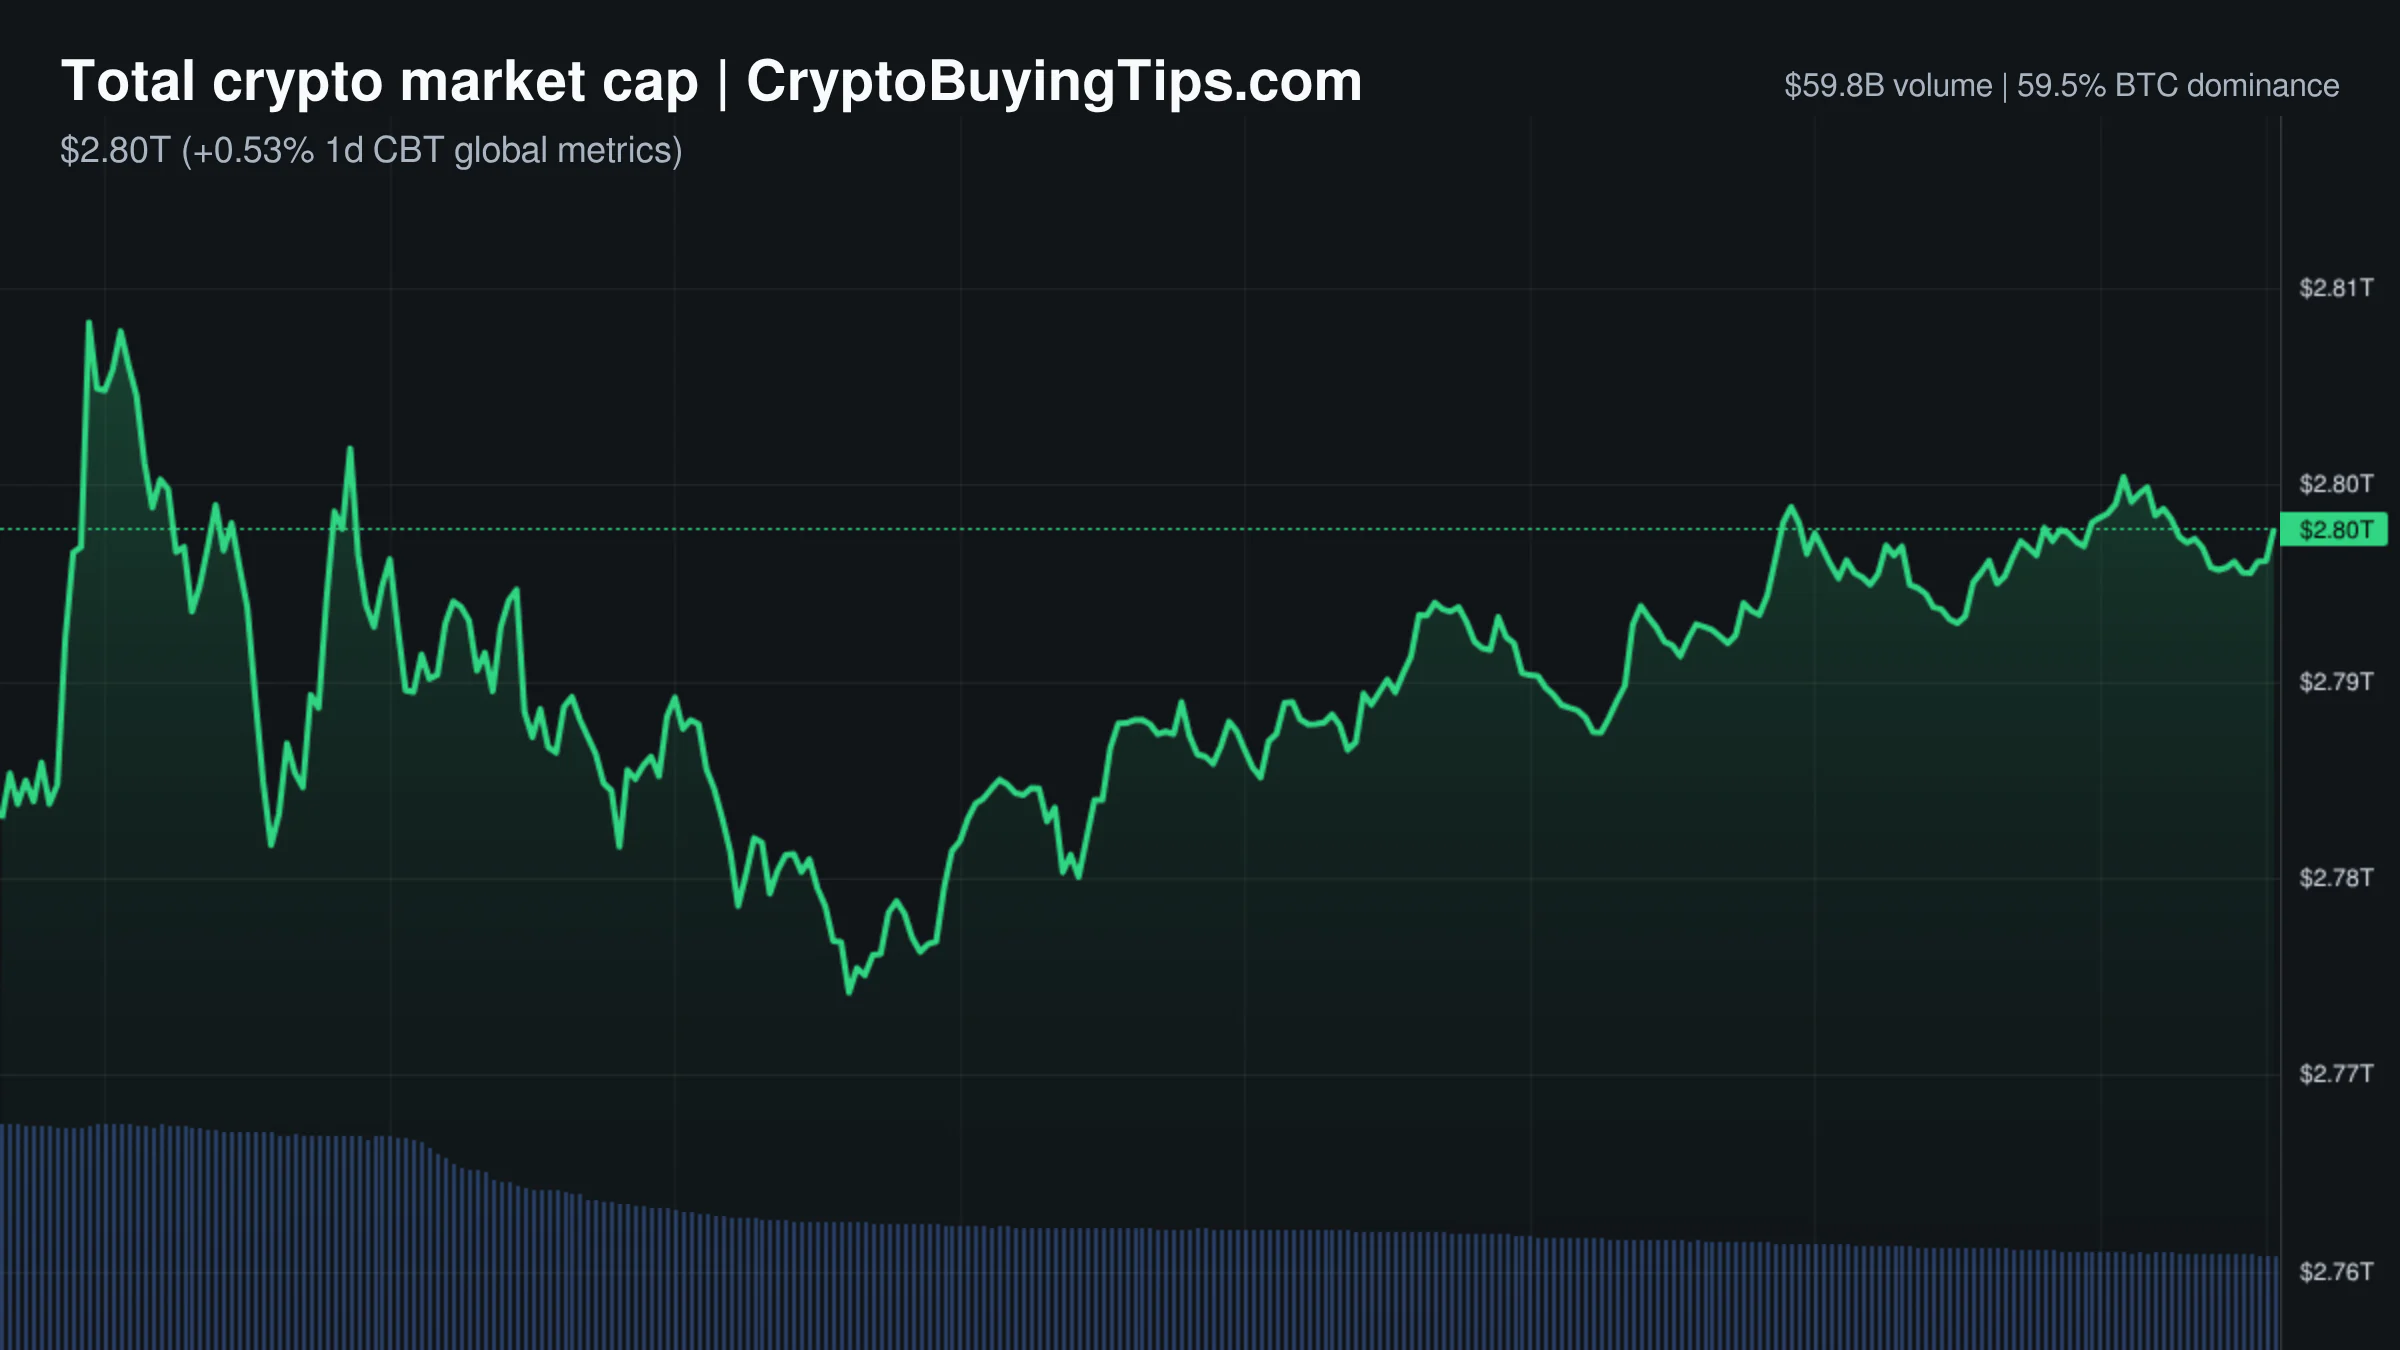
The market is currently exhibiting a strange sort of energy. Prices are drifting lower, with the total market cap sitting at $2.28T, down nearly 1% over the last 24 hours. However, the activity levels suggest a market that is anything but quiet. We are seeing a sharp divergence where price action is slightly bearish, but trading volume is aggressively bullish. Spot volume has jumped over 27%, stablecoin activity is up 30%, and derivatives volume has spiked by nearly 39% to a staggering $538.66B.

This is not the kind of volume that suggests organic accumulation. Instead, it looks like a high-leverage battleground. The heavy skew toward derivatives, which now dwarf spot trading by a massive margin, indicates that the current price action is being driven by leveraged positioning rather than long-term holding. This is a pattern we have seen before, where the crypto exchanges reverse bridge and the real money bets are placed in the perps market.

Sentiment remains firmly in "Fear" territory with a Fear & Greed Index score of 38. It is a classic market irony: traders are terrified, yet they are piling into high-leverage bets. Bitcoin dominance remains high at 58.78%, confirming that the appetite for risk in the altcoin market is still minimal. With the Altcoin Season Index at 39, we are firmly in a Bitcoin season. Capital is not rotating into alts; it is simply fighting over the direction of the market leader.

Bitcoin and Ethereum

Bitcoin is trading at $64,187.55, down 1.21% in the last day. The price action is currently a tug-of-war between institutional inflows and short-term leverage. On one hand, BlackRock has expanded its reach into Canada with a new ETF allocating 3% to Bitcoin, and recent ETF inflows have been the strongest since May. On the other hand, the derivatives market is seeing "gamblers" open massive positions. On-chain data shows a group of shorts holding nearly $250M with liquidation prices clustered around $64,600, while a smaller group of longs is betting on a bounce from $61,200.

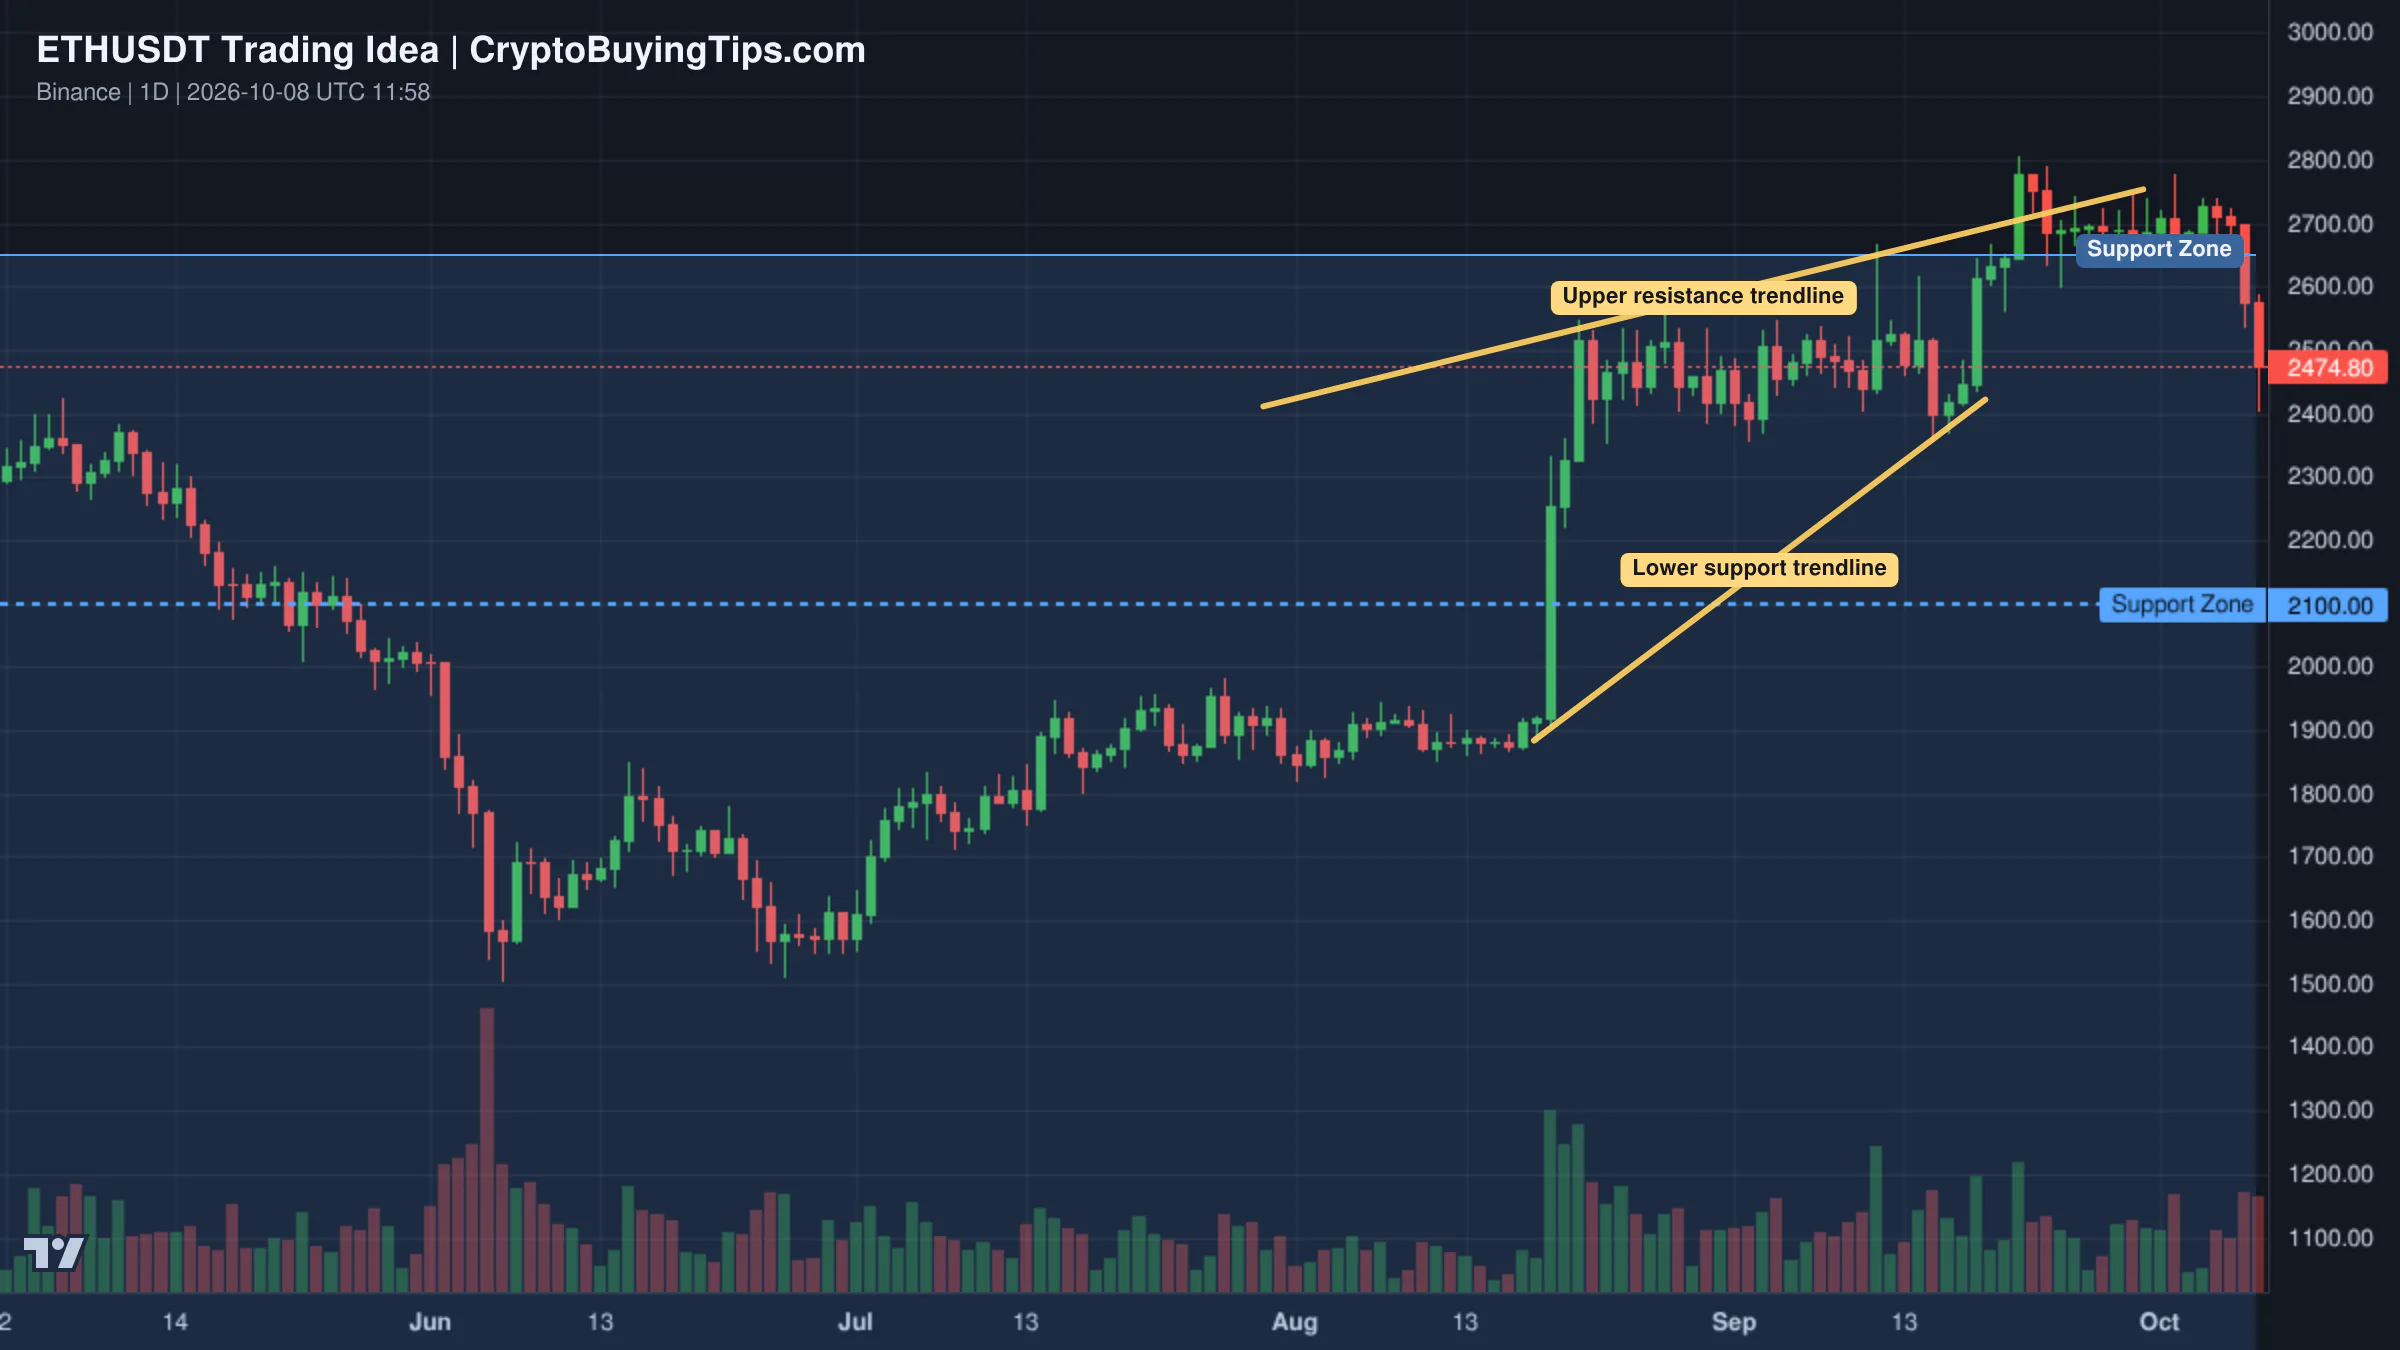
Ethereum is struggling more, trading at $1,885.35 and down 1.61%. The network is eerily quiet on the technical side, with gas fees hitting a negligible 0.07 Gwei. This lack of on-chain activity contrasts sharply with the options market, where Ethereum's implied volatility is 52.31, significantly higher than Bitcoin's 38.24. Traders expect ETH to move more violently than BTC, but they aren't necessarily using the network to do it. We have noted previously that Ethereum market share vanishes as capital consolidates into the primary asset.

Top crypto prices

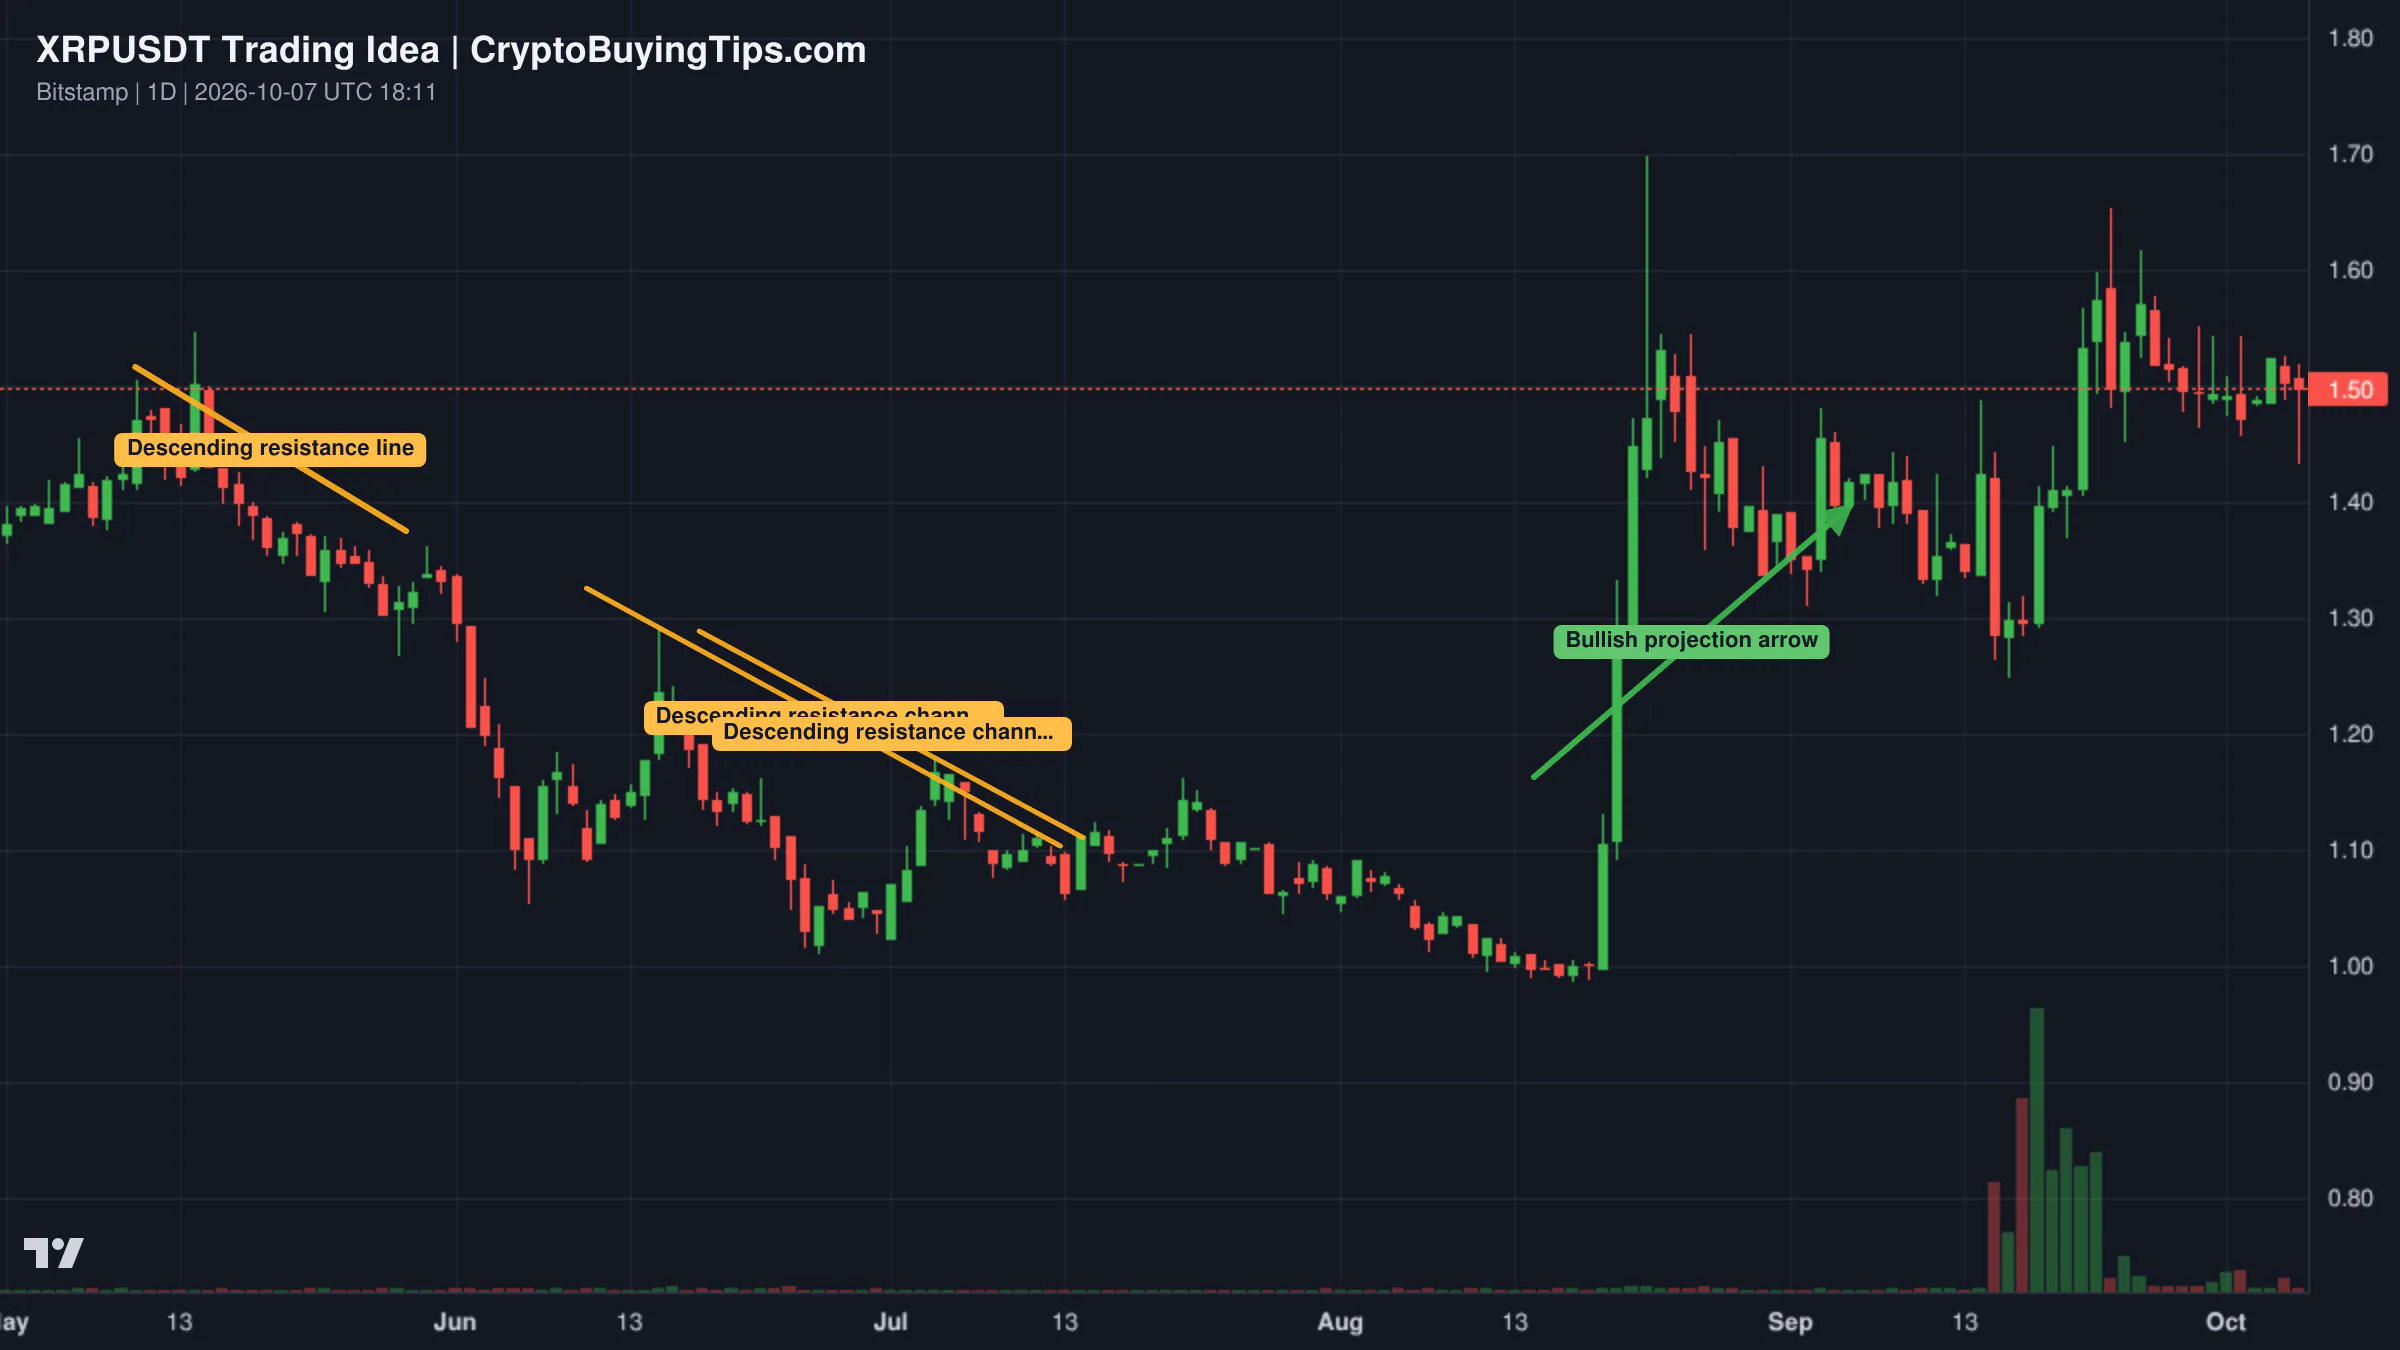
The top of the leaderboard shows a mix of sliding majors and a few resilient outliers. Bitcoin and Ethereum are both in the red, as is Solana at $75.79 (-1.21%) and XRP at $1 (-2.74%).

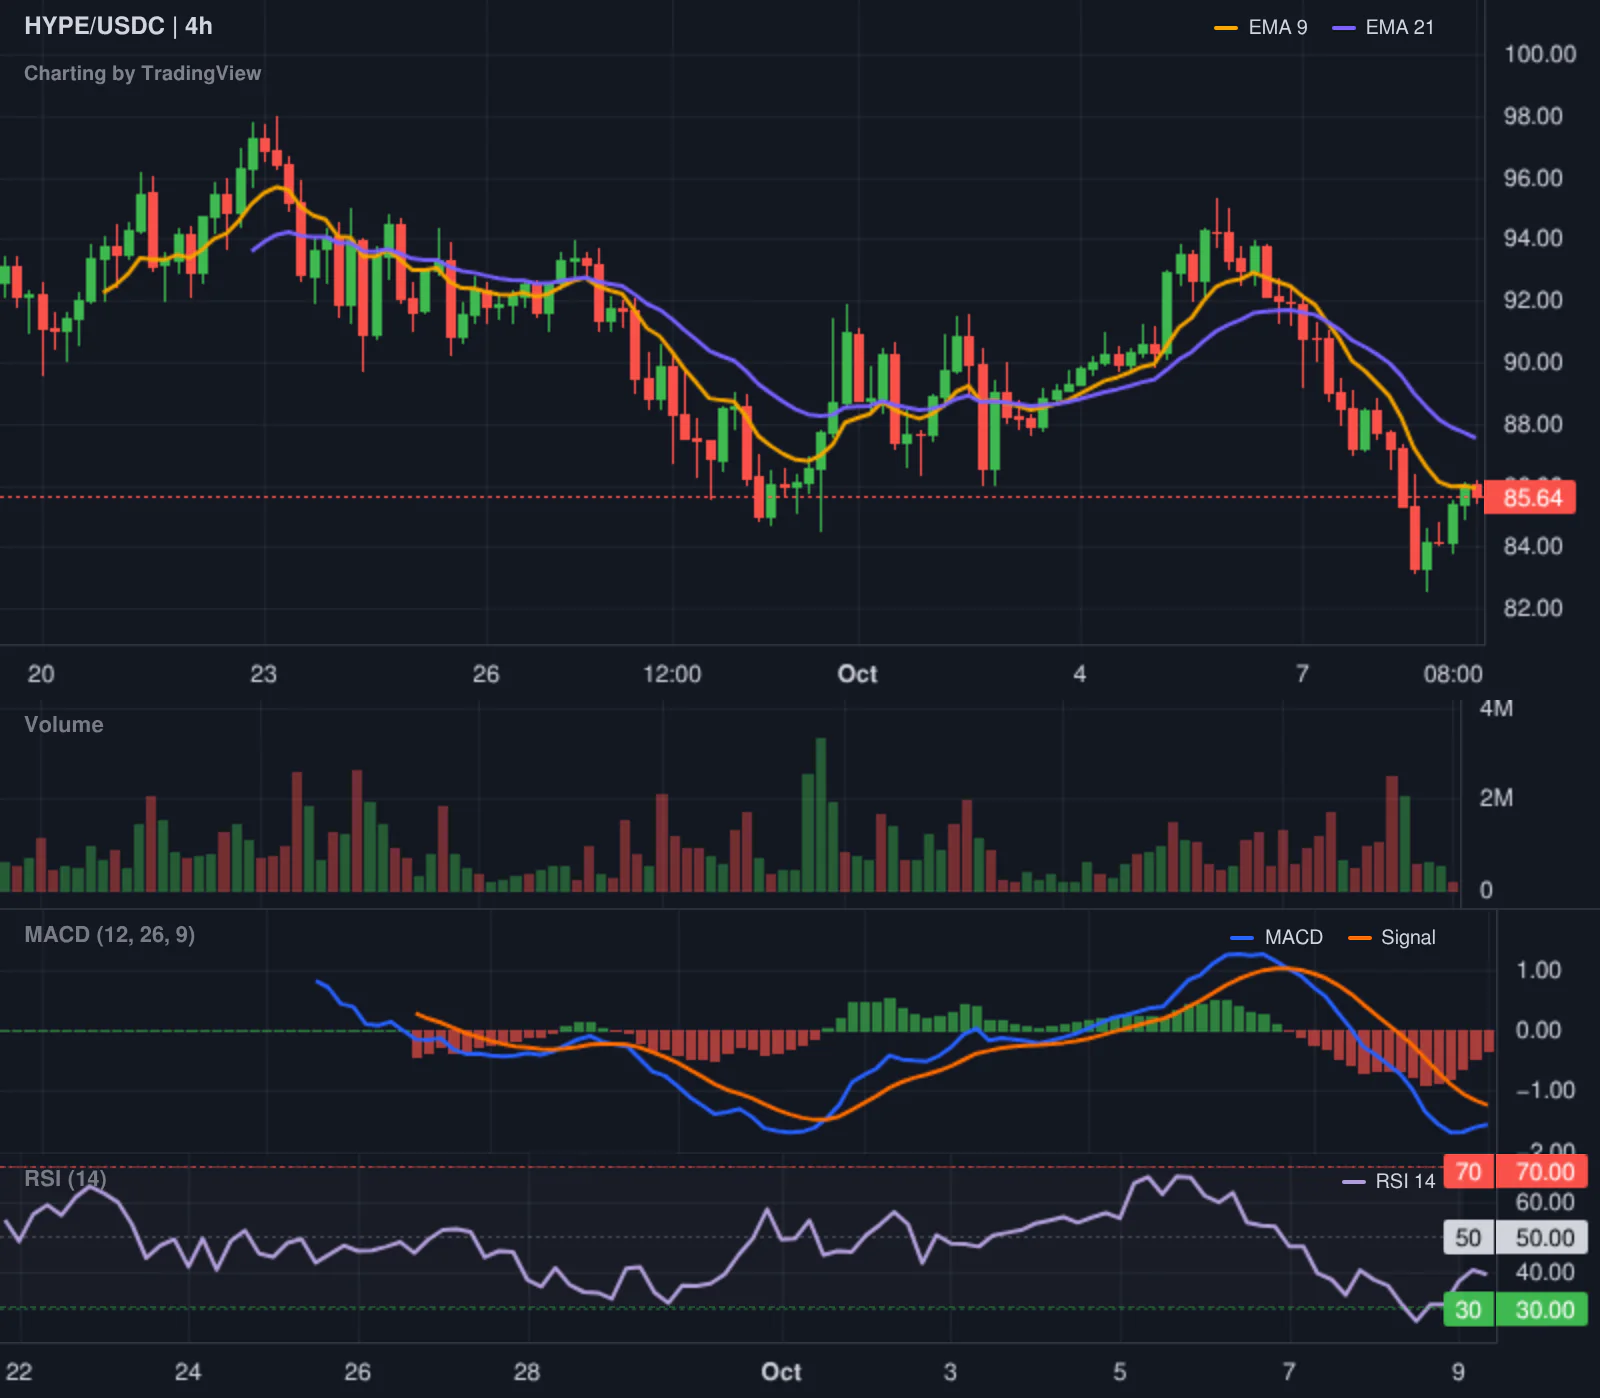
Interestingly, BNB has managed a slight gain of 0.34% to $607.57, and TRON is up 1.56% at $0.3364. Hyperliquid is also showing strength, climbing 1.15% to $55.09. The fact that these assets are green while the majors slide suggests some very specific, isolated buying interest rather than a broad market recovery.

News driving today's market

The regulatory front is providing a surprising amount of bullish noise. The U.S. SEC has scheduled a meeting for August 14 to propose "Regulation Crypto," which aims to create a formal path for the legal issuance of digital assets. While the Senate failed to pass the Clarity Act, a direct move from the SEC to create a tailored offering regime is a step toward the institutional clarity the market craves. We previously discussed how the BTC dominance data analysis often reflects capital consolidating during these regulatory pauses.

In the UK, lawmakers are putting pressure on bank CEOs over the refusal to provide accounts for crypto firms. This is a subtle but important driver. If the "banking barrier" is removed, the friction for institutional entry in one of the world's largest financial hubs drops significantly. Similarly, Brazil is forcing a licensing deadline for virtual asset firms by October 30, 2026. This is the maturation process in action; the market is moving from a "wild west" phase to one of audited, authorized operations.

On the asset-specific side, Standard Chartered has issued a bold target of $200 for Chainlink by 2030, citing the potential for tokenized real-world assets (RWA) to hit $4T. When a major TradFi bank names a specific price target based on infrastructure utility, it usually triggers a shift in how the "smart money" views the asset's long-term floor.

Social intelligence

The social feeds are highlighting the intersection of AI and crypto infrastructure. A massive $9.1 billion cloud deal between Anthropic and Bitcoin miner Riot Platforms suggests that the "AI x Mining" narrative is moving beyond mere speculation into actual corporate contracts. However, this is tempered by OpenAI's decision to pause the development of its Astra model due to safety concerns. When the leaders of the AI revolution start talking about their models being "too dangerous," it introduces a risk overhang that can dampen the overall risk-on sentiment for the tech-adjacent crypto sectors.

On-chain alerts from @lookonchain show that the leverage war in Bitcoin is intensifying. We are seeing "gamblers" taking massive, high-leverage positions on both sides. The shorts are currently more aggressive, with nearly $250M in positions that will be wiped out if Bitcoin pushes above $64,600. This creates a prime environment for a short squeeze, where a small move upward forces shorts to buy back their positions, accelerating the rally.

Trading ideas worth watching

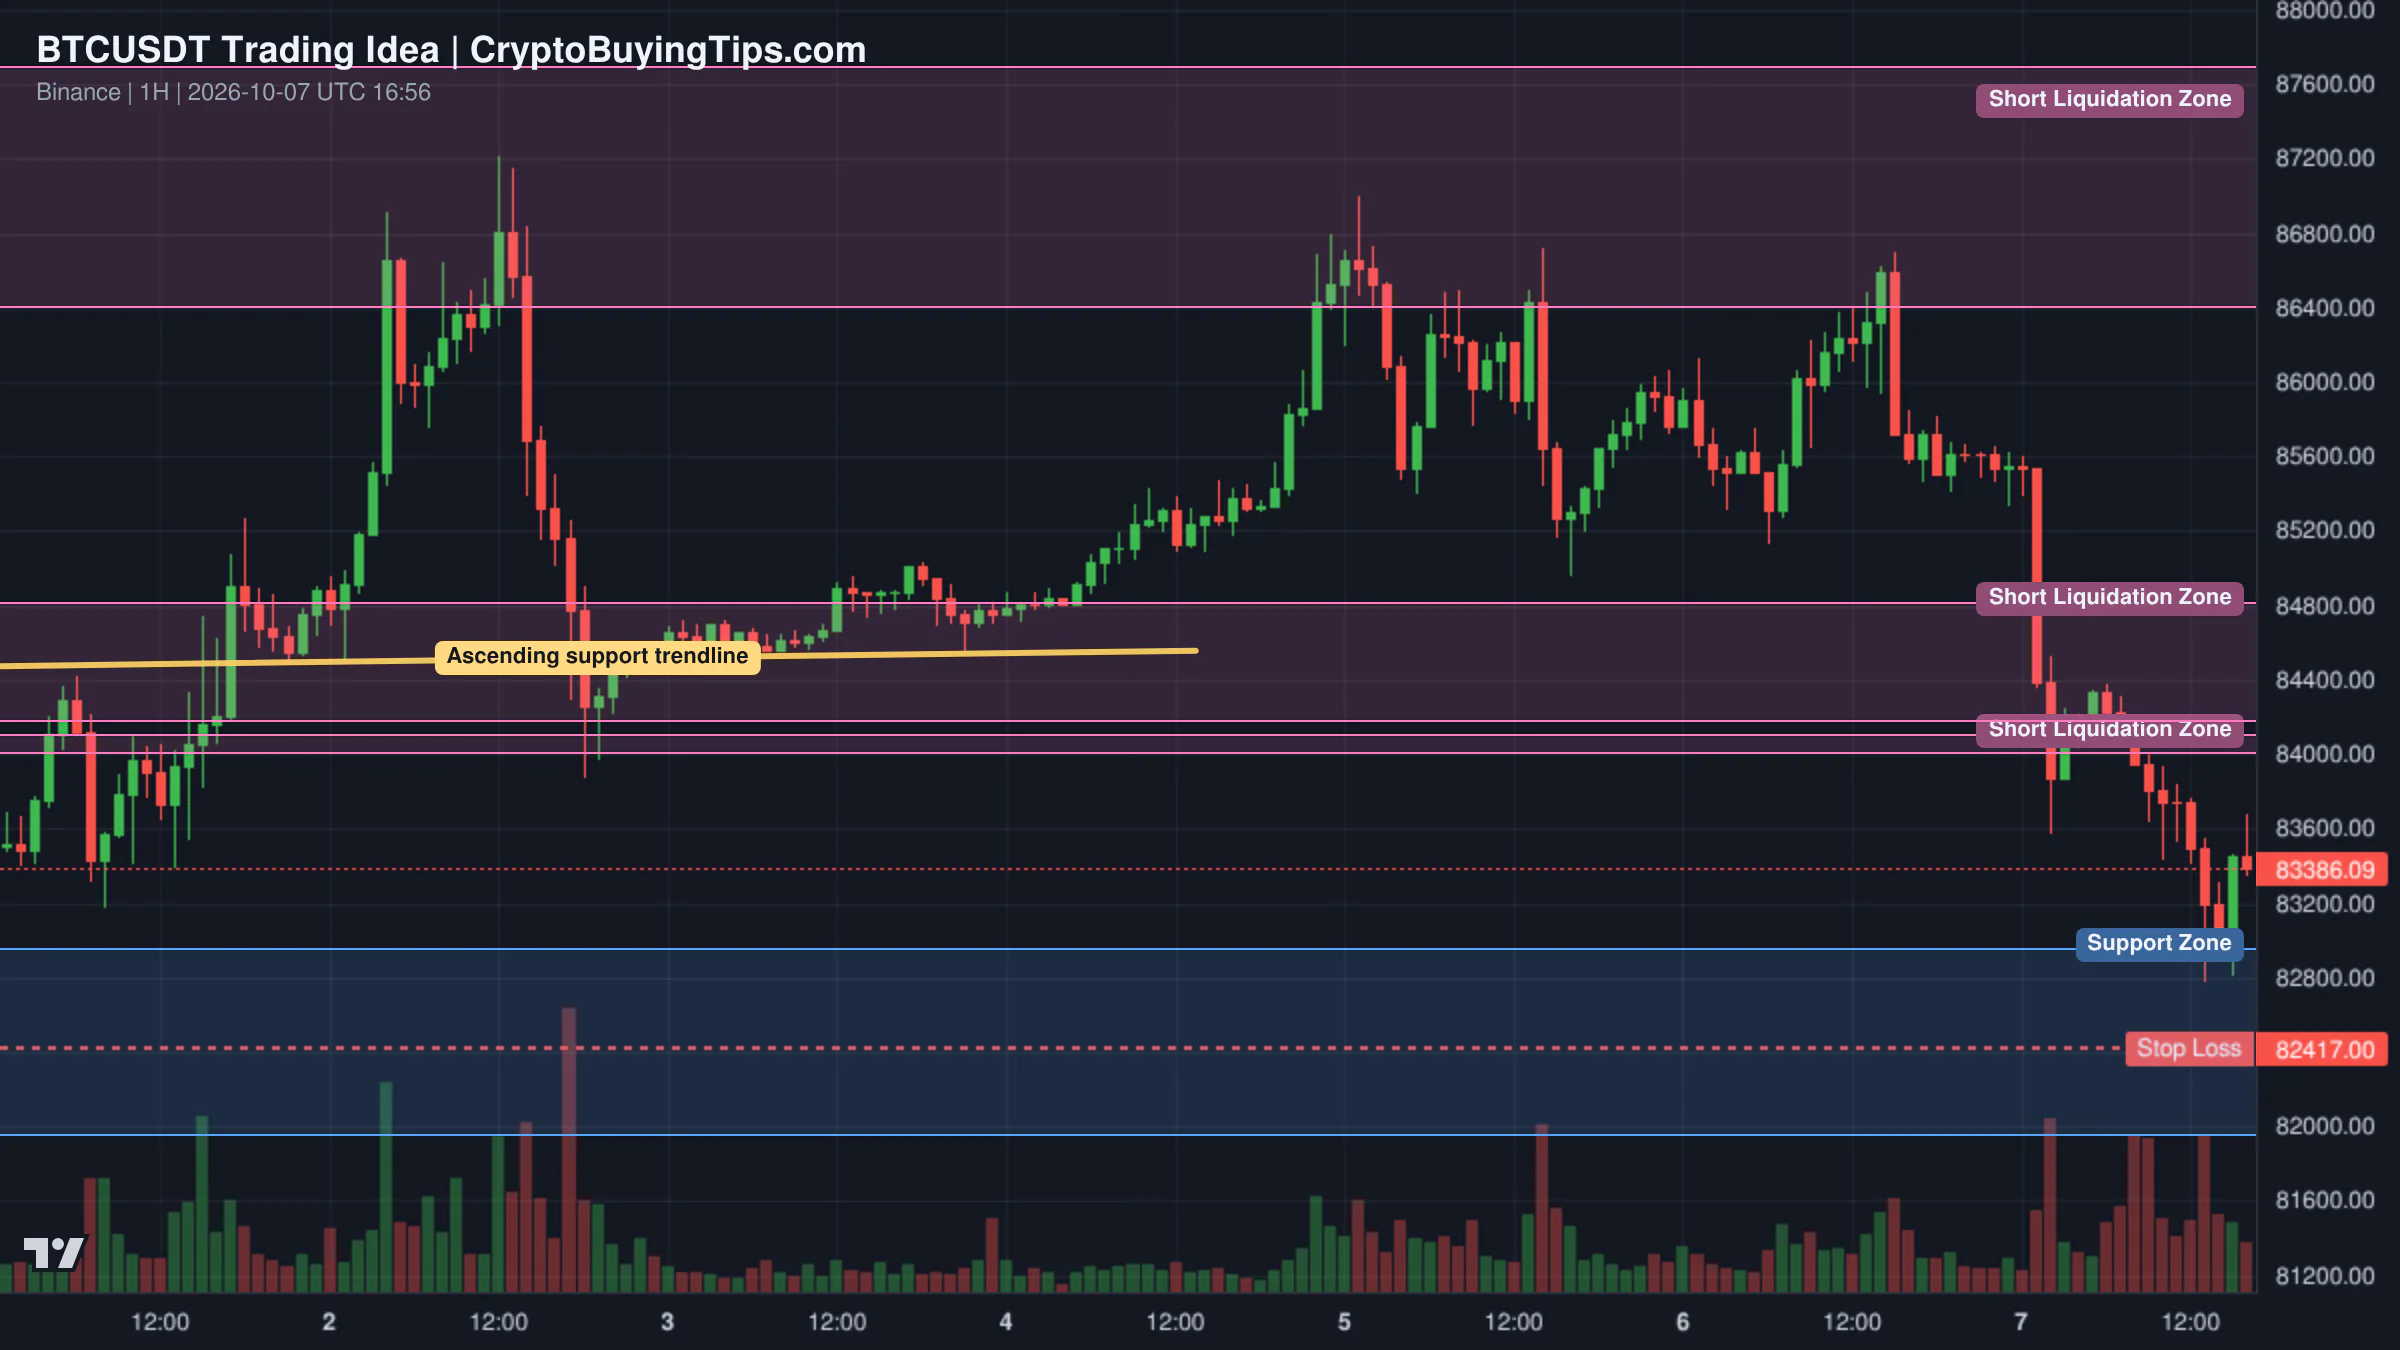
For those looking at the short-term, there is a bullish setup on the 1-hour chart for Bitcoin. The asset is currently testing a demand zone between $63,700 and $63,900. The thesis here is a liquidity sweep: the market dips just enough to trigger stop-losses of early buyers before launching a multi-wave rebound. The target for this move is the overhead resistance near $65,500. The trade is invalidated if there is a 1-hour close below $63,400, which would suggest the local floor has given way.

Trading idea chart: BTCUSD - BITCOIN The Falling Wedge straight to $55000.

Conversely, a more cautious view sees a bearish reversal at the $65,600 level. This setup argues that the recent extension has run out of steam and the market is stalling into a supply zone. If the market structure breaks below this reversal zone, the next target is the $62,292 support level. A clean break there could open the door to a monthly target in the $58,300 to $58,600 range.

Trading idea chart: BTCUSDT.P - BTC – Bearish Reversal at 65,600, Eyes on 62,292 Break

For the long-term macro traders, there is a theory that Bitcoin is replicating the 2022 bear cycle through a massive "Falling Wedge" pattern on the weekly chart. If this structural repetition holds, some analysts suggest a potential minimum price of $55,000 by October. This is a stark contrast to the short-term bounce narratives, reminding us that the weekly trend is still the one that matters most.

What to watch next

The immediate focus is the SEC meeting on August 14. Any concrete details regarding "Regulation Crypto" could provide the catalyst needed to break the current sideways drift. We should also keep a close eye on the $64,600 level for Bitcoin. With $250M in short liquidations sitting just above current prices, the potential for a violent upward spike is high, regardless of the underlying fundamentals.

Finally, the divergence between the high implied volatility of Ethereum and its stagnant on-chain activity is a red flag. If ETH cannot translate this expected volatility into actual price growth, we may see further consolidation of dominance into Bitcoin. The market is currently paying for volatility it isn't using.

Crypto Market Overview | Derivatives volume dwarfs spot activity amid institutional ETF inflows | August 10, 2026
Sigrid Voss·

Crypto Market Overview | Derivatives volume dwarfs spot activity amid institutional ETF inflows | August 10, 2026

Market overview

The market is currently operating in a state of strange contradictions. While the total market cap sits around $2.21 trillion and price action remains largely flat, the underlying plumbing is frantic. The most striking data point is the massive skew toward derivatives. Trading volume in derivatives has hit $388.57 billion, which is roughly nine times the total spot volume of $42.63 billion. This is a polite way of saying the market is currently a casino where the bets are far larger than the actual assets being moved.

Sentiment is neutral, with the Fear and Greed Index holding at 40. This lack of conviction is mirrored in the price action, but the heavy derivatives volume suggests a build up of positioning that usually precedes a volatile move. Bitcoin dominance remains high at 58.89 percent, and the Altcoin Season Index is hovering between 38 and 39. We are firmly in a Bitcoin season. Capital is not rotating into smaller assets; instead, it is consolidating in the largest asset while speculators gamble on leverage.

The macro backdrop provides a slight lift, with the S&P 500 and NASDAQ both posting gains. This risk on mood in traditional equities often bleeds into crypto, but the current disconnect between spot and derivatives suggests that the "smart money" is hedging or speculating rather than simply buying and holding.

Bitcoin and Ethereum

Bitcoin is trading at $64,971.17, showing a negligible 24 hour change of 0.08 percent. Despite the flat price, institutional demand is returning. Spot ETFs pulled in $853 million in the week ending August 7, the highest weekly total since mid April. BlackRock's IBIT took the lion's share of these inflows. This suggests that while retail traders are hesitant, the big players are using this consolidation phase to accumulate.

Ethereum is in a more precarious position, priced at $1,915.9 and down 0.17 percent. The network is ghost-town quiet. Gas fees are extremely low, ranging between 0.09 and 0.12 Gwei. This indicates a severe lack of on-chain activity. Interestingly, there is a significant volatility gap. Ethereum's implied volatility is 50.96, while Bitcoin's is 36.68. Traders are paying a premium for Ethereum options, suggesting they expect a much more violent move from ETH than from BTC, regardless of the current direction.

Top crypto prices

The top of the market is mostly sideways. BNB is at $605.59, up 0.29 percent. XRP has dipped 0.43 percent to $1.03. Solana is showing some strength at $76.75, up 0.51 percent. TRON is at $0.3312, up 0.58 percent. Hyperliquid is trading at $54.49, down 0.08 percent.

News driving today's market

Institutional validation continues to arrive in waves. Standard Chartered has initiated coverage on Chainlink with a staggering price target of $200 by 2030. The bank expects tokenized assets to reach $4 trillion by 2028. This shift toward active crypto management is a theme we have seen emerging, where institutions stop just tracking the index and start making directional bets on infrastructure.

On the security front, Bybit has won a court order to freeze assets following a $1.5 billion hack by North Korea's Lazarus Group. This is a rare win for an exchange against a state sponsored actor. It shows that regulatory and legal frameworks are finally catching up to the speed of on chain theft. Meanwhile, the UK's FCA is preparing a framework for tokenized gold, and Mastercard has acquired the stablecoin firm BVNK. These moves suggest that the "rails" of the financial system are being rebuilt with crypto technology, even if the tokens themselves are currently boring.

However, there is a darker narrative of a "dot com style shakeout." Reports suggest over 100 projects will fold in 2026. This is a necessary cleansing of vaporware. We have noted before how the dominance data agrees that capital is fleeing speculative alts in favor of Bitcoin.

Technical risks are also surfacing. The Bitcoin Red Team has identified 1,288 critical and high level vulnerabilities in the Bitcoin ecosystem. While the network has survived countless attacks, this volume of vulnerabilities is a reminder that no protocol is perfectly secure. Finally, Brazil is introducing a 24 hour wait on transfers to self custody wallets starting in 2027. This introduces friction into the very thing crypto was designed to eliminate.

Social intelligence

On chain data from CryptoQuant suggests Bitcoin active addresses have returned to levels seen during 2018 and 2019. Analyst @thechessONCHAIN argues this supports a possible bottoming structure, though it is not yet a standalone buy signal. This aligns with the ETF inflow data; the floor is being built, but the ceiling is still heavy.

Liquidity is moving in bulk. Tether minted $1 billion in USDT on the Tron network today. Large mints usually signal that traders are preparing to buy, or that the ecosystem is expanding its operational capacity.

From a macro perspective, geopolitical tensions are shifting. Reports indicate that regional defense pacts in the Middle East are signaling a move away from U.S. security guarantees. This kind of instability often drives a flight to safety, which can benefit Bitcoin if it is viewed as a neutral reserve asset, or hurt it if the global economy enters a period of genuine chaos.

Trading ideas worth watching

A bullish setup is forming on the BTCUSDT 1 hour chart. Bitcoin is currently holding the lower support boundary of a wedge pattern at approximately $65,042. The technical read suggests a multi wave rally toward the upper resistance of $66,800. The plan involves an initial surge to $66,000, a retest of $65,500, and a final acceleration. Long entries are identified between $64,850 and $65,100, with a stop loss if the 1 hour candle closes below $64,500.

Redrawn BNBUSDT 1D trading idea chart for BNB: Nothing Changed...Remains BullishRedrawn BTCUSDT 60 trading idea chart for BTC/USDT: THE $66,800 WEDGE EXPANSION RALLY!

BNB remains bullish on the daily timeframe. It has respected a maximum correction level at $585 and is now accumulating momentum. The analyst expects a strong move in early September as market volume increases. The setup is a patient play on market structure rather than a quick scalp.

WLD is attempting a reversal. It is currently rejecting a strong demand zone that previously served as an accumulation base. For the bulls to take full control, the price needs to break above the $0.37 to $0.38 range. Until that break happens, the current move is just a bounce off support, not a confirmed trend change.

Altcoin Spotlight

Chainlink deserves attention due to the Standard Chartered analysis. The bank's projection of $200 by 2030 is based on the growth of tokenized assets and DeFi fees. Chainlink currently secures over $110 billion in value and covers roughly 70 percent of oracle dependent value in DeFi globally. If the $4 trillion tokenization narrative holds, Chainlink is the primary infrastructure play. It is the rare altcoin that has a direct link to traditional finance's institutional roadmap.

What to watch next

The primary risk is the derivatives to spot volume ratio. When leverage is nine times higher than spot trading, the market is prone to "long squeezes" or "short squeezes" that can move the price 5 percent in minutes regardless of the news. We are watching for a catalyst that forces these leveraged positions to liquidate.

We are also monitoring the "shakeout" narrative. If more high profile projects begin to fold, it could trigger a temporary panic in the altcoin market. However, if that capital continues to flow into Bitcoin ETFs, the result will be a further increase in Bitcoin dominance. The tension between the "crypto winter" remnants and the "institutional spring" is where the next big move will be decided.

Crypto Market Overview | volume collapse masks institutional accumulation despite flat prices | August 9, 2026
Sigrid Voss·

Crypto Market Overview | volume collapse masks institutional accumulation despite flat prices | August 9, 2026

Market overview

The market is currently in a state of profound contradiction. On the surface, the total market cap is holding steady at $2.21T, showing a negligible increase of 0.09%. However, the plumbing beneath the price action suggests a sudden and sharp loss of interest. Trading activity has fallen off a cliff. 24h volume is down nearly 28% to $35.10B, but the real story is in the derivatives market. Derivatives volume has crashed by 45.19%, falling to $267.97B. When the leverage disappears this quickly, it usually means traders are either terrified or simply bored.

Sentiment remains stubbornly neutral with the Fear and Greed Index sitting at 40. This neutrality is mirrored in the Altcoin Season Index, which reads 37. We are firmly in a Bitcoin season, though not a particularly exciting one. The relationship between price and volume here is telling. Prices are flat, but the volume collapse is aggressive. This suggests that the current price levels are not being defended by active trading, but rather by a lack of conviction to sell.

Stablecoin dominance is hovering around 11.10%, and the overall trend is flat to slightly bullish in terms of capitalization. Yet, the activity split shows that DeFi volume is also down 24.48%. The market is effectively holding its breath. The S&P 500 and NASDAQ are both ticking upward, which should theoretically provide a risk-on tailwind for crypto, but that correlation is currently muted.

Bitcoin and Ethereum

Bitcoin is trading at $64,921.56, essentially unchanged over the last 24 hours. The asset is dominating the market at 58.83%, a position that feels secure given the lack of momentum elsewhere. There is a strange divergence between institutional flows and price action. Spot Bitcoin ETFs just posted their best week since April, drawing $1B in inflows. Usually, that amount of institutional buying triggers a rally. Instead, Bitcoin is drifting. It seems the "smart money" is accumulating in silence, while the rest of the market waits for a reason to care.

Ethereum is in a more precarious position, priced at $1,919.34. Its dominance has slipped to 10.46%. The most alarming metric for Ethereum is not the price, but the network activity. Gas fees are currently between 0.07 and 0.08 Gwei. This is an incredibly low level of congestion, which in the crypto world is often a euphemism for a ghost town. While Bitcoin is benefiting from ETF inflows, Ethereum is struggling to find a narrative that translates into actual on-chain usage.

The volatility gap between the two is also widening. Ethereum's implied volatility is 50.28%, significantly higher than Bitcoin's 36.16%. This suggests that traders expect a much more violent move from Ethereum, though the data doesn't yet indicate which direction that move will take.

Top crypto prices

Outside of the two giants, there are a few pockets of green. BNB has climbed 1.59% to $603.96, and Solana is up 1.82% at $76.36. These moves are modest, but they stand out in a market where almost everything else is stagnant. XRP is slightly down at $1.03, and TRON is marginally up at $0.3292.

Hyperliquid is trading at $54.55, down 0.40%. Given the massive drop in overall derivatives volume, it is a bit ironic to see the primary perpetuals platform itself slipping in price. The CMC20 and CMC100 indices are both essentially flat, confirming that the current price stability is a result of total inertia rather than a coordinated bull run.

News driving today's market

The most significant catalyst on the horizon is the US Senate's move toward the CLARITY Act. Majority Leader John Thune has filed cloture, setting up a procedural vote for September 15. This bill is a high-impact event because it seeks to establish a federal market structure and delineate the boundaries between the SEC and CFTC. If the Senate manages to clear the 60-vote threshold, it provides the kind of regulatory certainty that institutional desks require before deploying serious capital. We previously covered dominance data agrees for more background.

In a move that perfectly captures the absurdity of the current market, T. Rowe Price has included memecoins in its actively managed crypto ETF. The $1.9 trillion asset manager argues that memecoins are a "real-world stress test" for blockchain scalability. It is a bold pivot. We previously covered how this shift toward active crypto management suggests that institutions are no longer satisfied with just tracking Bitcoin. They are now willing to bet on the more speculative corners of the market.

On the bearish side, Brazil's central bank is tightening the screws. New rules will require exchanges to delay large crypto transfers abroad, specifically those over $10,000. This introduces friction into cross-border liquidity and signals a broader trend of central banks attempting to ring-fence their domestic capital.

Meanwhile, Bitwise's Matt Hougan is making headlines by predicting that trillions of dollars will flow into Bitcoin. His logic is that a mere 1% shift from global capital pools into Bitcoin would unlock massive growth. It is an optimistic take, but it aligns with the $1.1B in recent ETF inflows.

Social intelligence

On-chain and social data highlight a growing trend of using Bitcoin as a corporate treasury tool for traditional infrastructure. MARA has pledged 18,750 BTC, worth roughly $1.2 billion, to secure $600 million in loans. The funds are earmarked for energy and AI infrastructure. This is a significant development. It shows that Bitcoin is moving beyond a "store of value" and is now being used as high-quality collateral to fund the physical build-out of the AI era.

The social mood is tempered by a few grim reminders of the risks of self-custody. Reports of a plot to kidnap a Bitcoin holder's parents in Missouri serve as a stark reminder that as the value of these assets grows, so does the incentive for physical-world crime.

From a macro perspective, there are signs of a cooling tech appetite. Data from KPMG suggests that 49% of executives have scaled back their AI agents because the costs are outweighing the benefits. If the AI hype cycle hits a wall, it could bleed into the crypto market, particularly for projects that have spent the last year rebranding themselves as "AI-powered."

Trading ideas worth watching

The most compelling setup right now is on the Bitcoin daily chart. Price is approaching a critical resistance zone at $67,000. This level is not just a psychological barrier; it aligns with the neckline of a forming inverse Head and Shoulders pattern. This is a classic bullish reversal setup.

Redrawn BTCUSDT 1D trading idea chart for Bitcoin this week will pump above 67K or strong dump will cook

If Bitcoin manages to break and close above $67,000 with strong volume, the pattern completes. The measured move from the head to the neckline would project a rally toward $80,000. However, the risk is high. If the $67,000 resistance holds, we could see a strong rejection that sends the market back into a boring range or triggers a dump. The key is the volume. Given that derivatives volume has collapsed by 45%, any breakout without a massive surge in activity will likely be a fake-out.

What to watch next

The market is currently a coil. We have strong institutional inflows and a potential legislative breakthrough in the US, yet the retail side of the market has effectively gone on vacation. The collapse in trading volume is the most important metric to track. If volume remains this low, the $67,000 resistance on Bitcoin will likely hold, as there isn't enough aggressive buying power to force a breakout.

The date to circle is September 15. The Senate vote on the CLARITY Act will be the primary driver of volatility for the next few weeks. Until then, we are likely to see more of this stagnant price action. The gap between the "trillions" promised by institutional managers and the 0.07 Gwei gas fees on Ethereum is where the current tension lies. We are waiting to see if the institutional bid is enough to wake up the rest of the market.