

Half of Bitcoin holders are underwater and that is actually a good sign
With Bitcoin's Fear & Greed Index sitting squarely at a 'Fear' reading of 25, one might assume panic selling is imminent; however, examining what is bitcoin unrealized profit suggests something quite different. While the headlines focus on the immediate price drop, the on-chain data reveals a shift in who is holding the asset and how they feel about it. Our news scoring system rated this story 9/10 for novelty because most traders ignore the psychological floor created by "underwater" holders. We previously covered The for more background.
Understanding what is bitcoin unrealized profit
In the simplest terms, unrealized profit is a "paper gain." If you bought one Bitcoin at $40,000 and the price is now $60,000, you have an unrealized profit of $20,000. You haven't actually made that money yet because you haven't sold the asset. The moment you trade that Bitcoin for cash or another coin, the profit becomes "realized."
When we look at the entire network, we aren't just looking at one person. We are looking at the aggregate of every single Bitcoin wallet. On-chain analysts track the "cost basis" of these coins by looking at the price Bitcoin was trading at the last time a specific coin moved from one wallet to another. This allows us to estimate whether the current owner is in profit or loss.
How the math actually works
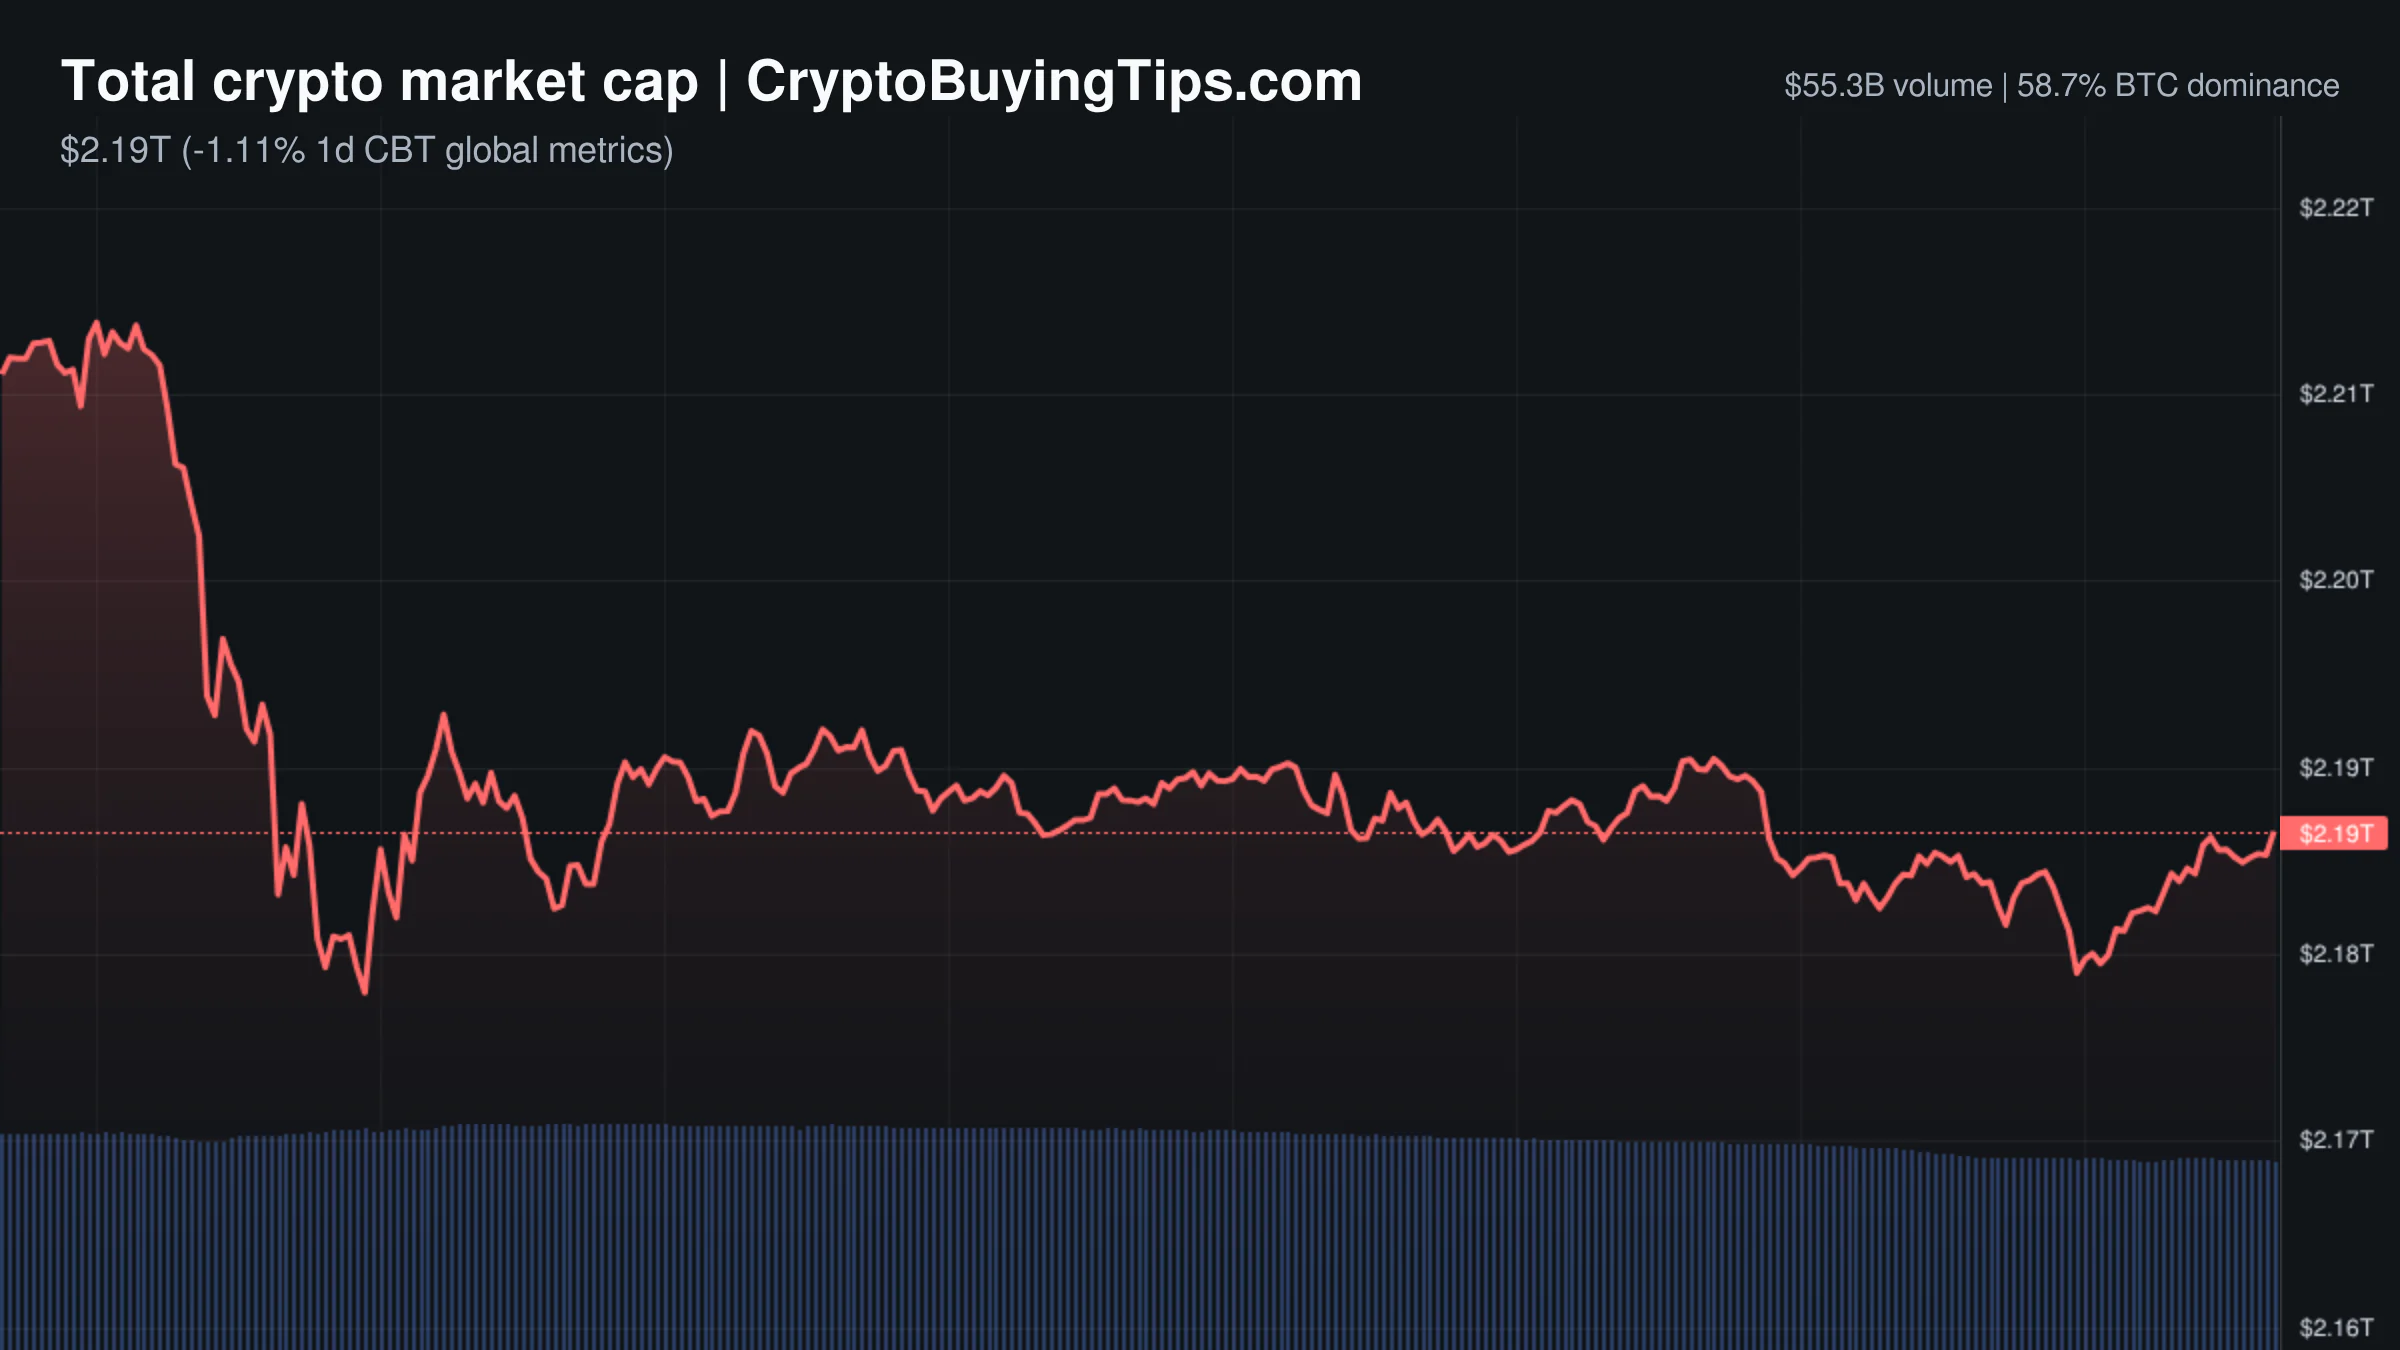
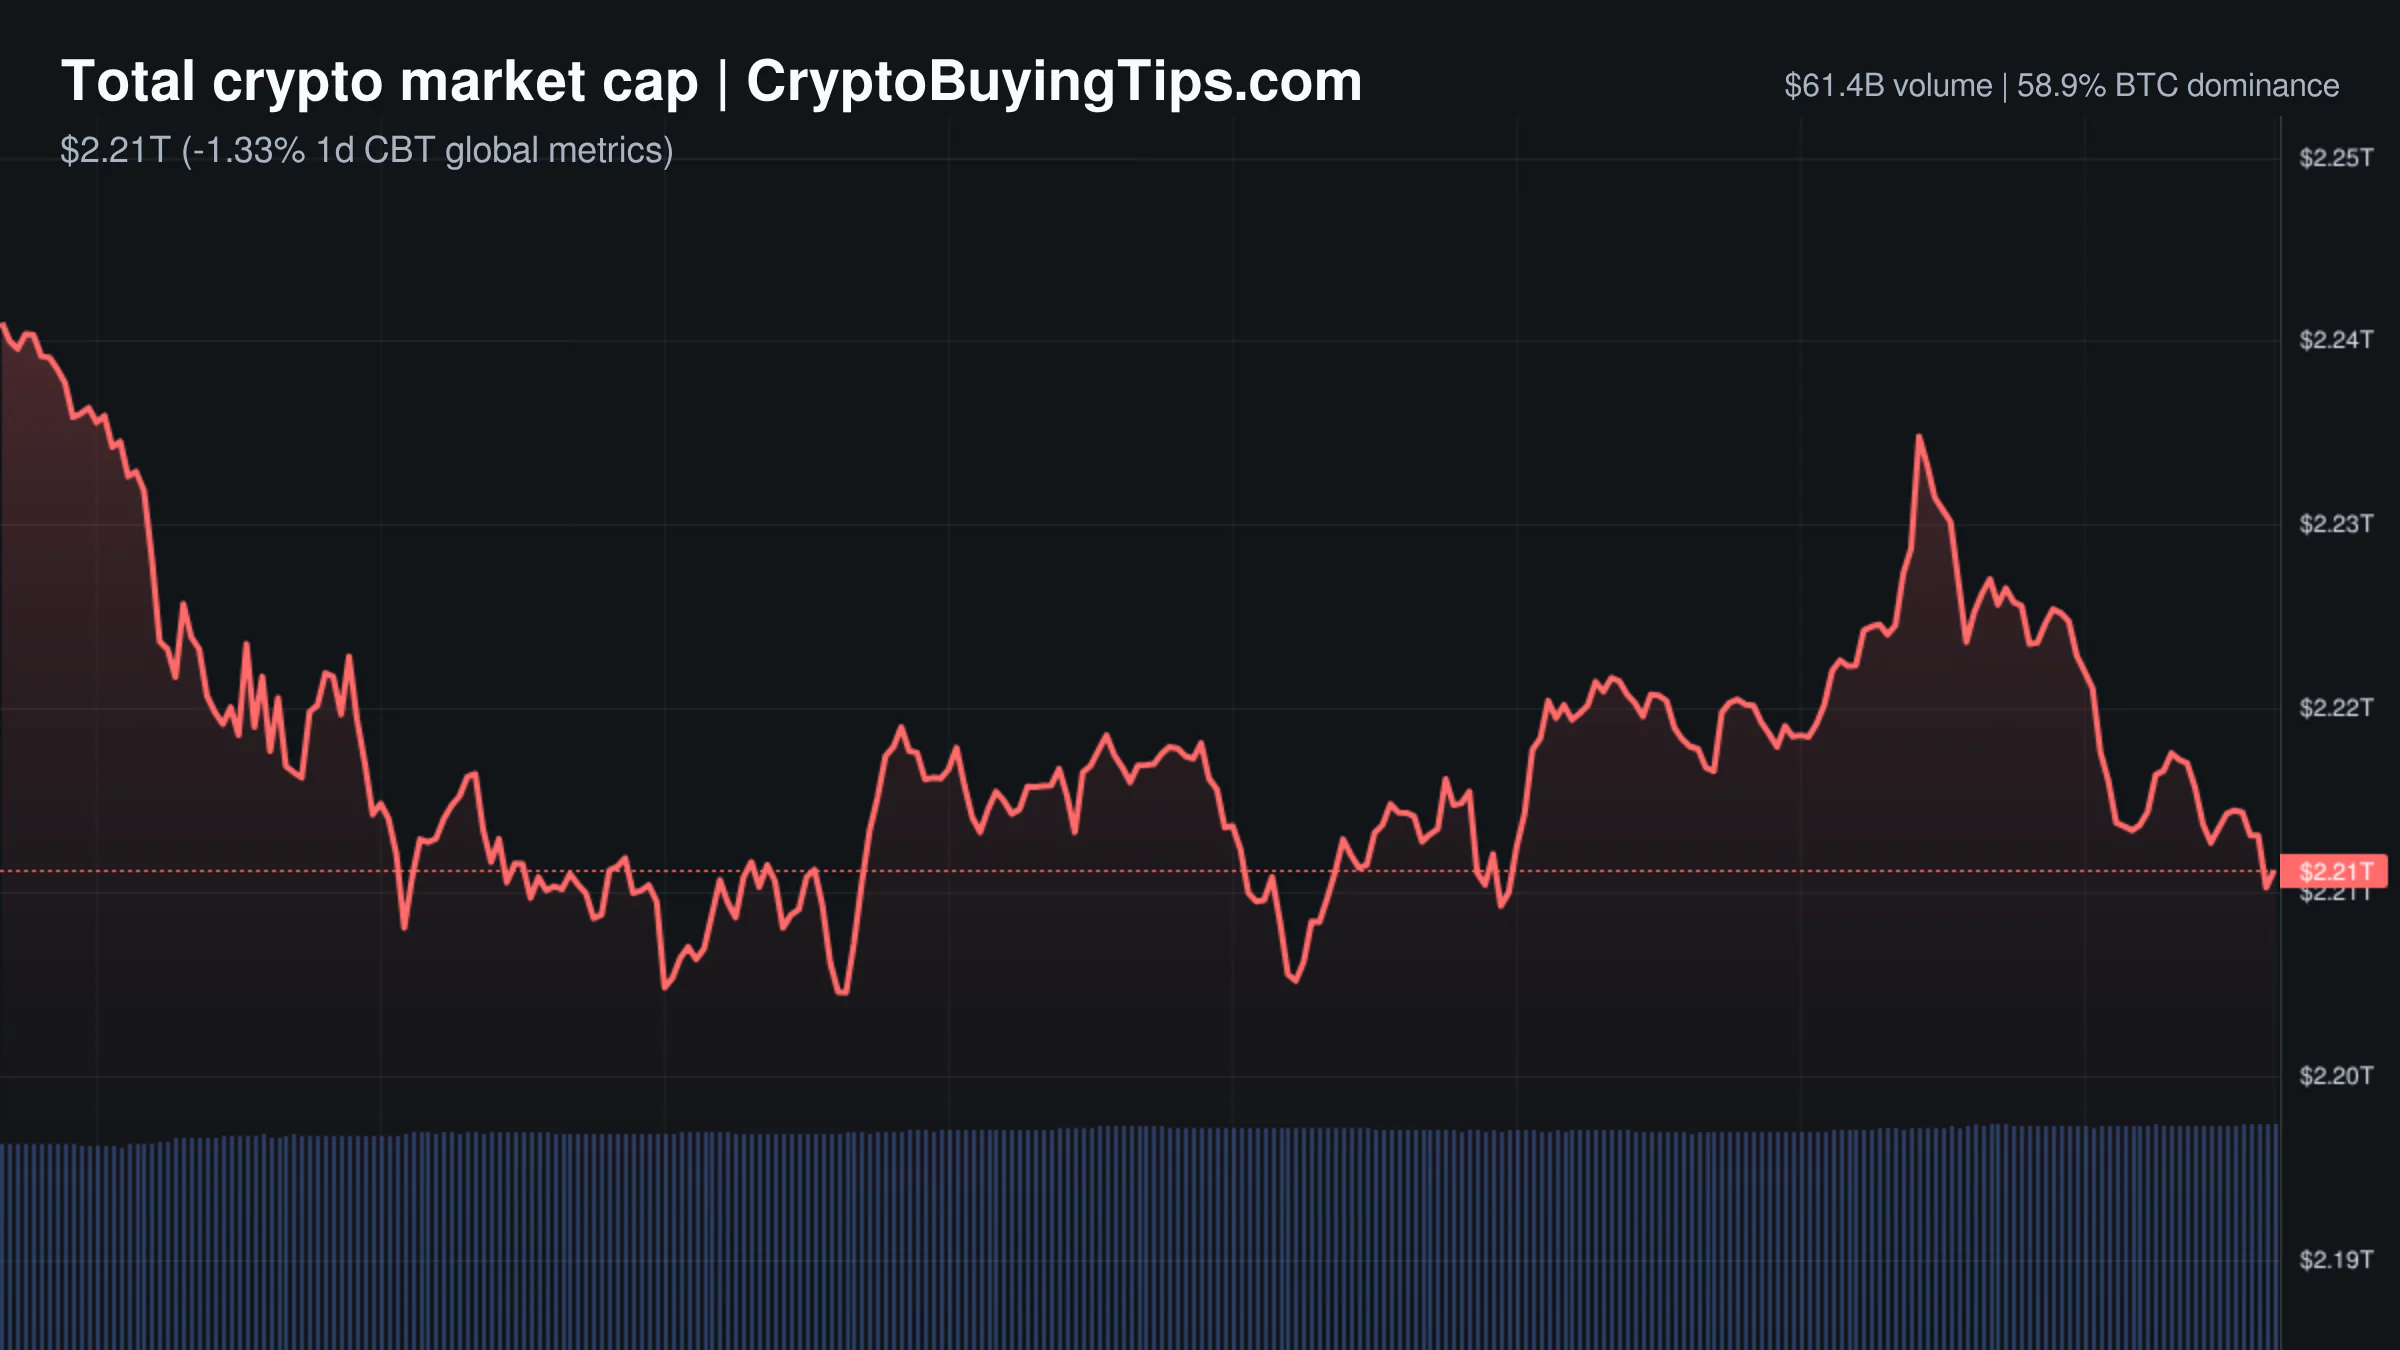
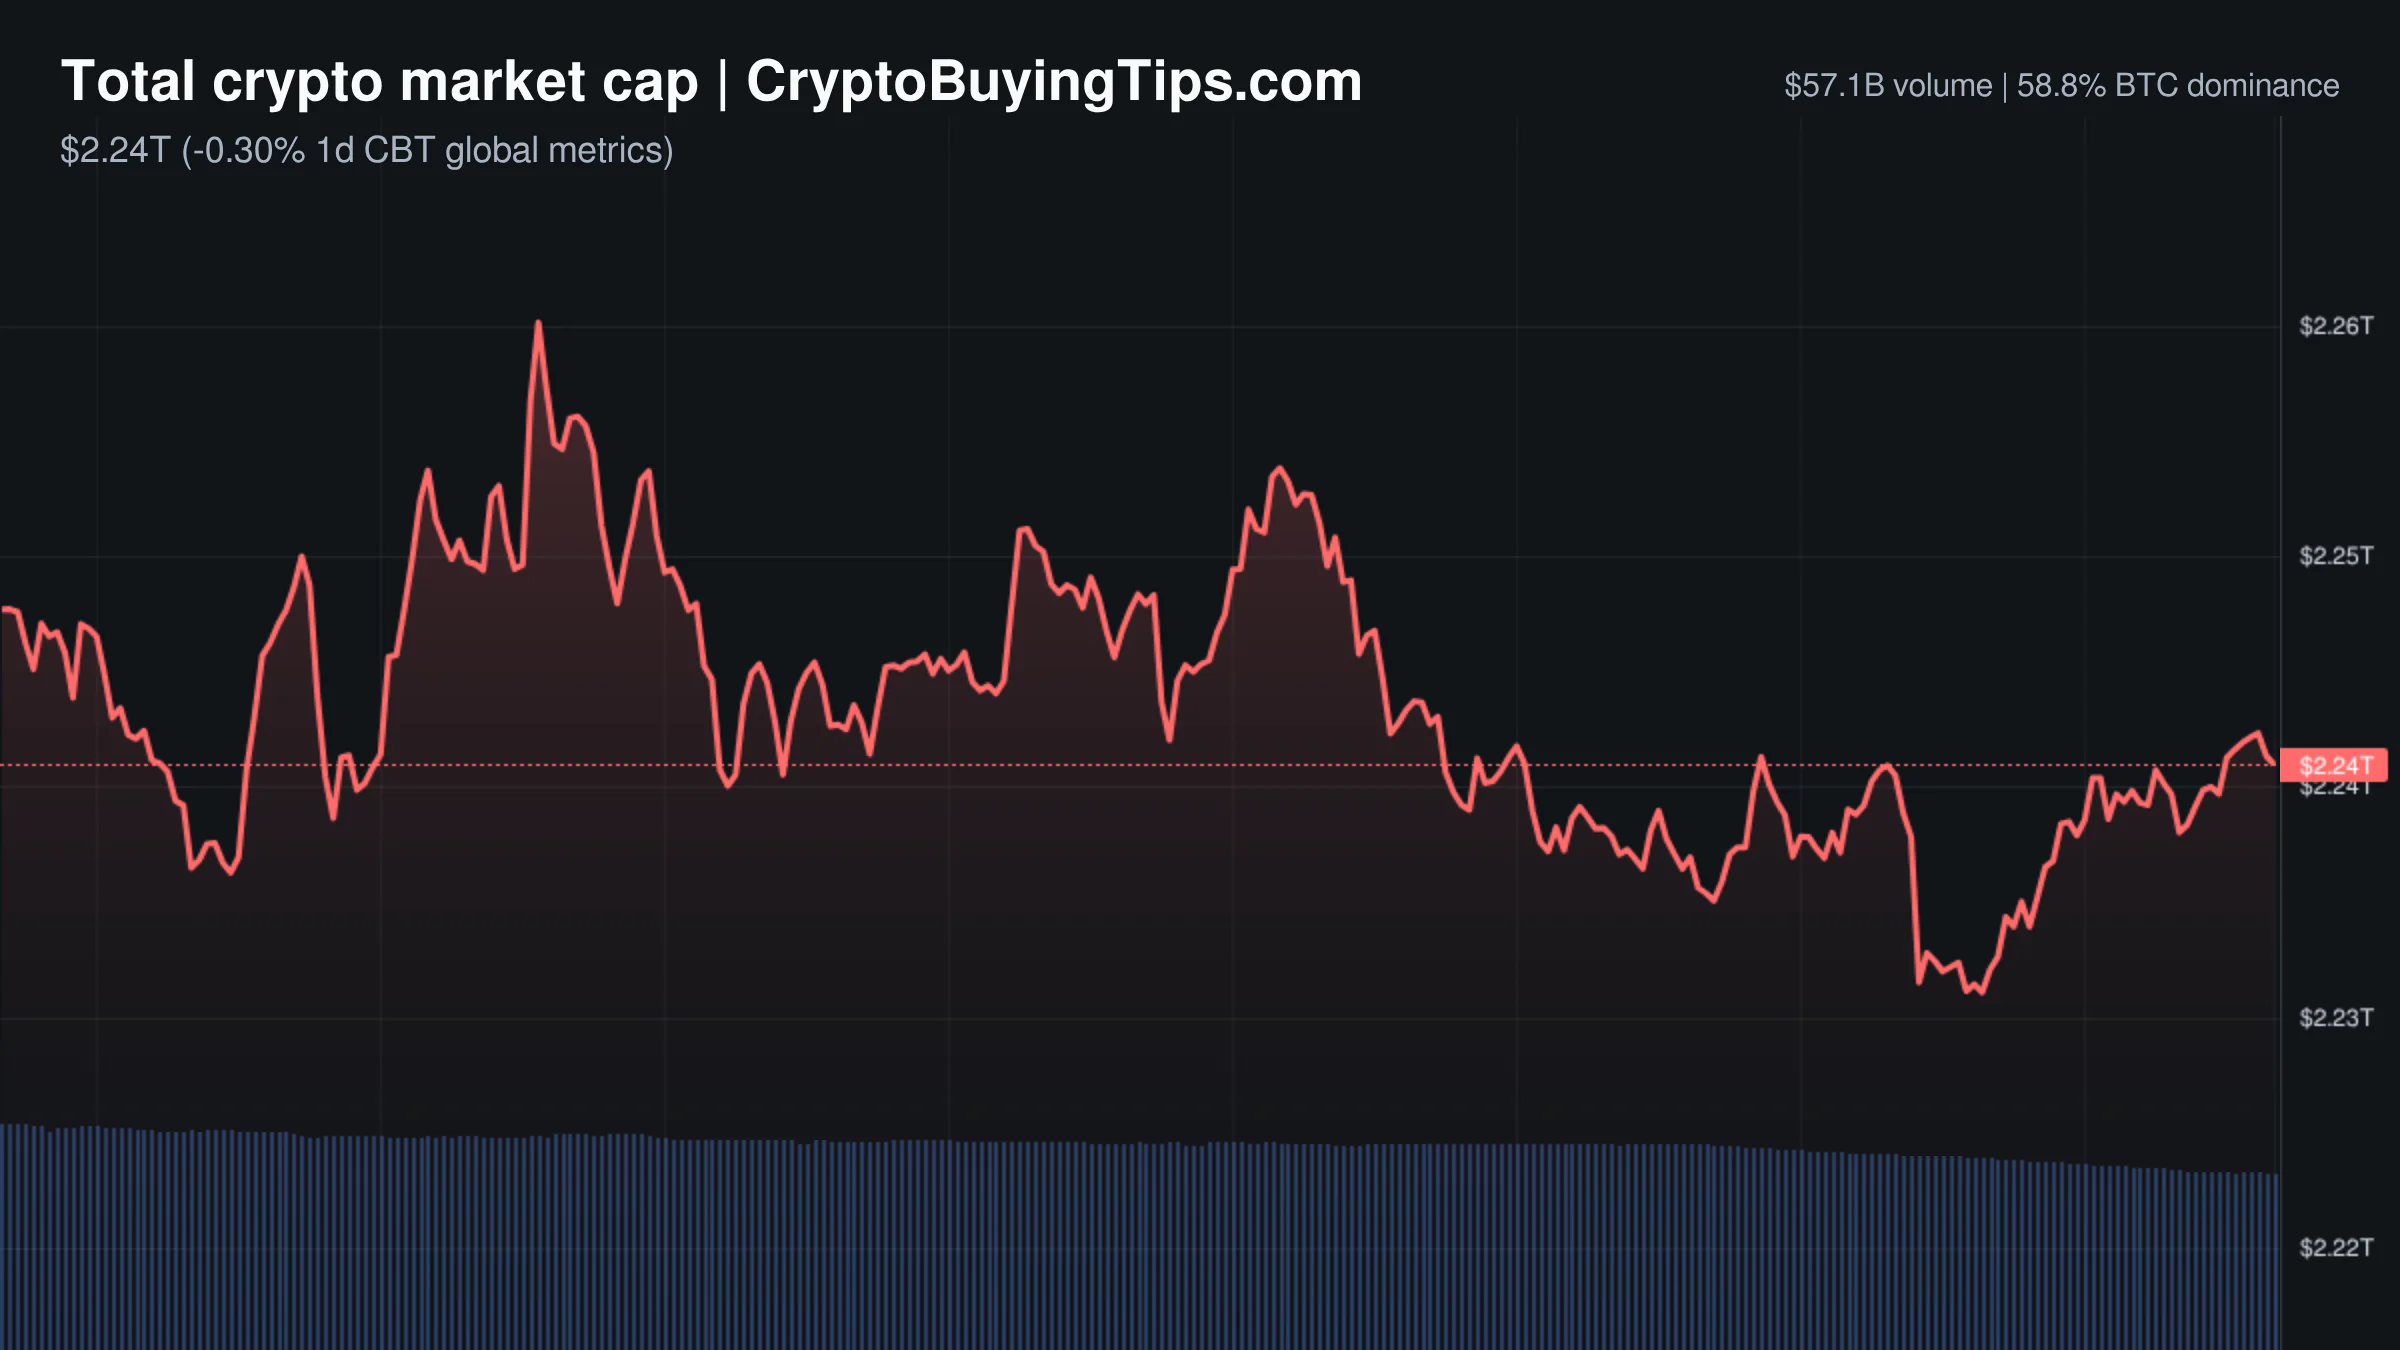
To understand this on a macro scale, we look at the gap between Market Value and Realized Value. Market Value is easy; it is just the current price multiplied by the number of coins in circulation. Currently, the total market cap sits at $2.47T.
Realized Value is different. Instead of using the current price, it takes the price of each Bitcoin at the moment it last moved and adds them all up. This gives us a more honest look at the "average" price people paid for their holdings. By subtracting the Realized Value from the Market Value, we get the total unrealized profit or loss for the entire network. This is the basis for the Net Unrealized Profit/Loss (NUPL) metric, which helps identify when the market is overheating or bottoming out bitcoinmagazinepro.com.
Why a 50.6% loss is actually a signal
Right now, the data shows that roughly 50.6% of Bitcoin is currently underwater. For a beginner, seeing that half the market is in the red looks like a disaster. For an analyst, it looks like a floor.
Our signal scanner flagged this pattern when tracking historical distribution data. When a large portion of holders are in a loss position, the market enters what we call an accumulation phase. The "weak hands" (short-term speculators) usually panic and sell early in a crash. By the time the percentage of underwater holders hits this level, much of that selling pressure has already been absorbed.
If everyone were in profit, the market would be "top heavy." Any small dip would trigger a wave of profit-taking, which can lead to a violent crash. When 50.6% of holders are fighting just to break even, the incentive to sell disappears. People stop panic-selling and start waiting for a recovery.
The 'blue zone' and the contrarian read
In on-chain analysis, there is a concept known as the "blue zone." This is the region where the aggregate unrealized profit is negative. Historically, the blue zone is where the most successful long-term entries happen.
The logic is simple. Most retail traders buy when the Fear & Greed Index is at 80 and the news is shouting about new all-time highs. They are buying at the top of the unrealized profit curve. "Smart money," or institutional accumulators, tend to operate when the crowd is terrified.
When the index is at 25 and half the holders are in the red, the gap between the current price and the perceived "intrinsic value" becomes wide. This creates a gravitational pull for buyers who are not influenced by the daily noise of the news cycle. We've seen this before; we previously covered how Bitcoin dominance climbing during periods of extreme fear often signals a flight to quality.
Putting it into practice
If you are trying to gauge where we are in the cycle, stop looking at the 24-hour candle and start looking at the distribution of profit. Here is how to think about it:
- High percentage of holders in profit: The market is euphoric. Risk is high. A correction is likely because there is too much "dry powder" ready to be cashed out.
- Balanced profit/loss: The market is in a trend. It is generally safe to follow the momentum.
- High percentage of holders underwater: The market is in a capitulation or accumulation phase. This is typically the highest-reward entry point, provided the macro thesis for Bitcoin remains intact.
The current state of the market is uncomfortable. Half of the holders are staring at losses and the sentiment is fearful. But in a market driven by psychology, the most bullish signals usually appear when the most people are convinced everything is falling apart.
Related Tickers
Some links in this article may be affiliate links. We may earn a commission at no extra cost to you — this never influences our analysis or coverage.
Sigrid Voss
Crypto analyst and writer covering market trends, trading strategies, and blockchain technology.
More Articles
Crypto Market Overview | speculative retreat amid sanctions and low on-chain activity | July 25, 2026
The crypto market retreats amid sanctions news and low on-chain activity; see our overview of current metrics.
Crypto Market Overview | leverage bets meet macro pressure amid institutional shifts | July 24, 2026
The crypto market overview shows leverage bets meeting macro pressure as institutional shifts drive volume amid fear…

Bitcoin dominance is at 59%. Here is why your altcoins are bleeding
Bitcoin dominance sitting near 60% suggests capital has found its safe haven for now. When BTC dominates this much, it…
Crypto Market Overview | Derivatives volume climbs while spot appetite fades | July 23, 2026
Derivatives volume climbs while spot appetite fades in today's crypto market overview; see why leverage drives price…