Market Overviews

Daily crypto market overviews, trend analysis, and key updates from our editorial team.

Crypto Market Overview | broad liquidity withdrawal amid extreme fear and regulatory pressure | June 19, 2026
Sigrid Voss·

Crypto Market Overview | broad liquidity withdrawal amid extreme fear and regulatory pressure | June 19, 2026

Market overview

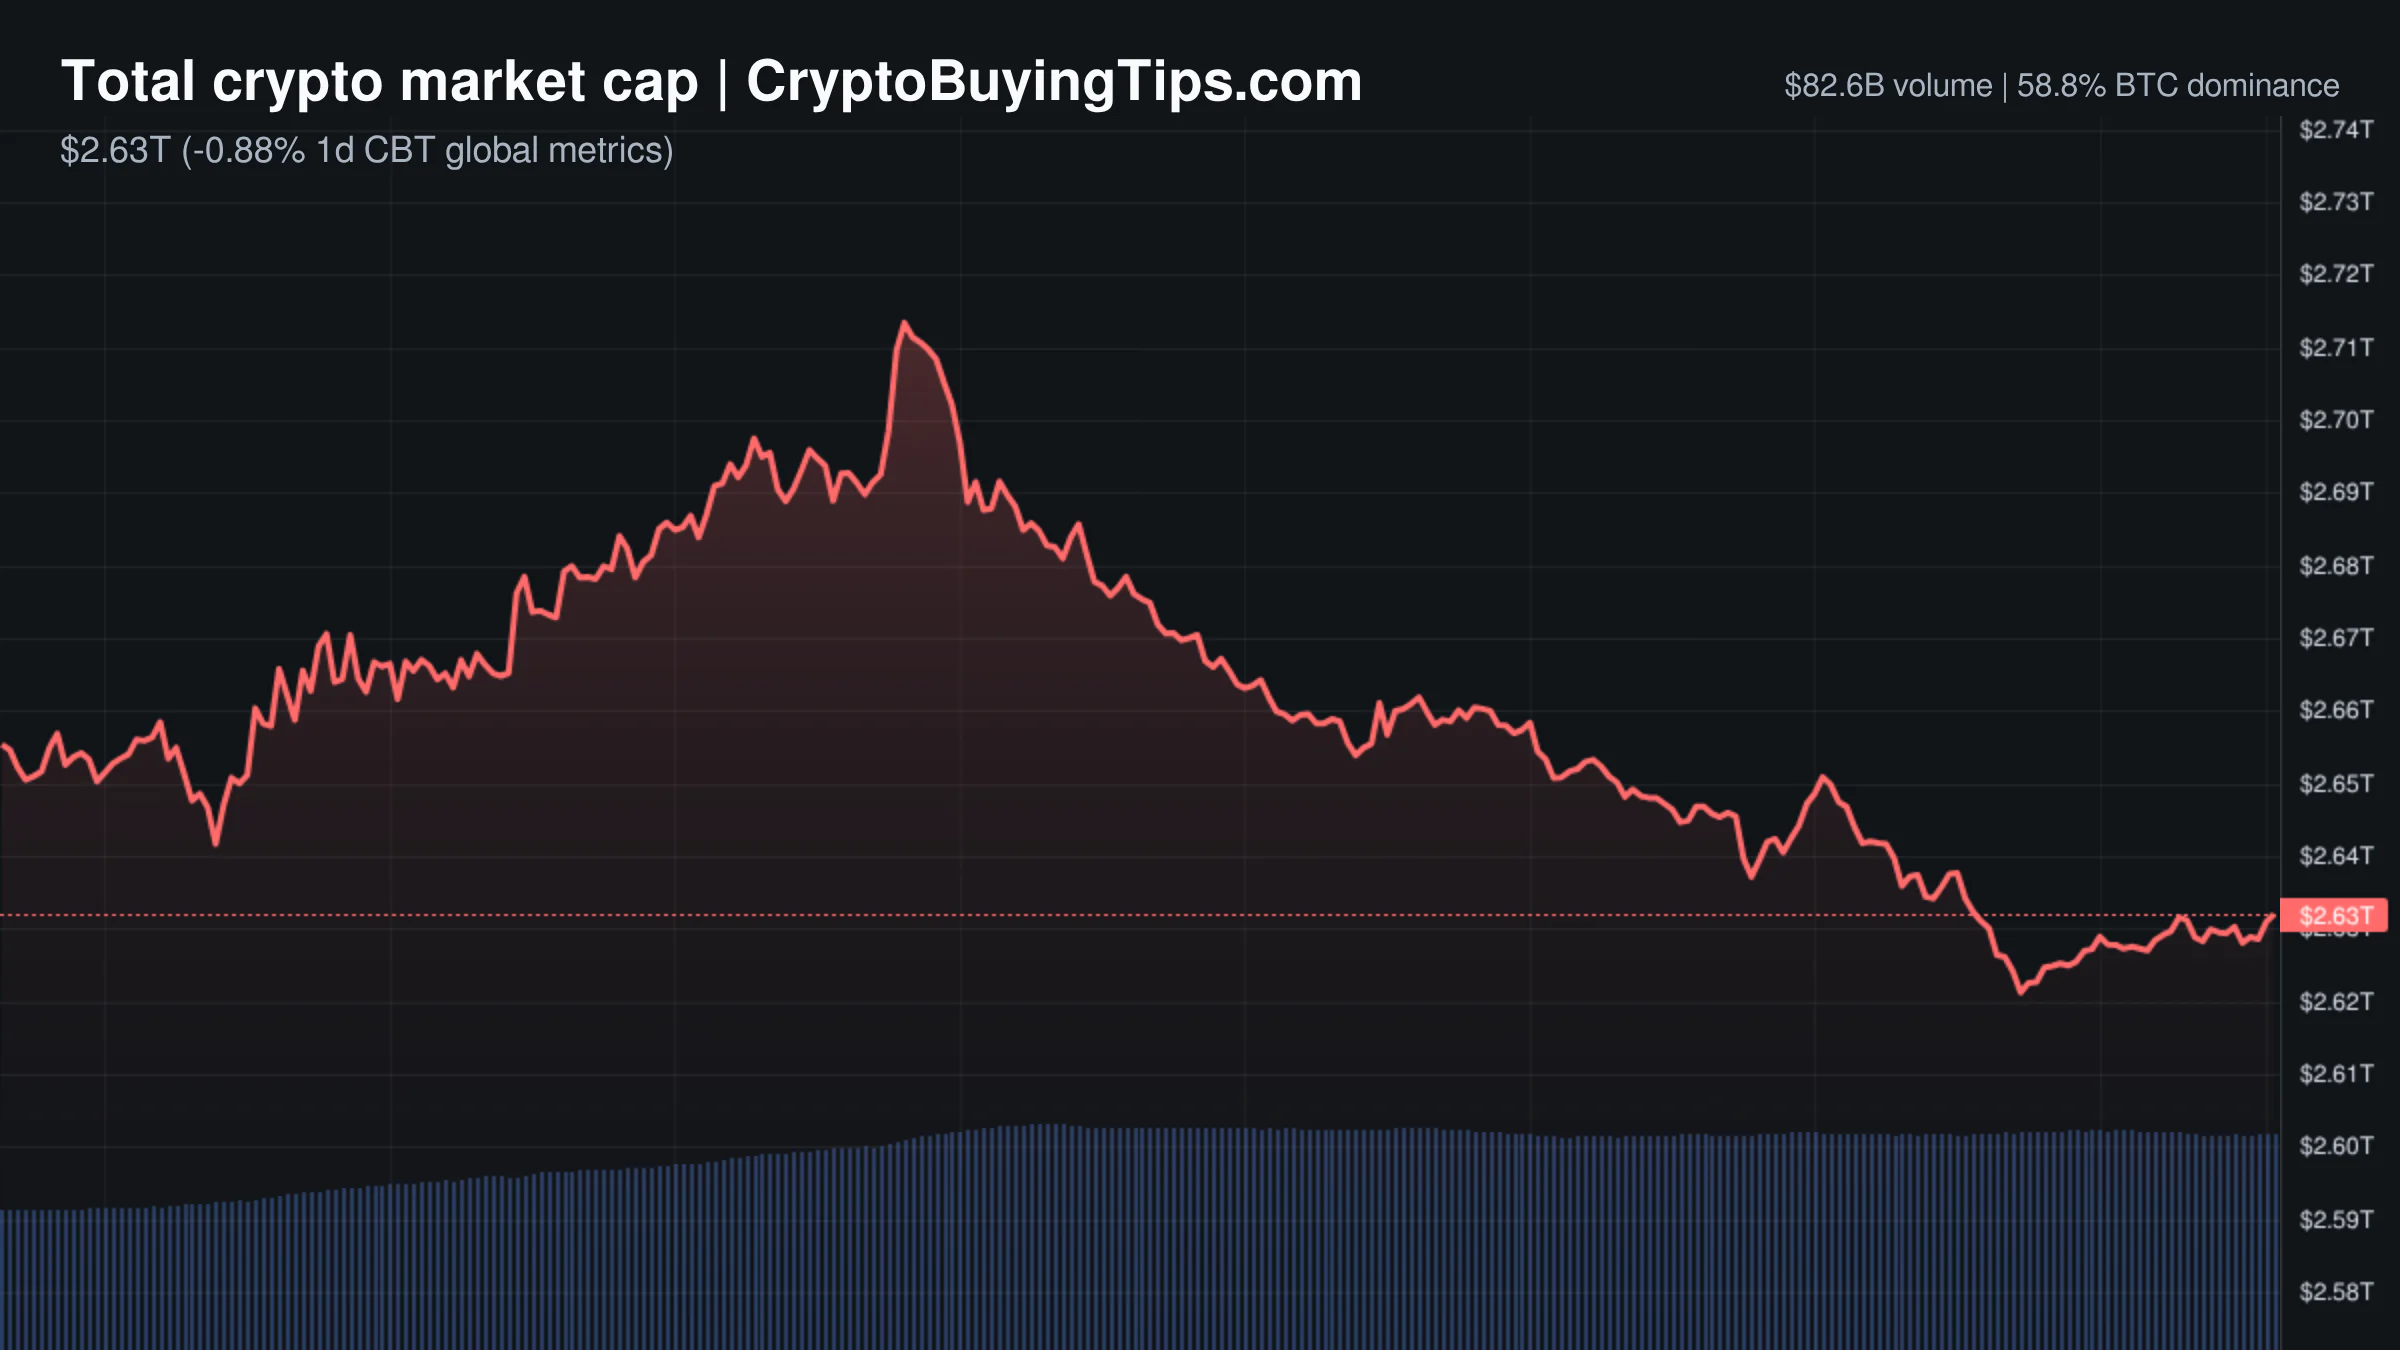
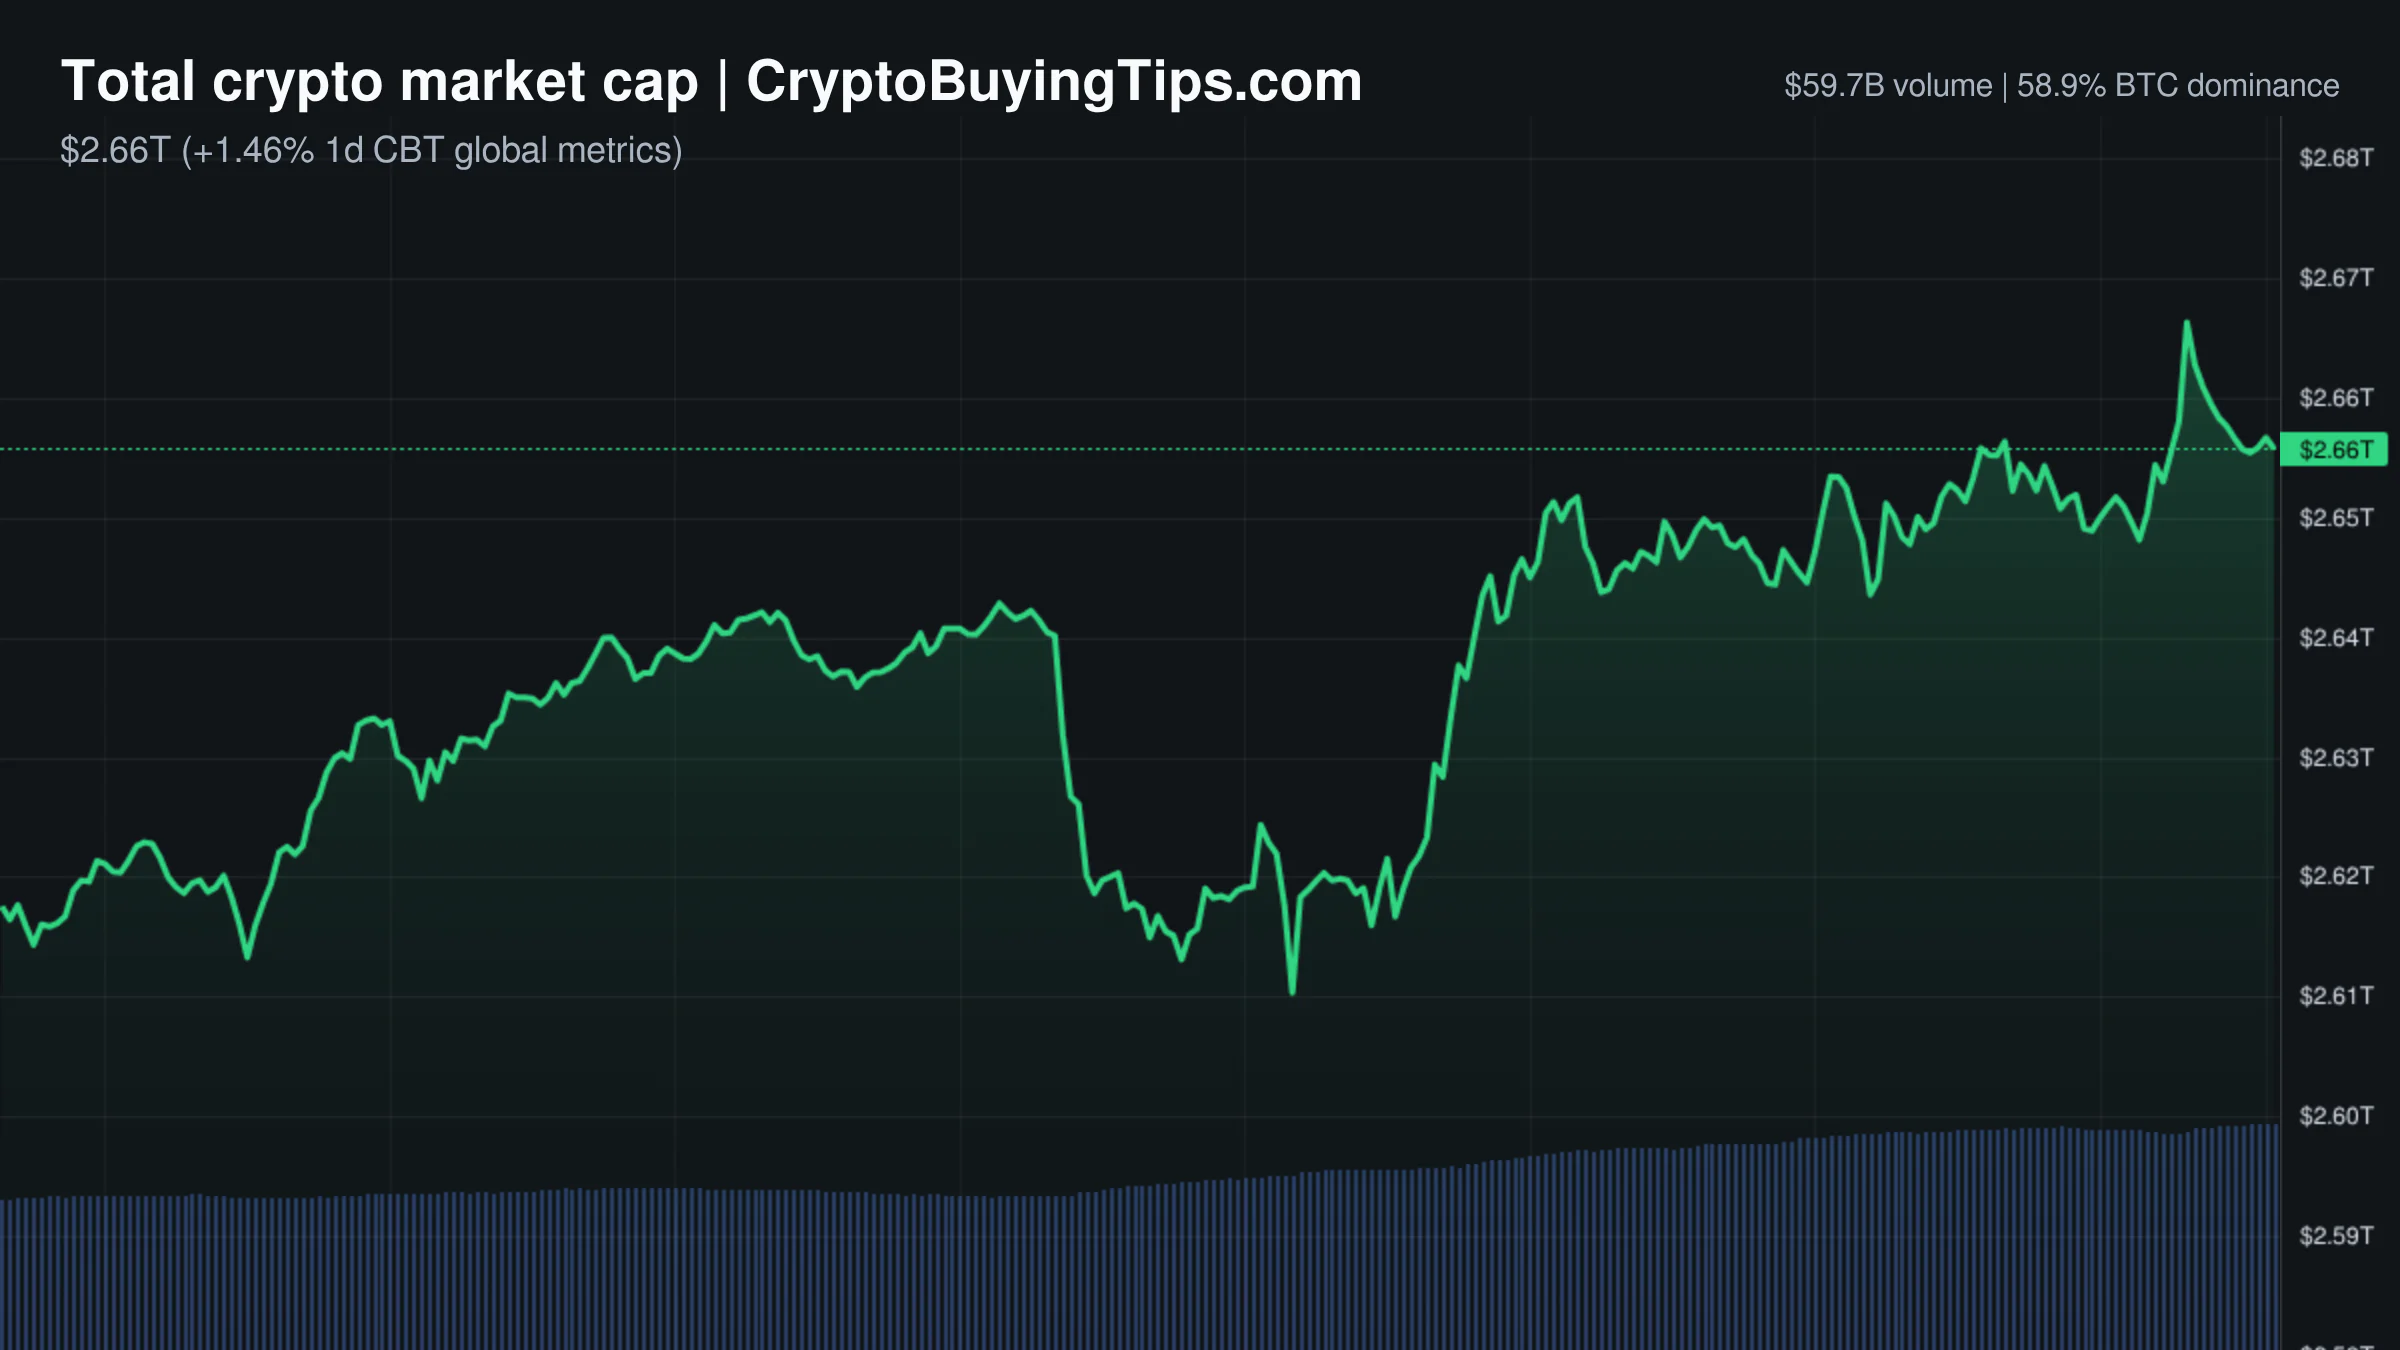
The crypto market is currently in a high-stress environment, with the total market cap sliding to $2.24T. This decline is not a localized dip but a broad withdrawal of liquidity. Spot volume, derivatives volume, and DeFi activity are all trending downward simultaneously, which usually suggests that traders are not rotating into different assets but are simply exiting the arena.

The disconnect in sentiment is particularly stark. The Fear & Greed Index has plummeted to 19, placing the market in a state of extreme fear. While such readings often precede a local bottom, the immediate price action remains bearish. Bitcoin dominance sits at 55.97%, indicating that while the entire market is bleeding, altcoins are generally suffering more. The Altcoin Season Index is contradictory across data sources, with some metrics suggesting a neutral zone and others flagging a late-stage altcoin season, but the price action for the top 100 assets tells a clearer story of systemic decline.

Interestingly, traditional risk assets are moving in the opposite direction. The S&P 500 and NASDAQ are both up, with the NASDAQ climbing 2.51%. This divergence suggests that the current panic is specific to the crypto ecosystem rather than a global risk-off event. The market is effectively ignoring the TradFi rally, preoccupied instead with a domestic regulatory storm in the US.

Bitcoin and Ethereum

Bitcoin is trading at $62,484.85, down 2.53% over the last 24 hours. The price is currently hovering near a critical support zone between $63,700 and $64,770. If this level fails, the next significant liquidity pocket sits lower, near the $60,000 mark. The bearish momentum is reinforced by a massive liquidation event, with over $361M in long positions wiped out in a single day. This suggests that the recent move was less about fundamental selling and more about a leveraged cascade.

Ethereum has fared worse, dropping 3.34% to $1,691.01. Beyond the price drop, the network is eerily quiet. Gas fees have fallen to a range of 0.08 to 0.11 Gwei, signaling a collapse in on-chain demand. When gas is this low during a price correction, it typically means the "degens" have stopped trading, leaving the asset to be moved primarily by institutional flows and algorithmic bots.

Despite the immediate gloom, there are institutional flickers of hope. Morgan Stanley has filed amendments for both ETH and SOL ETFs, aiming for the lowest fees in the market. This suggests that while retail traders are panicking, the largest players in the world are still trying to build the plumbing for mass adoption.

Top crypto prices

The broader market is seeing a sea of red. BNB has fallen 3.03% to $572.01, and XRP is down 3.97% at $1.12. Solana has experienced a sharper decline of 4.27%, now trading at $68.06.

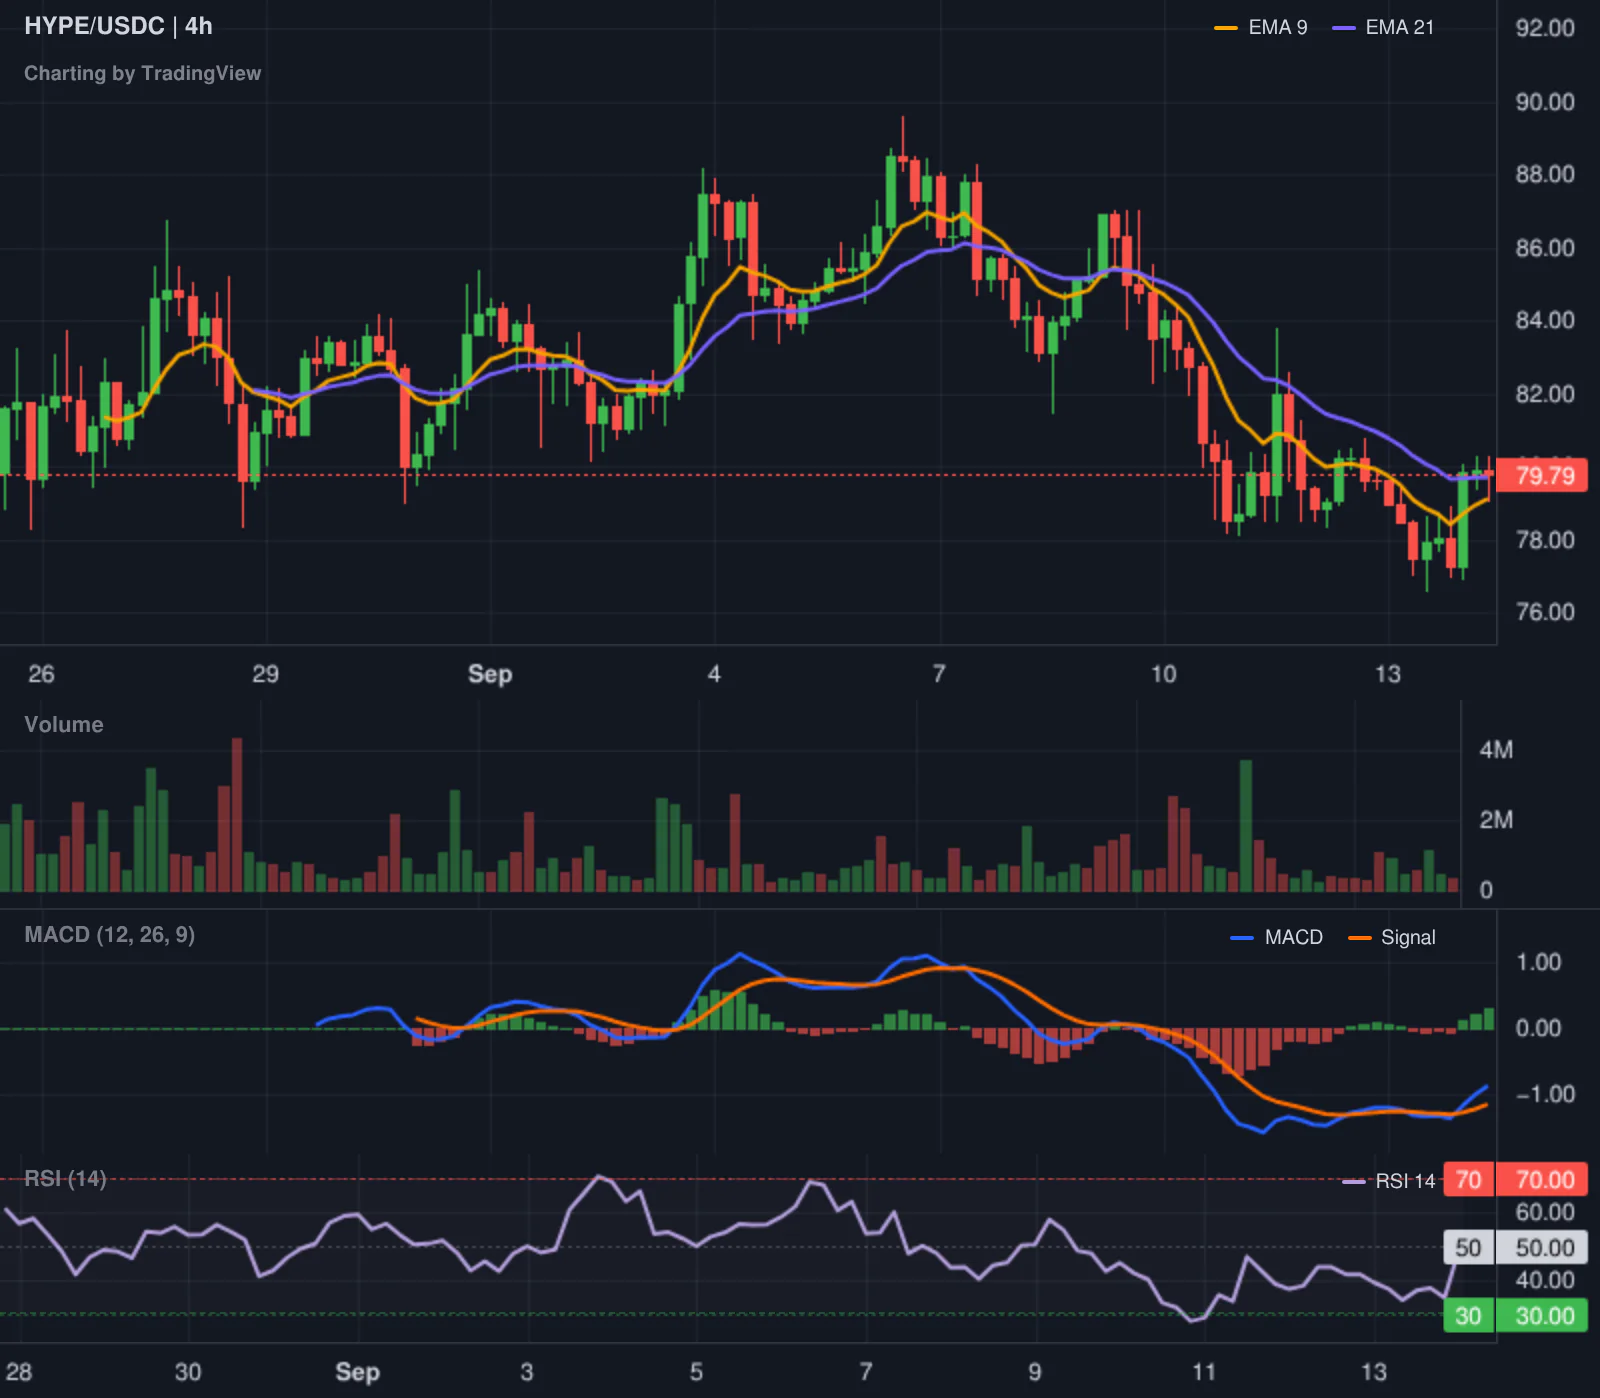
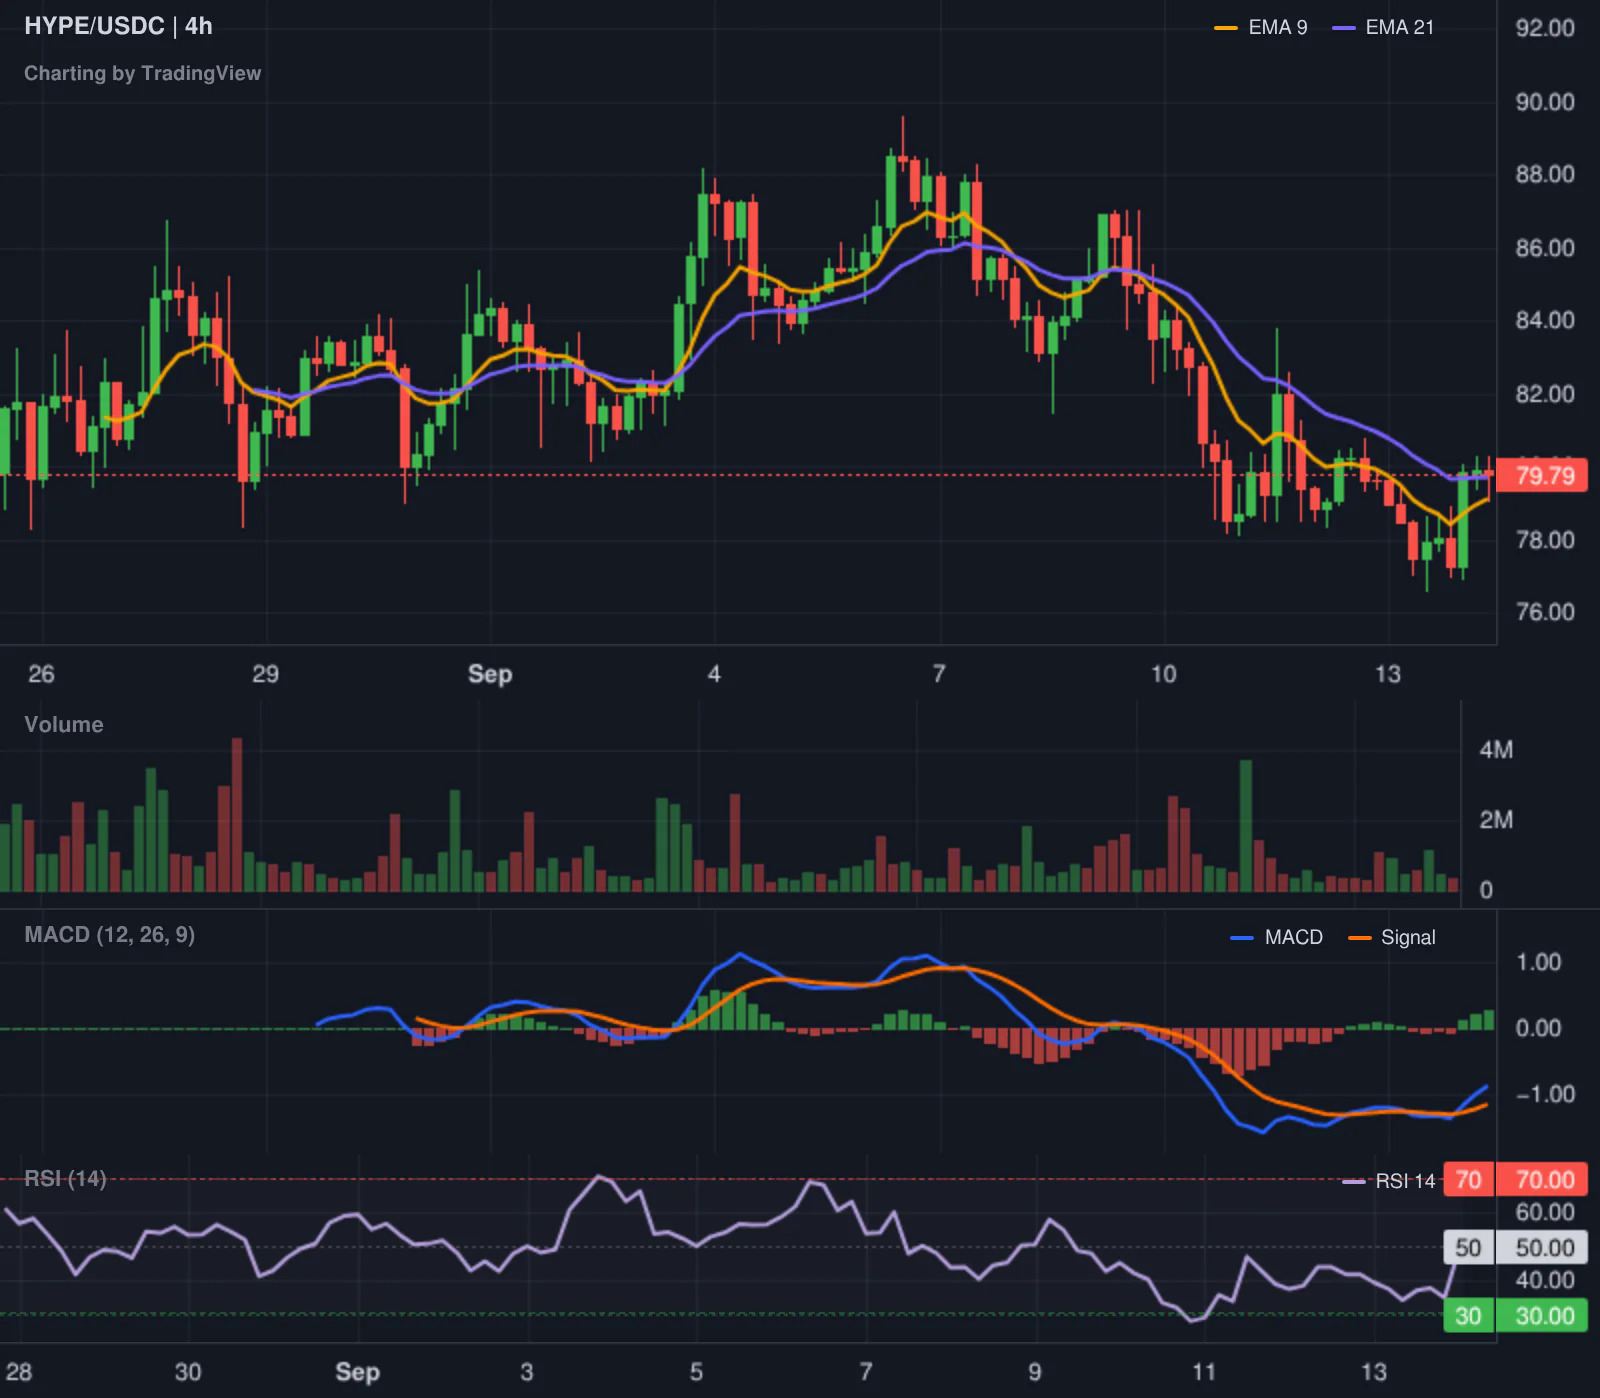
The only notable outlier among the majors is TRON, which managed a slight gain of 0.18% to $0.3214. In a market of extreme fear, the assets that hold their ground usually do so because they are perceived as "safe havens" or are tied to stablecoin utility that remains necessary even during a crash. Hyperliquid has been hit hard, dropping 7.14% to $66.49, reflecting the general volatility of high-beta ecosystem tokens when liquidity dries up.

News driving today's market

The primary driver of today's bearish sentiment is a coordinated regulatory push from the US Federal Reserve and Treasury. The agencies have proposed new rulemaking under the GENIUS Act that would require stablecoin issuers to maintain customer identification programs similar to those used by regulated banks. For the crypto market, stablecoins are the primary source of liquidity. Adding bank-grade KYC requirements to these issuers introduces significant operational friction and threatens the anonymity and speed that make DeFi attractive. We previously covered Bittensor for more background.

Parallel to this, the introduction of the CLARITY Act (the Digital Asset Market Clarity Act) signals that the US is finally attempting to build a comprehensive federal framework for digital assets. While long-term clarity is usually bullish, the process of getting there is often messy and filled with uncertainty, which traders hate.

On the institutional side, there is a curious mix of signals. Franklin Templeton has proposed a "Bitcoin DRIP" ETF that would funnel stock dividends into Bitcoin. This is a clever way to create a permanent, automated bid for the asset. We also saw news that Alchemy's AI-driven identity service now has access to the Visa network, allowing AI agents to make purchases. This is a genuine step toward "agentic commerce," though it does little to stop the current price bleed.

We previously covered the SOL ETFs filing news, and the latest Morgan Stanley amendments confirm that the institutional appetite for Solana and Ethereum remains intact even as the Fear & Greed Index hits rock bottom.

Social intelligence

The social mood is a mix of macro anxiety and technical post-mortems. On the macro front, the CME FedWatch tool shows a 40.6% chance of a rate hike at the July 29 meeting. In a world of extreme fear, the prospect of higher borrowing costs is a heavy weight on risk assets.

The derivatives market is also providing a cautionary tale. The CEO of Strive, Cole Macro, described today as the most difficult day in Digital Credit's history. He attributed the sharp drops in STRC and SATA to a leverage liquidation event rather than a failure in credit quality. This mirrors the broader market experience, where forced selling triggers a cascade that pushes prices far below their actual "fair value" for the day.

There is also a growing narrative around "agentic activity." Analysts like @ethereumJoseph suggest that a huge amount of AI agent activity will hit the chain by the end of the year. While this is a bullish long-term thesis, it is currently being drowned out by the immediate reality of $361M in liquidated longs.

Trading ideas worth watching

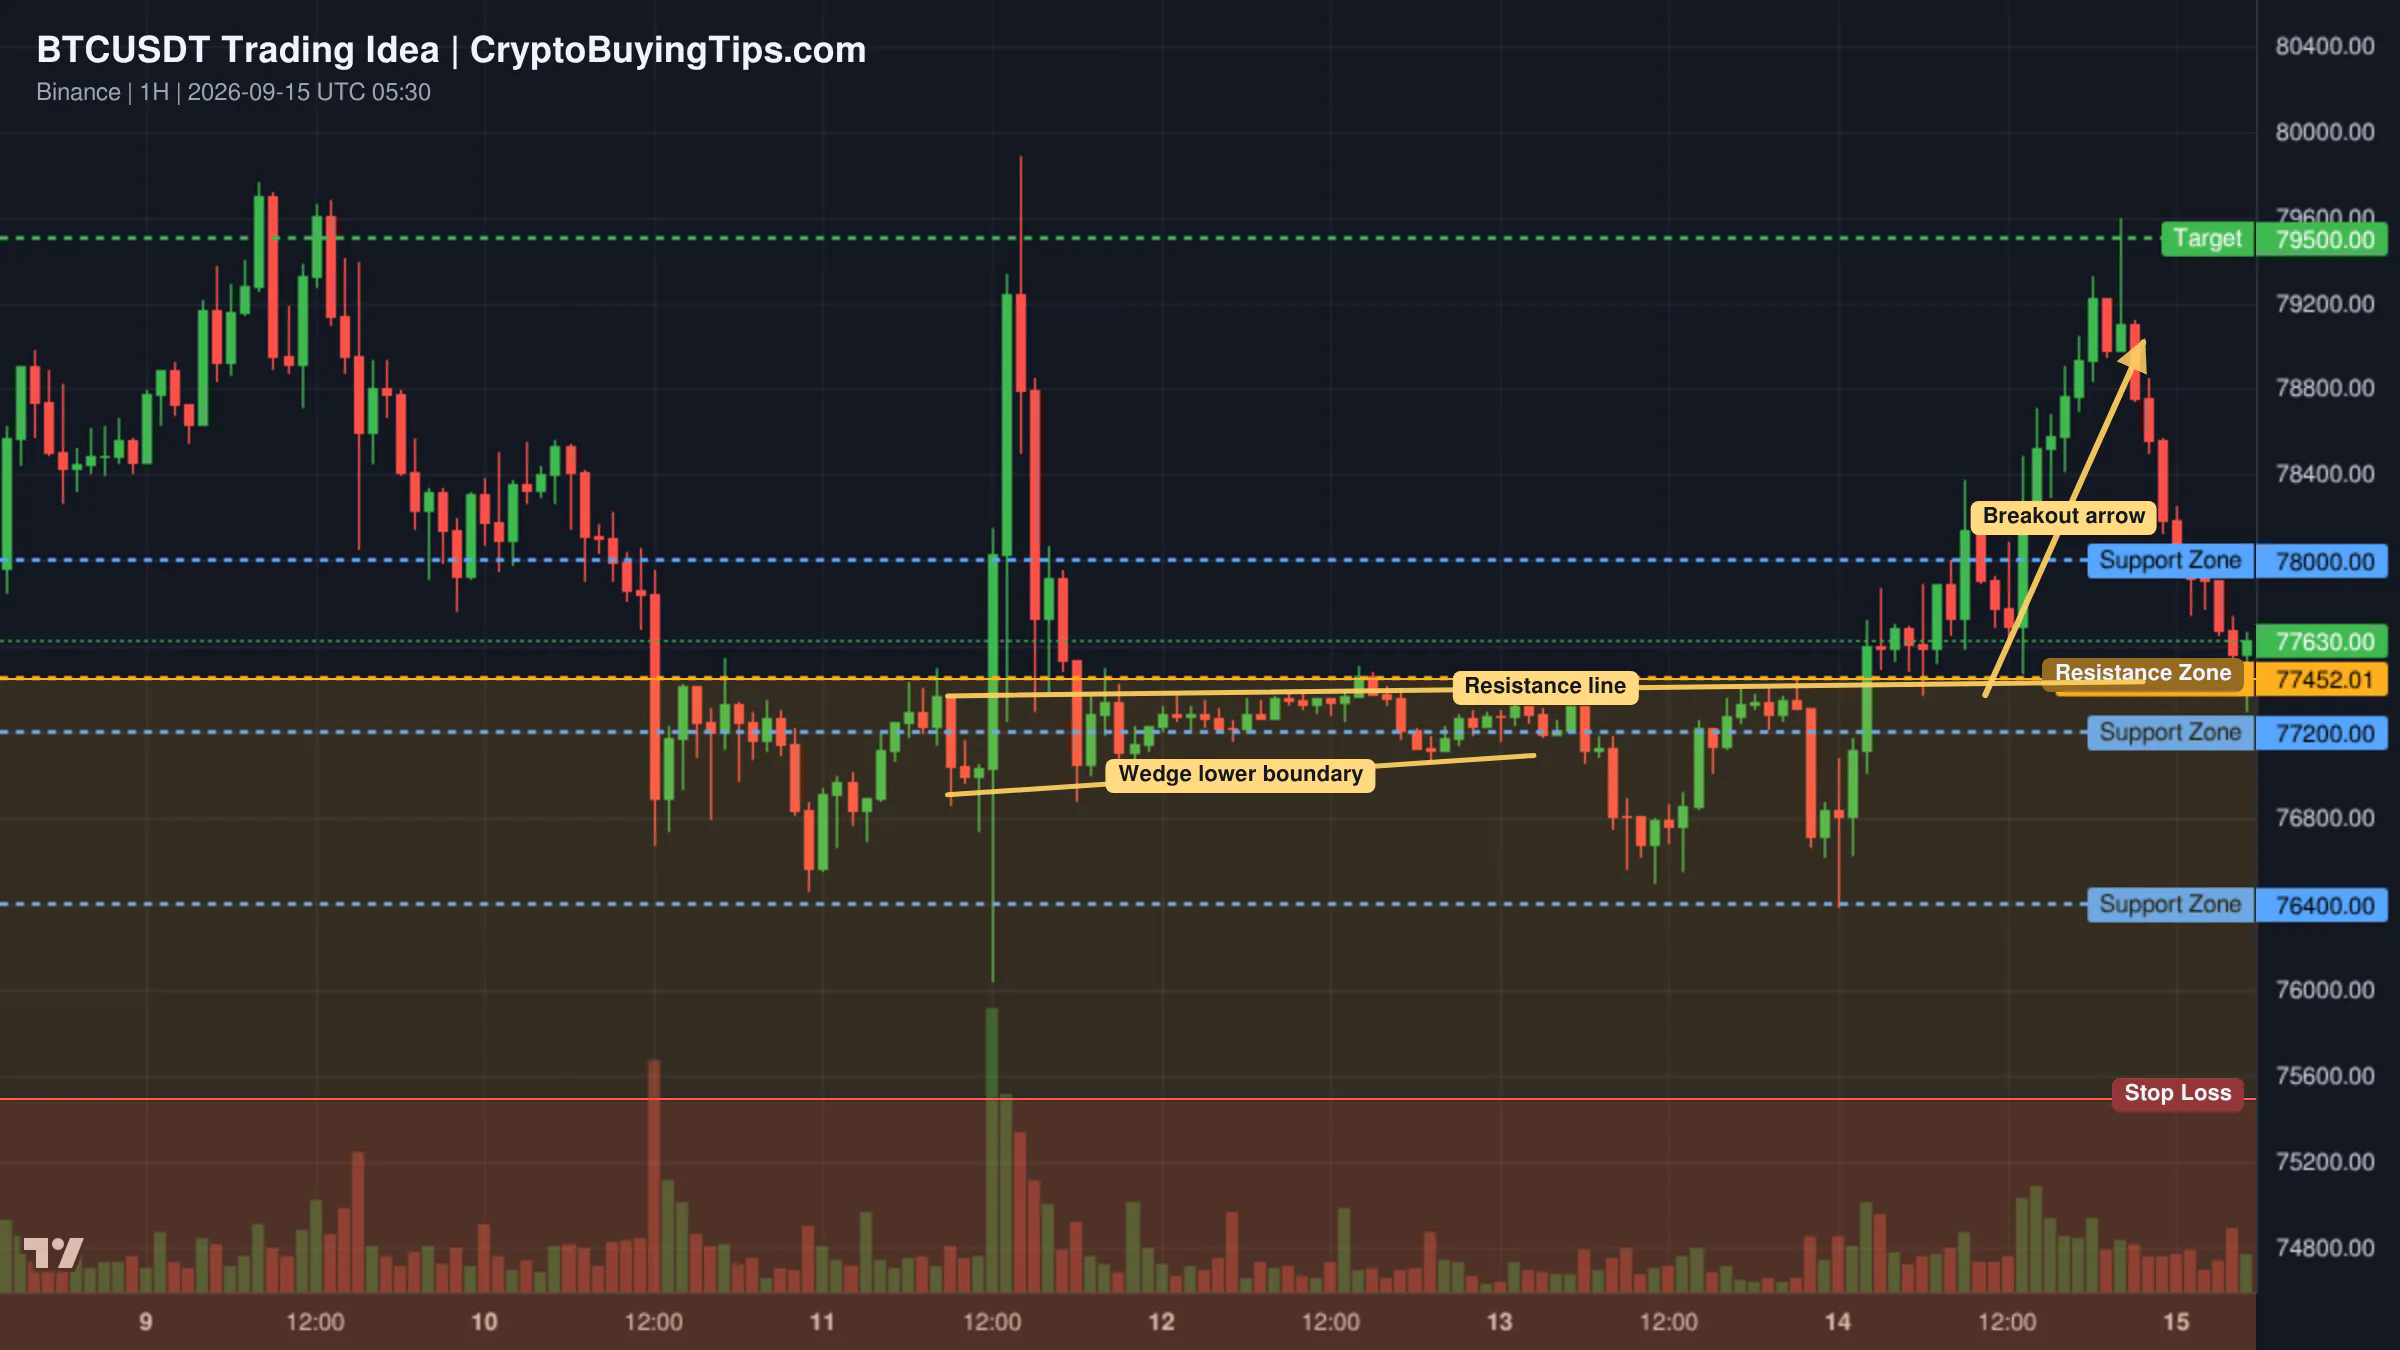
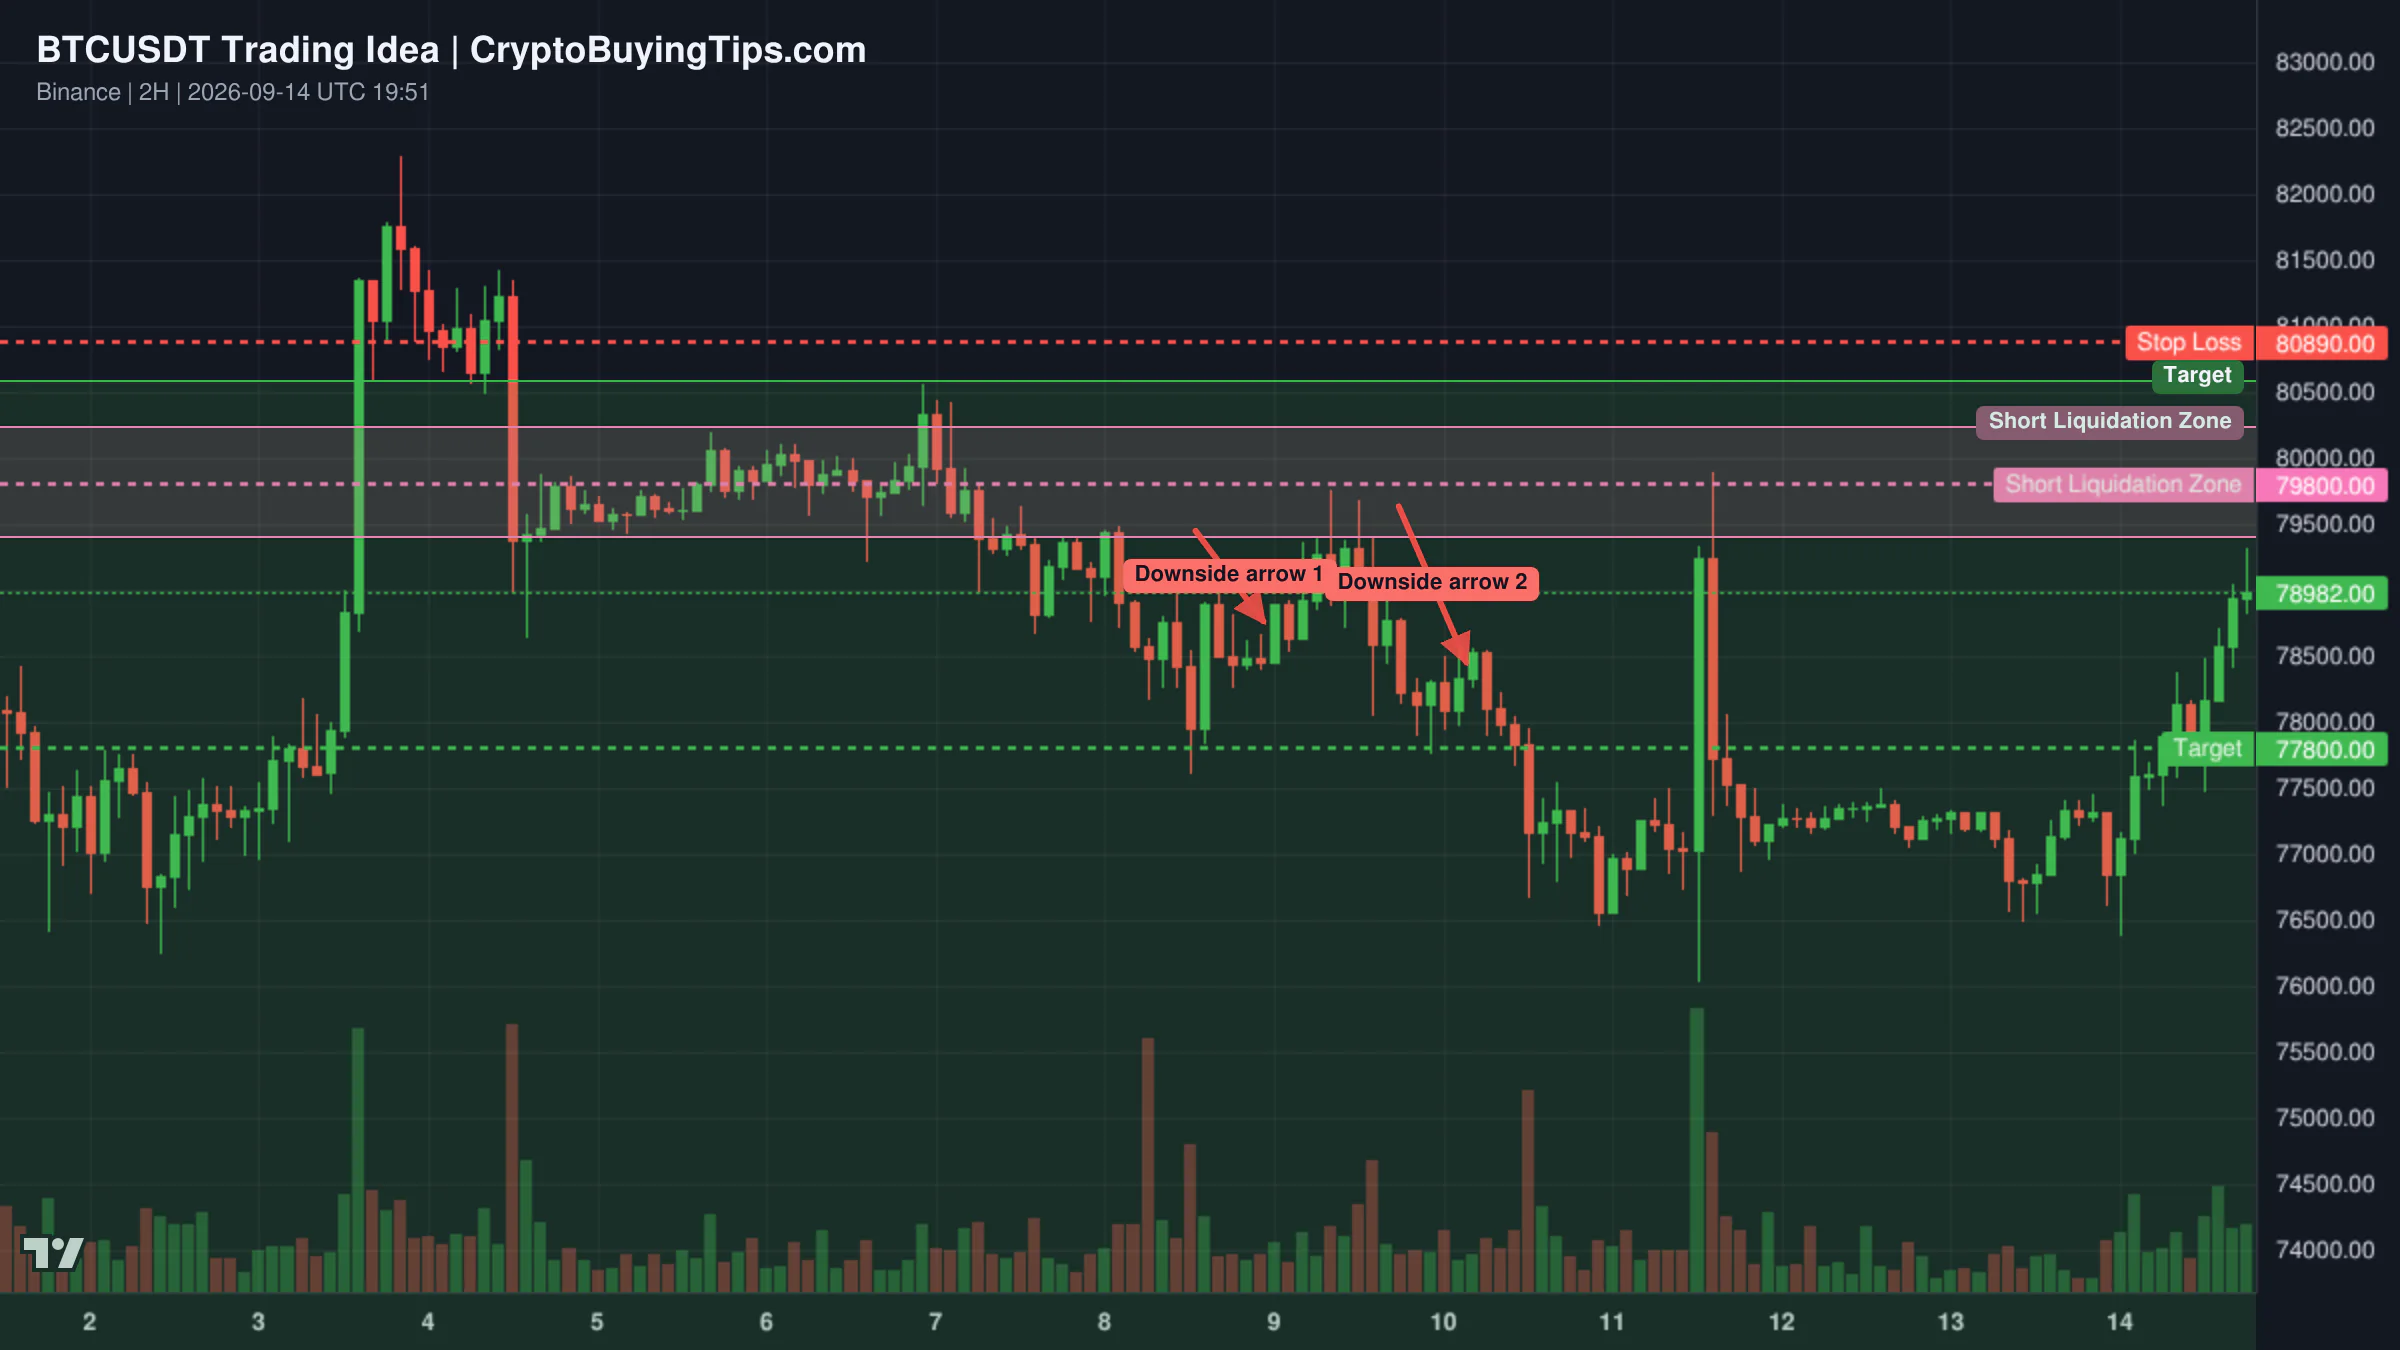
For Bitcoin, there is a strong case for a relief rally if the current support holds. Analysis suggests that BTC is currently sitting in a "Time Reversal Zone" (TRZ) between $63,720 and $64,770. From an Elliott Wave perspective, this could be the bottom of a corrective Wave 4. If the price can hold above the $62,887 stop-loss level, the first target for a bounce is $65,737, with a more ambitious target near $68,650 where short liquidations are clustered.

Redrawn BTCUSDT 30 trading idea chart for BTC/USDT: Descending Trendline Break Could Trigger a RecoveryRedrawn BTCUSDT 240 trading idea chart for Bitcoin Near TRZ and Support _ A Rebound Be Loading

Another perspective on BTCUSDT focuses on a descending trendline. The price has defended the $63,700-$63,800 zone multiple times. A decisive break above the local descending trendline would shift the short-term momentum back to the bulls and likely trigger a move toward the 100-period SMA near $65,300. Until that breakout happens, the structure remains cautious.

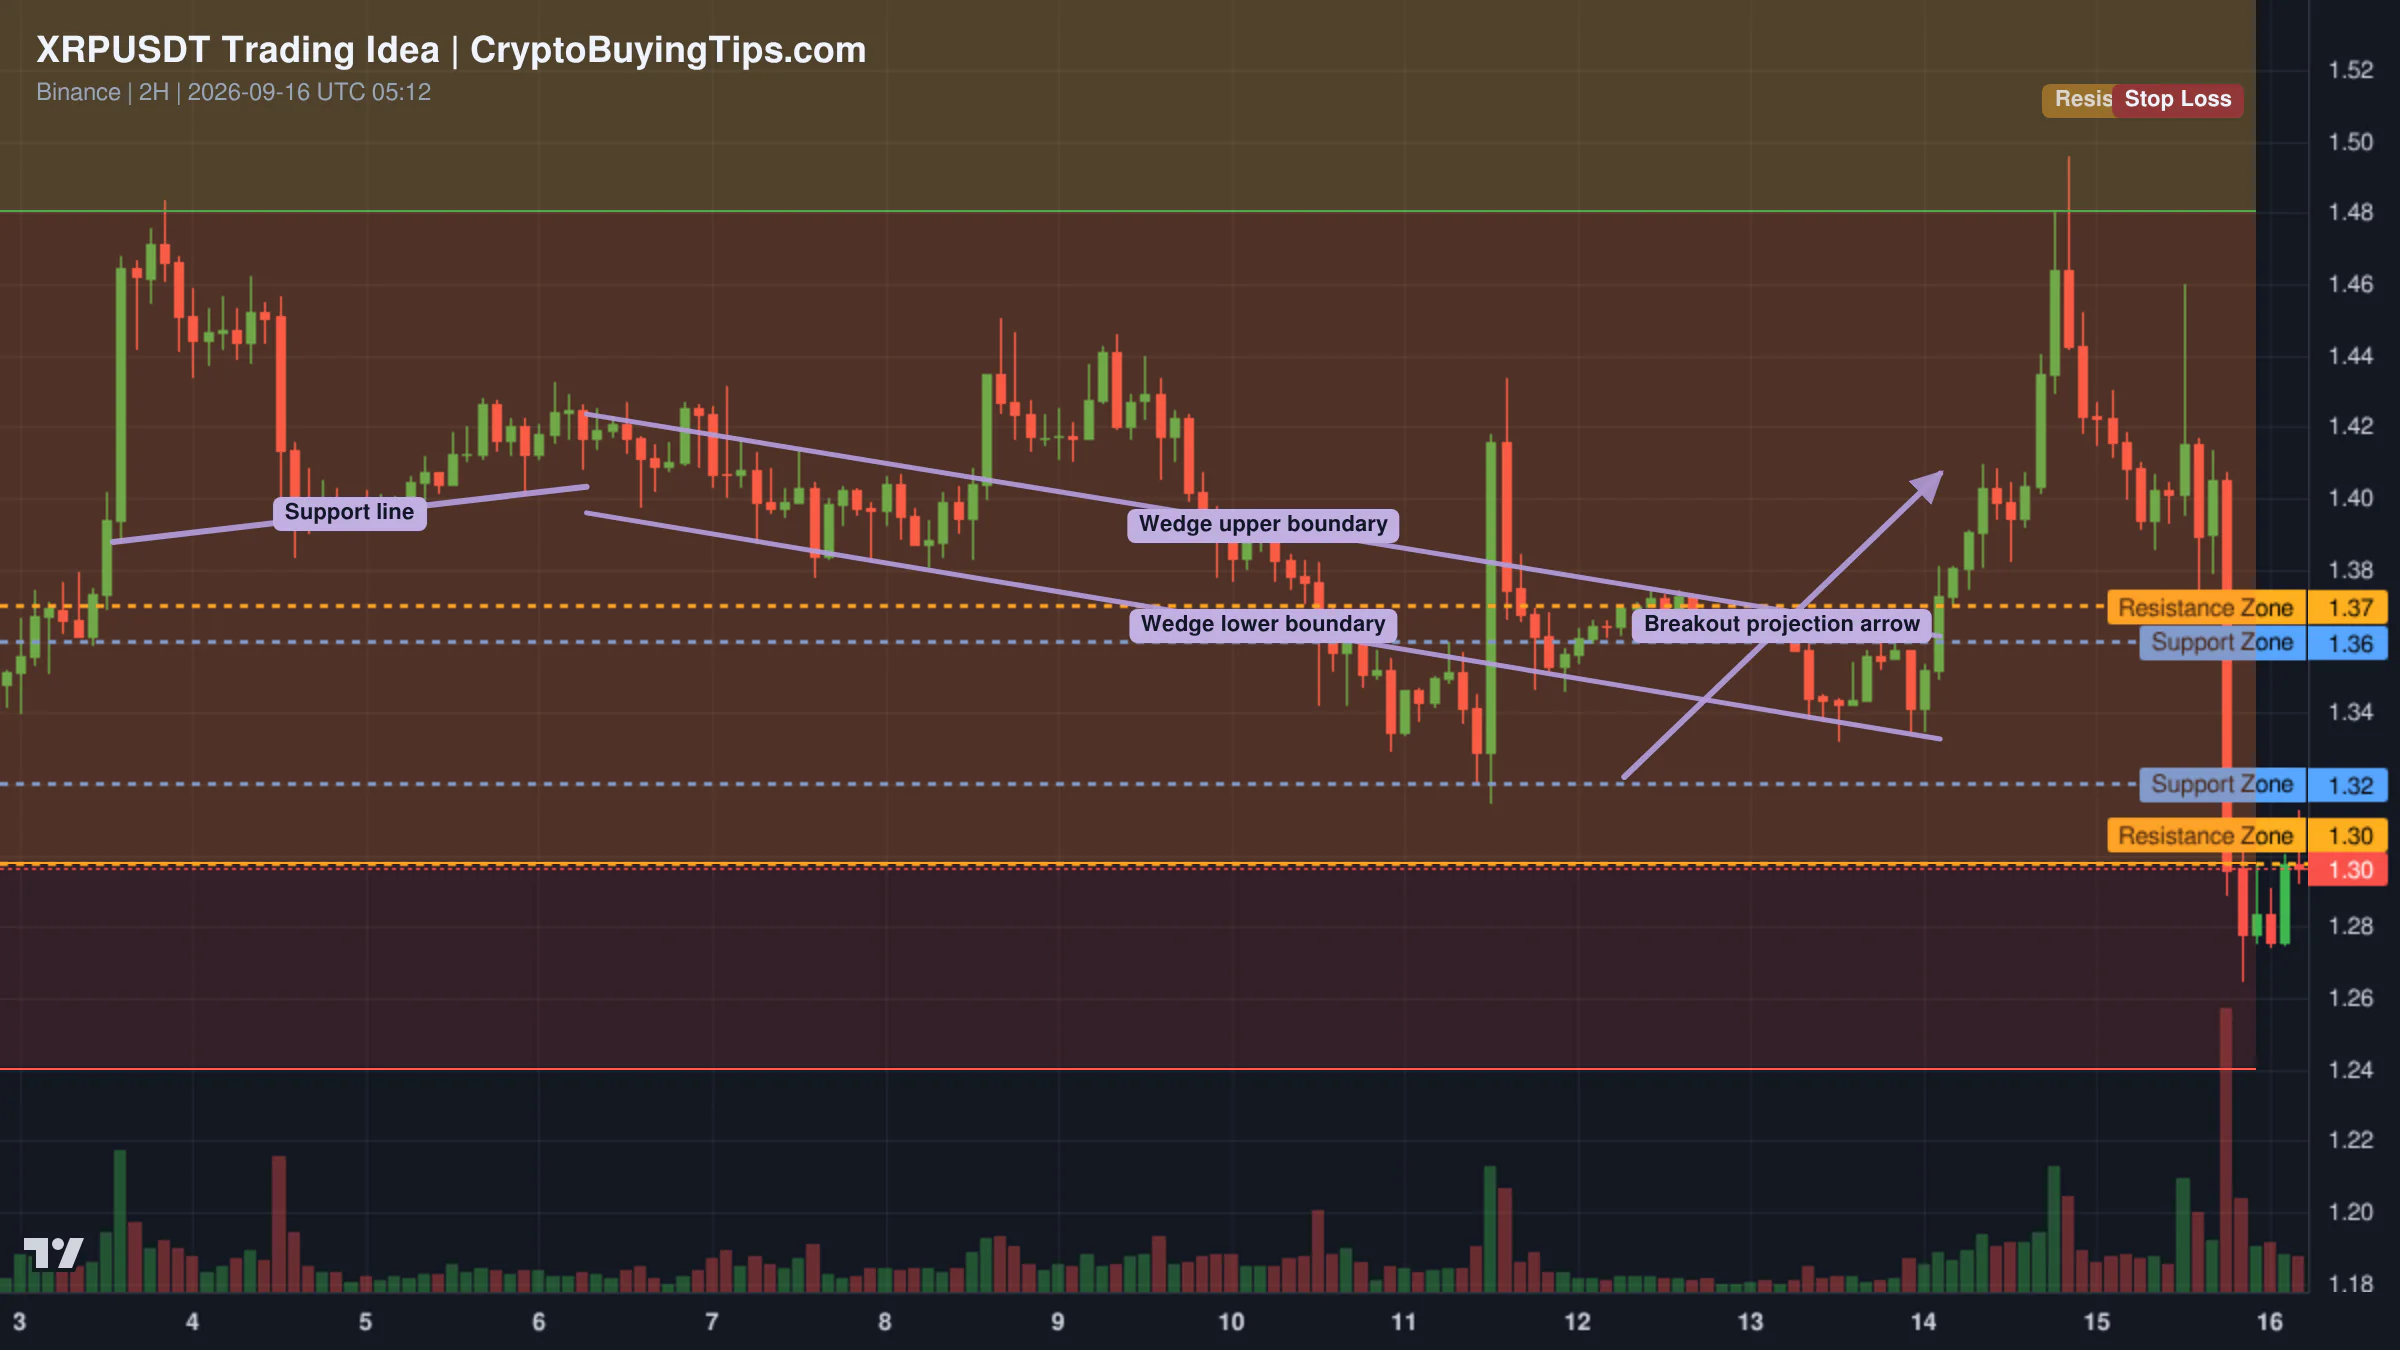
For XRP, the focus is on a "blue wedge" pattern. The asset is currently retesting the lower bound of this wedge, which coincides with a strong demand zone. As long as this intersection holds, the broader structure remains bullish. However, a confirmed recovery requires a break above the red channel to signal that the correction phase has ended and the next impulse move is beginning.

Smart Money Signals — Hyperliquid Leaderboard
Hyperliquid LONG HYPE leaderboard chart

Our tracker has flagged a high-confidence move from trader kko, who has a 115% 30-day ROI. kko has opened a long position in HYPE at an entry price of $69, with a notional value of $76,741. Given that HYPE has dropped over 7% today, this is a classic "buy the blood" play from a trader who has consistently outperformed the market.

What to watch next

The immediate focus is on the $63,000 level for Bitcoin. If the market can stabilize here, the extreme fear reading (19) may actually act as a contrarian indicator for a sharp bounce. However, the regulatory pressure on stablecoins is the real "black swan" to watch. If the Fed's proposed KYC rules lead to a significant exodus of liquidity from USDT or USDC, the price floors we are currently watching will not matter.

Keep an eye on the July 29 Fed meeting probabilities. If the chance of a rate hike climbs higher, the "risk-off" sentiment will likely persist regardless of how many ETFs Morgan Stanley files. For now, the market is in a state of paralysis, waiting to see if the institutional bid is strong enough to absorb the retail panic.

Crypto Market Overview | fear dominates as derivatives volume surges amid regulatory headwinds | June 18, 2026
Sigrid Voss·

Crypto Market Overview | fear dominates as derivatives volume surges amid regulatory headwinds | June 18, 2026

Market overview

The crypto market is currently defined by a stark disconnect between price action and activity. While the total market cap has drifted lower to $2.29T, 24h volume has surged to $87.8B. This is not the kind of volume that suggests a healthy organic rally. Instead, we are seeing a massive derivatives dominance, with perpetuals and futures volume at roughly $872B, completely dwarfing the $84B in spot trading.

Sentiment is bleak. The Fear and Greed Index has plummeted to 21, placing the market firmly in the "Fear" zone. This level of pessimism often acts as a contrarian signal, but the immediate data is less comforting. We are seeing a volume and price divergence where the market cap is declining while volume spikes, which usually points to aggressive selling or a violent repositioning of leveraged bets.

Dominance metrics show Bitcoin maintaining a strong grip at 56.05%, while Ethereum sits at 9.19%. Stablecoin dominance (USDT and USDC) is at 11.40%. When stablecoin dominance rises during a price drop, it suggests capital is moving to the sidelines rather than rotating into other assets. The macro backdrop provides little relief, with the S&P 500 and NASDAQ both trading down over 1%, confirming a broader risk-off mood across traditional finance.

Bitcoin and Ethereum

Bitcoin is currently trading at $64,109.93, down 1.01% over the last 24 hours. The asset is struggling to find a firm floor as it retests broken resistance levels that have recently turned into support. While some analysts argue the current correction is a necessary process of build-up before a move toward $100,000, the immediate reality is a market that feels heavy.

Ethereum is in a more precarious position, priced at $1,749.52 and down 1.14%. The most telling metric here is the network state. Gas fees are extremely low, ranging between 0.11 and 0.28 Gwei. This indicates a significant drop in on-chain demand and congestion. It is difficult to build a bullish case for ETH when the network is this quiet.

The divergence in sentiment is also appearing in exchange data. Recent reports from Binance show user holdings of BTC and ETH have actually risen, with BTC holdings up 4.26% and ETH up 10.17% since May. However, this accumulation is not translating into price strength, suggesting that holders are simply weathering the storm rather than aggressively buying the dip.

Top crypto prices

The broader market is feeling the weight of the current regime. BNB has fallen 1.93% to $589.88, and XRP is down 2.41% at $1.16. Solana has slipped 1.61% to $71.11, despite some fundamentally positive news regarding institutional credit ratings.

A rare bright spot is TRON, which managed a modest gain of 0.45% to trade at $0.3209. Hyperliquid is also holding relatively steady compared to the majors, down only 0.70% at $71.71.

News driving today's market

The news cycle is a mixed bag of institutional validation and regulatory friction. On the positive side, Moody’s is expanding its credit ratings system to Solana, allowing tokenized bond issuers to embed ratings directly on-chain. This is a significant step for the Real World Asset (RWA) narrative. We previously covered how tokenized stocks for investors could accelerate institutional adoption, and Moody's entry provides the necessary credit infrastructure to make that a reality.

However, the "everything app" hype is meeting a reality check. While firms like BlackRock continue to push tokenization, we previously noted that the tokenizing stocks trap often involves centralized receipts rather than true decentralization.

Regulatory pressure is mounting in the US. Illinois has signed a 0.2% crypto transaction tax, which critics call one of the most punitive laws in the country. Simultaneously, Kentucky has sued prediction markets like Polymarket and Kalshi. These moves signal a shift toward state-level aggression when federal clarity remains elusive.

Perhaps the most understated but systemic risk is coming from France. The cybersecurity agency ANSSI will stop certifying security products that lack quantum-resistant encryption starting in 2027. While this is a long-term horizon, it forces the industry to acknowledge that the cryptography securing Bitcoin and Ethereum has an expiration date.

Social intelligence

On-chain data reveals some institutional discomfort. A whale recently deposited over 43,000 ETH into Binance, incurring a loss of over $11 million in the process. When whales move large sums to exchanges during a downturn, it usually suggests a desire for liquidity or a hedge against further drops.

There is also a notable divergence in how different participants are pricing the market. Data suggests that Binance funding rates are running significantly below the three-exchange median. This indicates that institutional "smart money" is pricing the market bearishly, while retail traders are continuing to buy the dip. This is a classic setup for a "bull trap" where retail optimism is absorbed by institutional selling.

Trading ideas worth watching

For Bitcoin, there is a bullish setup based on the retest of broken resistance. The price has fallen back to the $64,000 zone, which now needs to act as support. If buyers step in here, targets are set at $65,800 and $68,000. The risk is time. If BTC lingers in this zone for too long without a bounce, the bullish structure fails.

Redrawn BTCUSDT 240 trading idea chart for BTC Retests Broken Resistance, Bulls Eye Higher PricesTrading idea chart: BTCUSD - BITCOIN The CVDD marked perfectly the last Cycle Bottoms.

A more long-term view utilizes the Cumulative Value Days Destroyed (CVDD) indicator. This model suggests that if the current bear cycle follows previous one-year patterns, a bottom could be priced around October 5, 2026, with a minimum target of $48,500. It is a grim projection, but it provides a mathematical floor for those not blinded by the $100k narratives.

Smart Money Signals — Hyperliquid Leaderboard

Hyperliquid LONG HYPE leaderboard chart

Our tracking of the Hyperliquid leaderboard shows a high-confidence long position in HYPE. Trader 0xffe4e3, who boasts an all-time PnL of $1.06M and a 230.7% ROI, opened a long at $59.182 with a notional value of approximately $53,900. Given the trader's track record and the relatively stable price action of HYPE compared to the majors, this suggests a conviction play on the protocol's underlying growth rather than a momentum trade.

What to watch next

The immediate focus is on the $64,000 level for Bitcoin. If this support fails, the market may accelerate toward the "Extreme Fear" levels that often precede a genuine bottom. We also need to monitor the stablecoin dominance; if it continues to climb, it confirms that traders are not just rotating, but exiting.

Keep an eye on the US state-level regulatory news. The Illinois tax is a potential blueprint for other states looking to plug budget holes. Finally, watch the ETH gas fees. Until we see a spike in on-chain activity, Ethereum remains a ghost town, regardless of what the price charts suggest.

Crypto Market Overview | high fear and volume collapse amid regulatory clashes | June 17, 2026
Sigrid Voss·

Crypto Market Overview | high fear and volume collapse amid regulatory clashes | June 17, 2026

Market overview

The crypto market is currently in a state of significant distress, with the total market cap sitting at $2.23T after a 2.12% decline. Sentiment has soured quickly, as evidenced by a Fear and Greed Index score of 23, placing the market firmly in the Fear category. This price action is accompanied by a worrying collapse in activity; 24-hour spot volume has dropped by 22.90% to $71.75B. When prices fall and volume vanishes, it usually suggests that buyers are not stepping in to find a floor, but are instead waiting for a catalyst or a deeper flush.

The most glaring disconnect remains the scale of derivatives. With $713.27B in derivatives volume, the leverage market is nearly ten times larger than the spot market. This suggests that the current price movement is being driven by forced liquidations and hedging rather than organic accumulation. While Bitcoin dominance remains high at 58.24%, the Altcoin Season Index is currently neutral, hovering around 47. This means capital is not rotating into alts, nor is it aggressively fleeing to the safety of the king. It is simply frozen.

Macro headwinds are adding to the gloom. The S&P 500 is down 0.60% and the NASDAQ has slipped 1.90%, indicating a broader risk-off mood in traditional finance. The correlation between tech stocks and crypto remains tight, and the current dip in the QQQ is acting as a drag on sentiment across the board.

Bitcoin and Ethereum

Bitcoin is trading at $64,731.7, down 2.66% over the last 24 hours. The asset is struggling to maintain momentum as the market digests a mix of institutional optimism and regulatory friction. On one hand, BlackRock has introduced a novel BITA ETF that trades some upside for double-digit yield, which shows that the biggest player in finance is still finding ways to monetize the asset. On the other hand, the broader market is spooked by the lack of immediate bid-side depth.

Ethereum is in a more precarious position, priced at $1,767.77 and down 1.54%. The most telling metric here is the network state. Gas fees are exceptionally low, with fast transactions costing only 0.16 Gwei. This is an eerie level of quiet for a network that usually thrives on activity. It suggests that on-chain engagement has plummeted, leaving the price to be dictated almost entirely by exchange order books and derivatives positioning.

Top crypto prices

The general trend across the top assets is one of retreat. BNB has fallen 2.00% to $601.53, while XRP and Solana have been hit harder, dropping 3.55% and 3.57% respectively. Hyperliquid (HYPE) has seen a 4.25% decline to $72.23, reflecting the broader volatility in the derivatives-focused sector.

Interestingly, TRON (TRX) is the lone outlier among the top assets, posting a modest gain of 0.59% to $0.3195. In a market defined by fear, assets that provide consistent utility or perceived stability often become temporary shelters.

News driving today's market

The primary driver today is a sharp divide between legislative wins in the US and regulatory threats in Europe. A bipartisan deal on a US housing bill has included a ban on the Federal Reserve creating a central bank digital currency (CBDC) until 2030. This is a significant de-risking event for decentralized assets, as it removes the immediate threat of a state-controlled digital dollar competing with private stablecoins and Bitcoin. We previously covered volume data suggests fight for more background.

However, the mood is dampened by reports that Binance may be forced to halt services for EU clients next month. With the MiCA deadline of July 1 approaching, the possibility that a major exchange will lose its license creates immediate operational risk and fears of liquidity fragmentation. While BitGo is attempting to offer a compliance lifeline to other European firms, the potential exit of the world's largest exchange from a major economic zone is a heavy weight on the tape.

We are also seeing a push toward the "everything app" model, with Coinbase announcing plans to launch tokenized stock trading and an AI-powered advisor. While the prospect of 1:1 backed stocks on-chain is theoretically bullish, we previously covered how the tokenizing stocks trap can often result in centralized receipts rather than true decentralization. The current volume drop suggests the market is not yet convinced that these features will drive genuine network utility.

Social intelligence

The social mood is a mix of cynical realism and a desperate search for alpha. On X, the narrative is centered on the irony of the Federal Reserve injecting over $6.6 billion into the economy while the dollar continues its slow decline. There is a palpable sense that while the "gatekeepers" are being regulated, the underlying assets remain sovereign.

We are seeing a recurring theme regarding the fragility of AI-driven trading. As platforms like Neyro network push non-custodial AI tools, the community response remains skeptical, with a preference for cold wallets and a "nap" over trusting an algorithm with private keys. The overarching sentiment is that in a market of endless experiments, Bitcoin is the only thing that isn't a beta test.

Trading ideas worth watching

On the Bitcoin front, the focus is on risk management rather than direction. A prominent setup emphasizes the 2% rule, arguing that no single trade should ever risk more than 2% of the total account equity. In the current high-fear environment, this is a necessary discipline. When volatility spikes and the bid-side is thin, forcing position size to chase small account gains is the fastest way to reach a zero balance.

Redrawn BTCUSD 240 trading idea chart for  Why We Rarely Risk More Than 2% Per Trade

For Ethereum, there is a bullish case based on a contracting triangle pattern that has formed since early June. The analysis suggests a consolidation phase before a potential move toward targets of $1,900 and $2,000. However, this is contingent on the market absorbing the current FOMC meeting volatility and the upcoming US-Iran deal news.

Redrawn ETHUSDT 240 trading idea chart for Ethereum Consolidates Before Its Next Upward Leg

Celestia (TIA) is being flagged as a long-term hold. The asset is currently trading at the bottom of its range, close to all-time lows. The thesis here is a "bottom consolidation" play, similar to the move seen in Worldcoin (WLD) before its breakout. The strategy is simple: buy the blood and hold until the market turns green, though this requires a high tolerance for the current bearish trend.

Smart Money Signals — Hyperliquid Leaderboard

Hyperliquid LONG HYPE leaderboard chart

Our tracker has flagged a high-confidence long position in Hyperliquid (HYPE). A trader with an all-time PnL of $1.06M and a 230.7% ROI opened a long at $59.182 with a notional value of $53,908. Given that HYPE has fallen 4.25% today, this entry suggests that top-tier traders are viewing the current dip as a buying opportunity rather than a signal to exit.

What to watch next

The next few days will be defined by the tension between US legislative clarity and EU regulatory crackdown. The June 23 vote on the housing bill will be the key date for the CBDC ban, which could provide the sentiment boost needed to break the current paralysis.

More immediate is the July 1 MiCA deadline. If Binance is indeed forced to restrict EU services, we expect a surge in volatility as users migrate funds to other platforms. Watch for a spike in stablecoin dominance; if capital continues to move into USDT and USDC, the current fear will likely deepen into a more prolonged correction. Until spot volume returns to normal levels, any rally should be viewed as a relief bounce rather than a trend reversal.