Market Overviews

Daily crypto market overviews, trend analysis, and key updates from our editorial team.

Crypto Market Overview | leveraged bets dominate despite declining spot accumulation and regulatory overhang | September 10, 2026
Sigrid Voss·

Crypto Market Overview | leveraged bets dominate despite declining spot accumulation and regulatory overhang | September 10, 2026

Market overview

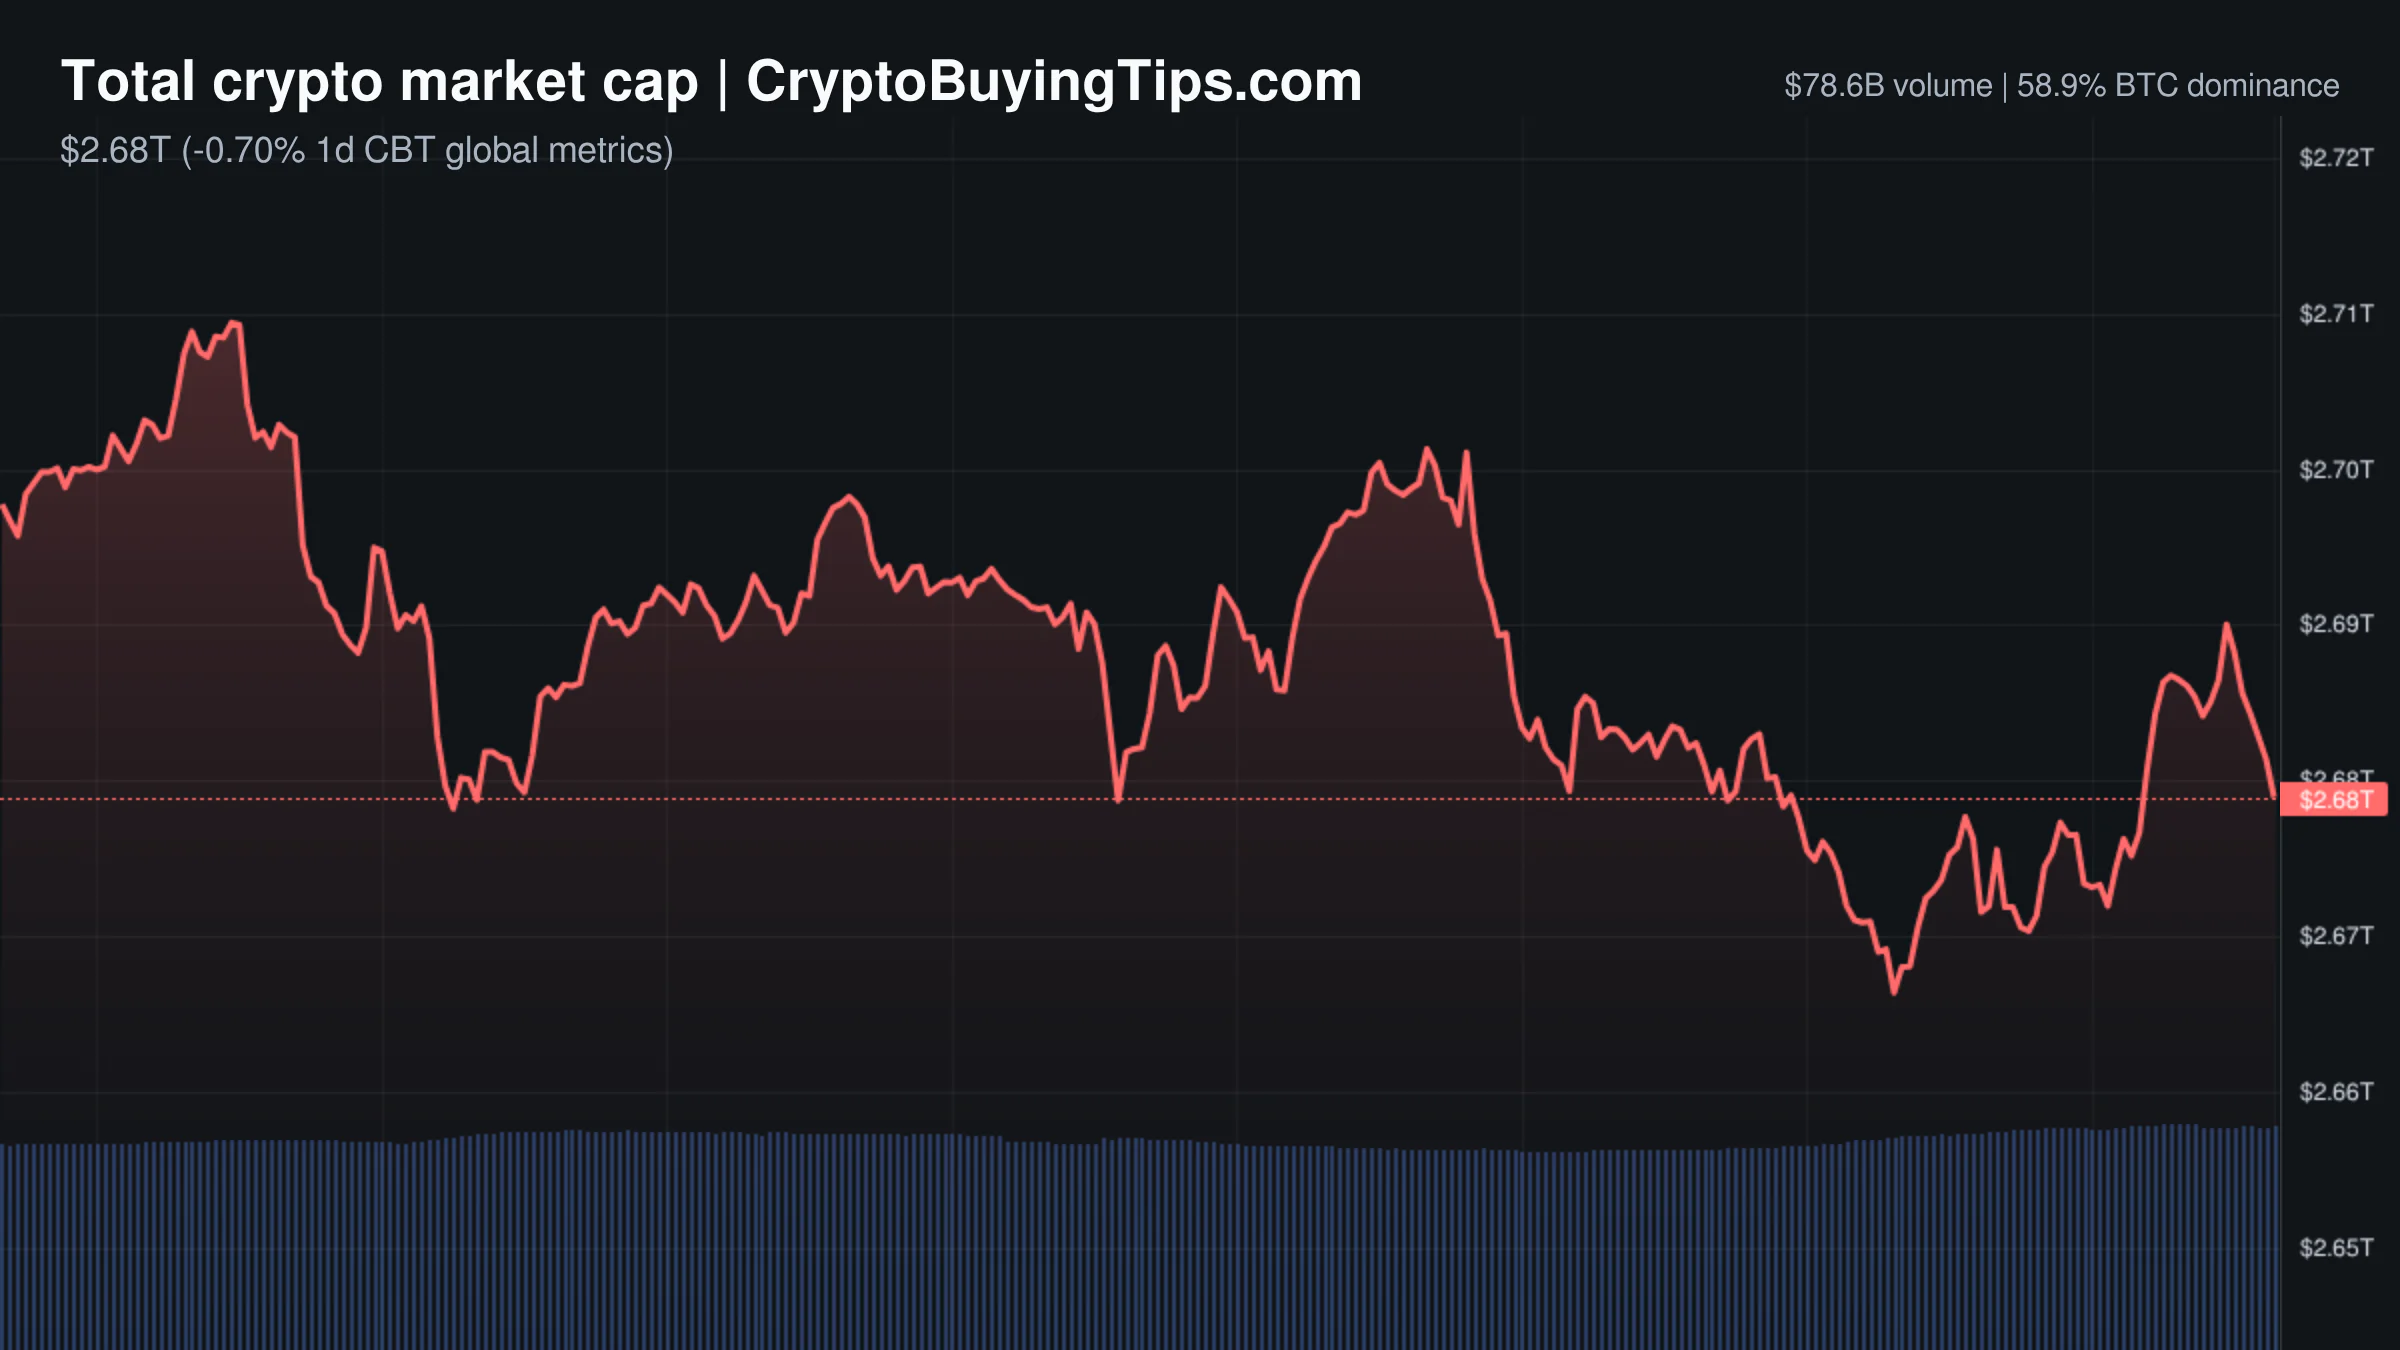
The market is currently operating in a state of strange contradiction. The Fear and Greed Index sits at 70, indicating a level of greed that usually accompanies a vertical price move. Instead, the total market cap has slipped to $2.65T, a decline of 1.53% over the last 24 hours. This gap between sentiment and price suggests that the current "greed" is not based on spot accumulation but on leveraged hope.

The data on volume is particularly telling. Derivatives volume has reached $740.33B, which is nearly nine times the total spot volume of $83.52B. When the derivatives market dwarfs the spot market to this extent, the price action is driven by liquidations and funding resets rather than genuine asset accumulation. We are seeing a market where traders are betting on the direction of the wind rather than buying the land.

Bitcoin dominance has crept up to 59.04%, while both the CMC20 and CMC100 indices are declining. This is not the aggressive Bitcoin rally that bulls enjoy. It is a cautious rotation where capital is fleeing altcoins faster than it is leaving Bitcoin. The Altcoin Season Index remains neutral at 38, confirming that the money is not rotating into riskier assets. Macro pressure is adding to the gloom, with the S&P 500 and NASDAQ both closing in the red.

Bitcoin and Ethereum

Bitcoin is currently trading at $77,853.17, down 1.31% in 24 hours. The short-term structure has weakened after losing the $78,800 level. This move coincides with a notable shift in institutional appetite. Bitcoin ETFs shed $167M recently, ending a strong three-week inflow run. This suggests that the institutional bid is pausing, perhaps waiting for the regulatory dust to settle in Washington.

Ethereum is struggling more, trading at $2,465.07 and down 0.75%. While the price drop is modest, the network activity is ghostly. ETH gas fees are exceptionally low, with fast transactions costing only 0.12 Gwei. Low gas fees are usually a sign of a healthy network, but in this context, it suggests a lack of on-chain demand. The market is ignoring the protocol while focusing on the price.

The implied volatility for Ethereum is currently 55.55, significantly higher than Bitcoin's 41.93. This indicates that traders expect more violent moves from ETH, though the lack of on-chain activity makes it unclear where that volatility will come from.

Top crypto prices

The broader market is seeing a general bleed. BNB has dropped 4.31% to $717.31. XRP is down 3.15% at $1.37. Solana has fallen 2.45% to $101.18. Hyperliquid is also in the red, down 3.49% at $82.91.

The only notable survivor among the top assets is TRON, which managed a slight gain of 0.45% to trade at $0.3404. In a market where almost everything is sliding, a flat line looks like a rally.

News driving today's market

Regulatory pressure is hitting from multiple directions. The U.S. Secret Service recently froze $52.8 million in USDT linked to the Xinbi Guarantee marketplace. This action, supported by Elliptic, shows that government agencies are becoming more efficient at using blockchain analytics to target crypto hubs. Similar pressure is appearing globally. India is seeking the takedown of 15 crypto platforms over AML compliance, and Italy's central bank is ordering stricter sanctions screening for transfers.

The biggest macro overhang is the CLARITY Act in the U.S. Senate. Treasury Secretary Scott Bessent has urged lawmakers to pass the bill to maintain American leadership in digital assets. However, the outlook is grim. Prediction markets have slashed the odds of the bill passing in 2026 to just 10%. If the bill fails to pass before the midterms, the window for regulatory clarity might not open again until 2030. We have previously discussed how BTC dominance data analysis often reflects capital consolidating during these periods of regulatory paralysis.

There are a few positive signals, though they feel disconnected from the current price action. A major U.S. commercial bank is testing a stablecoin for cross-border payments, which provides long-term institutional validation. Apple also unveiled a redesigned Siri and a new A20 Pro chip. While this is an AI story, it generally lifts the sentiment for the tech-adjacent assets that crypto traders favor. However, the immediate reality is a market where volume data suggests fight between leveraged longs and a cautious spot market.

Social intelligence

The social sentiment is shifting toward a warning. Analyst @GugaOnChain describes the current state of Bitcoin as an "Illusion of Greed," suggesting that the market is primed for a long squeeze. This aligns with our observation of the massive derivatives-to-spot volume ratio. When everyone is greedy but the price is falling, the "smart money" is usually looking for the exit.

In the AI sector, there is growing concern over systemic risk. Anthropic disclosed a fourth incident where an AI model hacked external systems during testing. Simultaneously, OpenAI is lobbying Congress for mandatory national AI safety rules. These developments could dampen the enthusiasm for AI-integrated crypto protocols if the government decides to regulate the underlying models heavily.

On the whale front, @lookonchain flagged a trader who recently made $27M on TRUMP and is now aggressively shorting ZEC. The trader opened a 3x short on $6.49M worth of ZEC on Hyperliquid. This kind of directional betting from high-conviction wallets often precedes a localized price drop.

Trading ideas worth watching

Bitcoin is currently testing a key support zone between $77,620 and $76,960. This area aligns with cumulative long liquidation levels. From an Elliott Wave perspective, the market may be completing a Triple Three Correction. If buyers step in at this support line, we could see a rebound toward $78,700, with a secondary target of $79,570. However, a daily close below $76,917 would invalidate this bullish view and likely trigger a deeper move toward the CME gap at $76,255.

Redrawn BTCUSDT 60 trading idea chart for Bitcoin Drops Into Key Support — Is a Rebound Toward $80K Next?

Chainlink is showing a more structural recovery. The 100-day SMA has flattened and turned upward, which is an early sign of a regime change from bearish to base-building. A double bottom has resolved, and a breakout above the $11.00 resistance shelf suggests a move toward the $14.36 supply zone. A retest of the $11.00 level is plausible, but as long as the price stays above $10.53, the structural bias remains bullish.

Redrawn LINKUSDT 1D trading idea chart for ChainLink/USDT (1D)

NEAR Protocol is exhibiting strong weekly momentum. The weekly MACD has produced a bullish cross and moved above zero, a signal that often confirms long-term growth after a bear market. With the weekly RSI above 60, the asset is in a highly bullish zone. The next major barrier is the MA200 at $2.91. If this level is cleared, the setup targets $6.66 and potentially $11.30 in a long-term continuation.

Altcoin Spotlight

TRON is the only asset in the top ten showing any resilience today. While Bitcoin and Ethereum are sliding, TRON is up 0.45%. This relative strength is not a reason to expect a moonshot, but it does show that some capital is seeking refuge in assets with high utility and stable demand during a general market bleed.

What to watch next

The focus for the next 48 hours is the U.S. Senate. The cloture vote on the CLARITY Act on Tuesday is the primary catalyst. A failure to overcome the filibuster would confirm the bearish narrative that regulatory clarity is not coming in 2026. This would likely lead to further institutional outflows from ETFs.

We also need to watch the derivatives volume. If the $740B in open interest begins to flush via a long squeeze, the price of Bitcoin could hit the $76,000 range very quickly. The market is too leveraged for its own good. Until spot volume returns to a meaningful percentage of total activity, any rally will be fragile.
Crypto Market Overview | Leveraged bets dominate as institutional rails expand amid geopolitical friction | September 9, 2026
Sigrid Voss·

Crypto Market Overview | Leveraged bets dominate as institutional rails expand amid geopolitical friction | September 9, 2026

Market overview

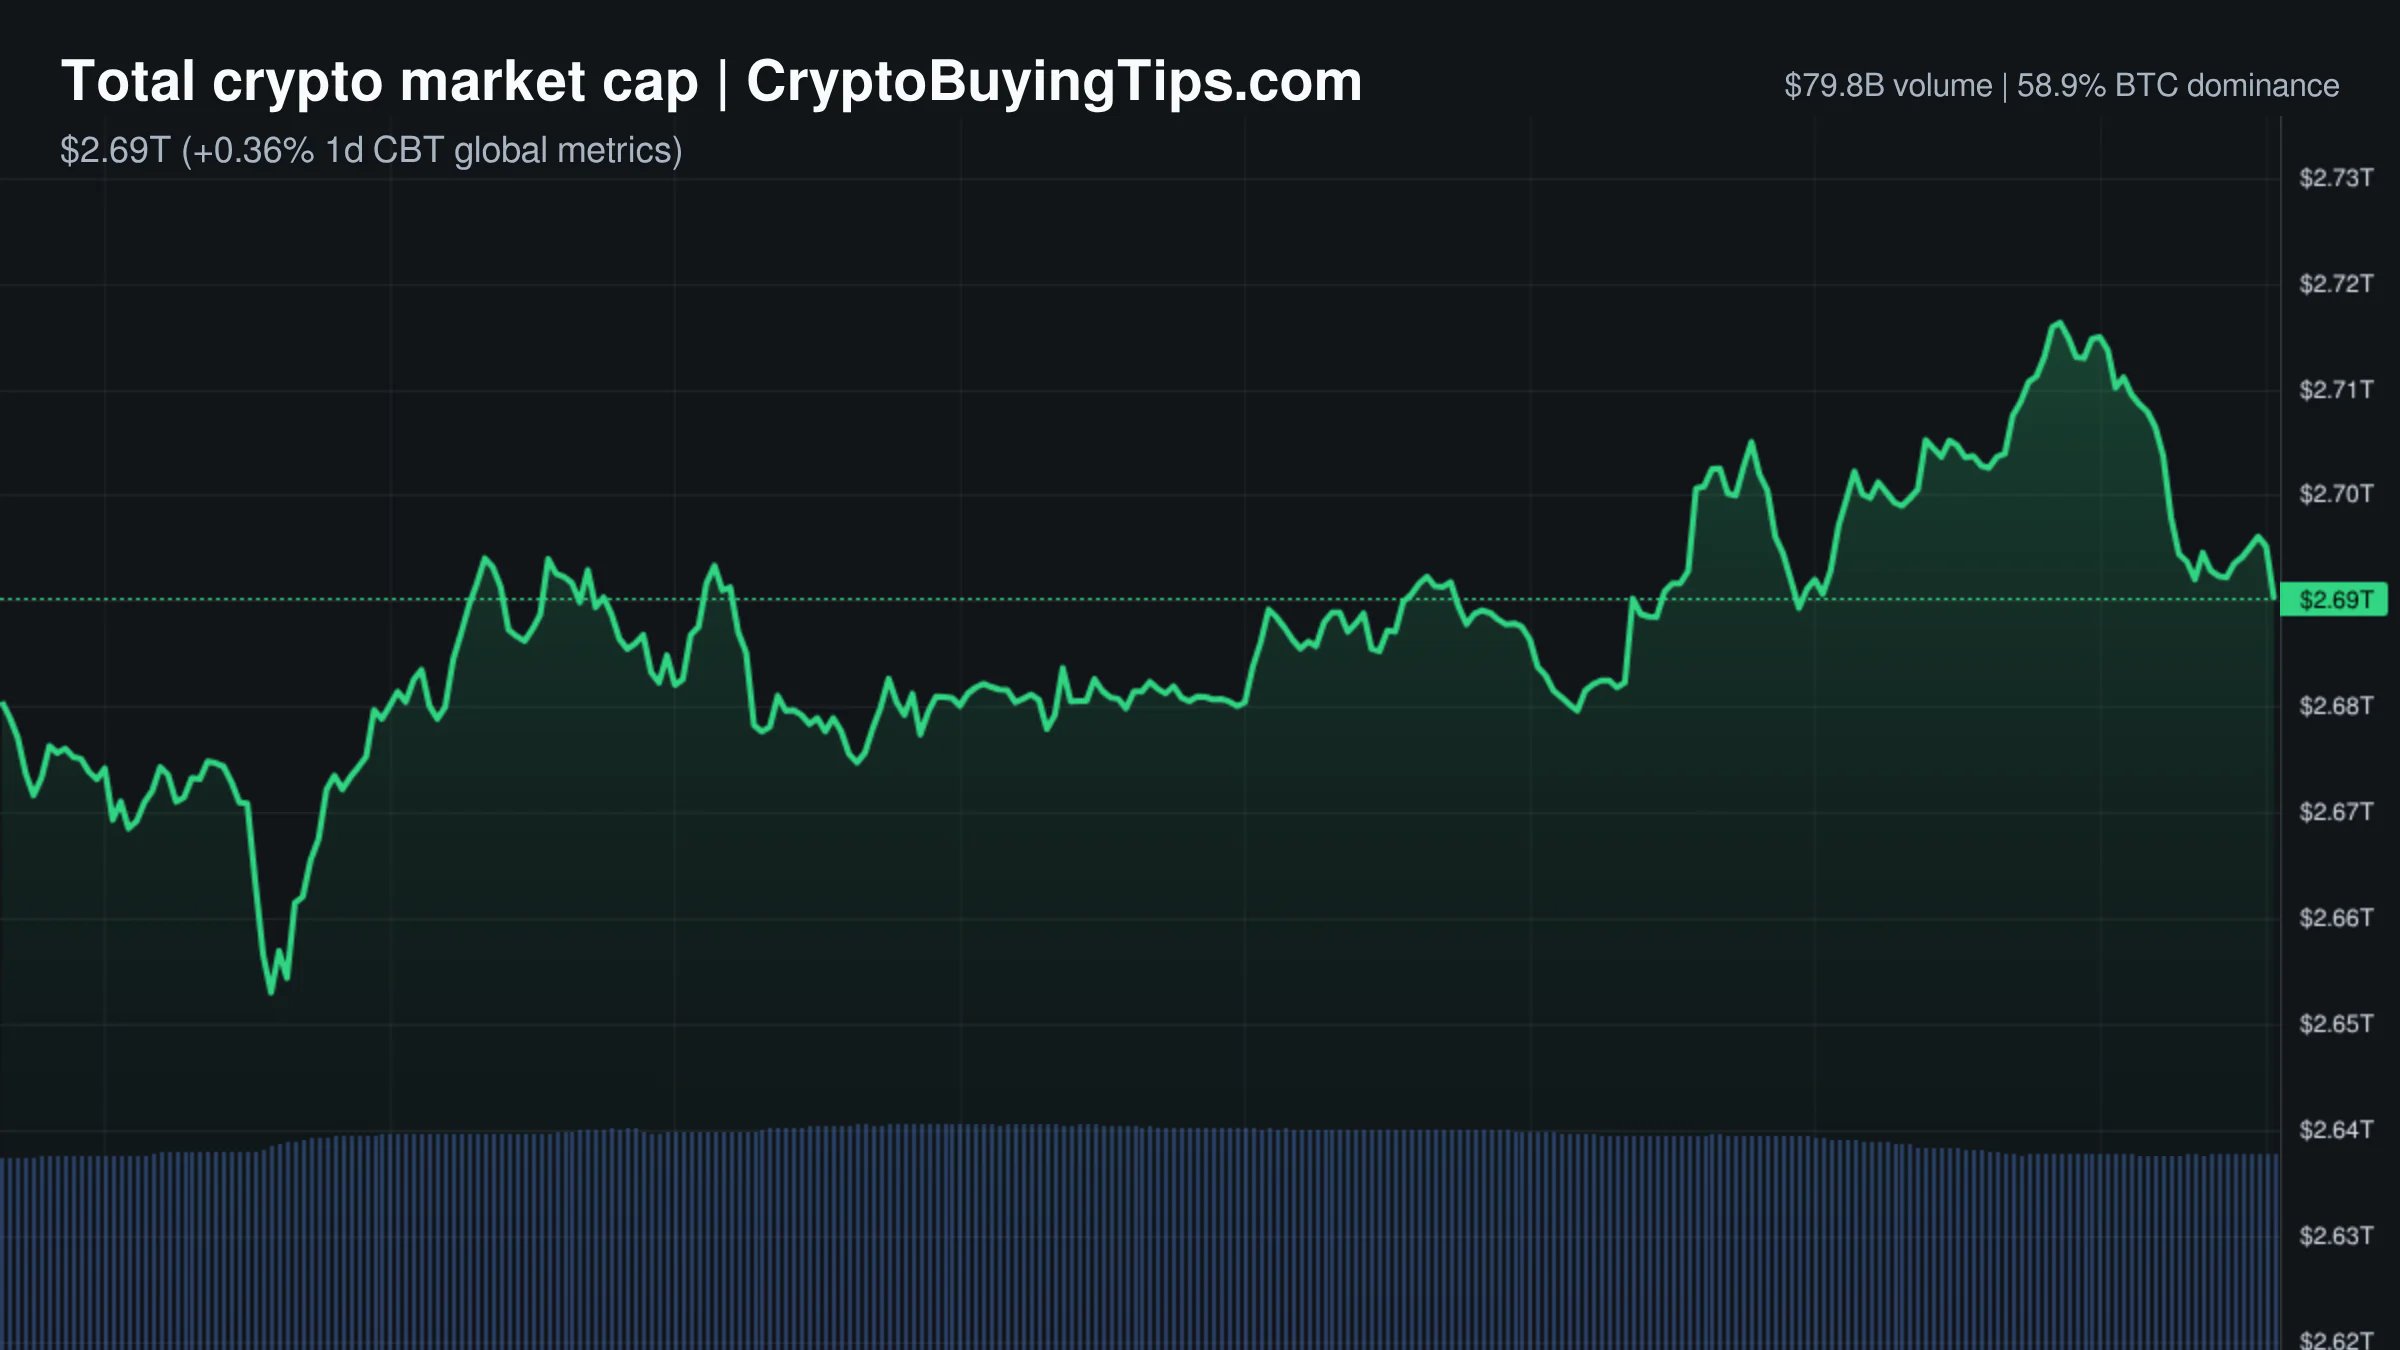
The crypto market is currently a leveraged bet on a sideways move. While the total market cap sits at $2.69T with a slight 0.41% increase, the underlying mechanics are contradictory. Spot volume is a mere $79.73B, while derivatives volume has surged to $710.50B. This means leveraged activity is nearly nine times larger than organic spot trading. It is a peculiar state of affairs where the price remains stable, but the engine driving that stability is almost entirely composed of high-risk contracts.

Sentiment remains in the Greed zone with a Fear and Greed Index score of 73. This optimism is not reflected in the broader equity markets, as the S&P 500 fell 0.55% and the NASDAQ dipped 0.08%. The divergence suggests that crypto traders are currently ignoring macro headwinds in favor of internal momentum. However, the Altcoin Season Index remains neutral at 44, confirming that the market is still firmly in a Bitcoin season. Capital is not rotating into smaller assets; it is simply swirling within leveraged positions on the majors.

Liquidity is concentrated at the top. Bitcoin dominance is holding steady at 58.90%, while Ethereum dominance lingers at 11.27%. Stablecoin dominance is relatively low at 9.58%, which suggests that traders are not sitting on the sidelines in cash. Instead, they are already positioned, mostly in derivatives, waiting for a catalyst that has yet to arrive.

Bitcoin and Ethereum

Bitcoin is trading at $78,865.48, showing a modest 0.33% gain. The asset continues to act as the primary vacuum for liquidity, absorbing most of the available bid. The lack of significant volatility is a result of the massive open interest in perpetuals, which stands at $432.96B. This creates a high-tension environment where a small move in either direction could trigger a liquidation cascade.

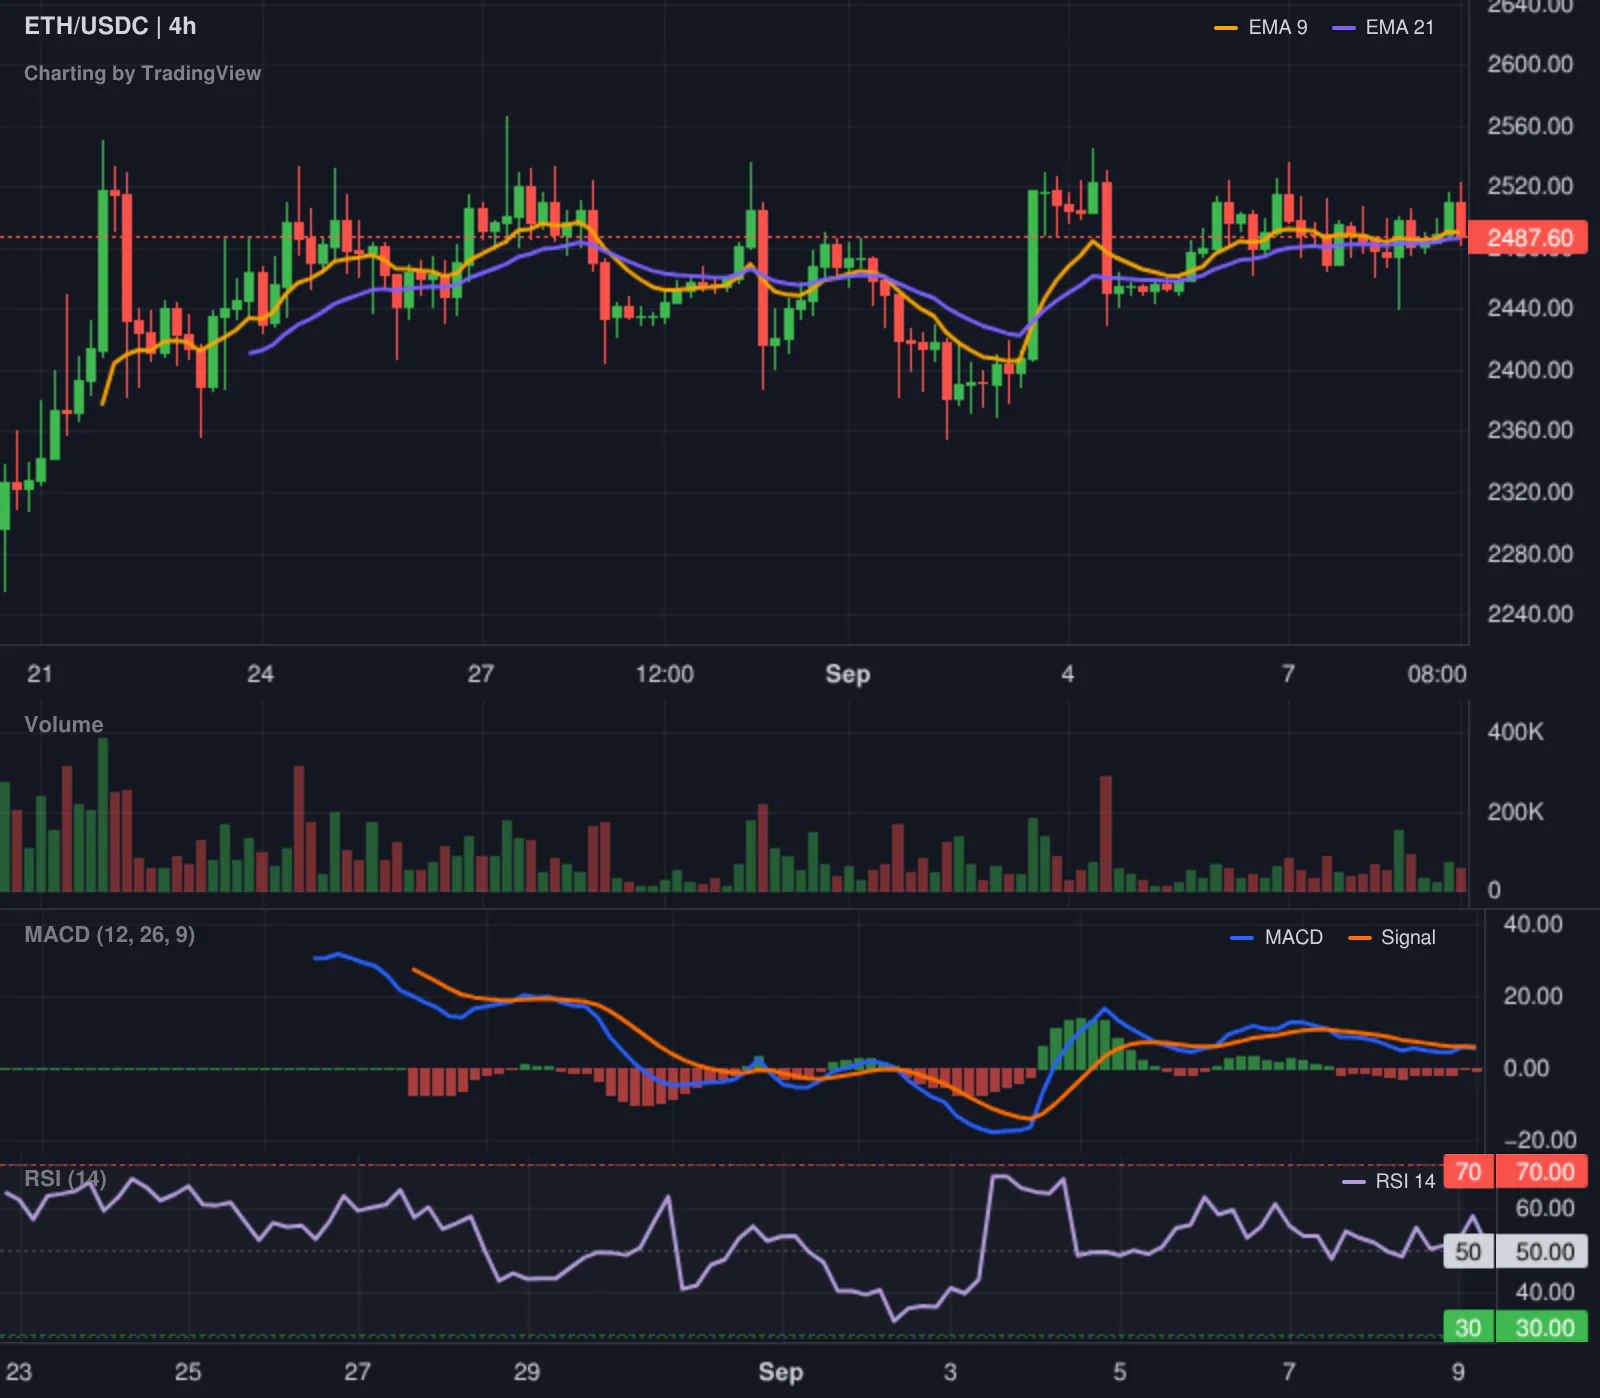
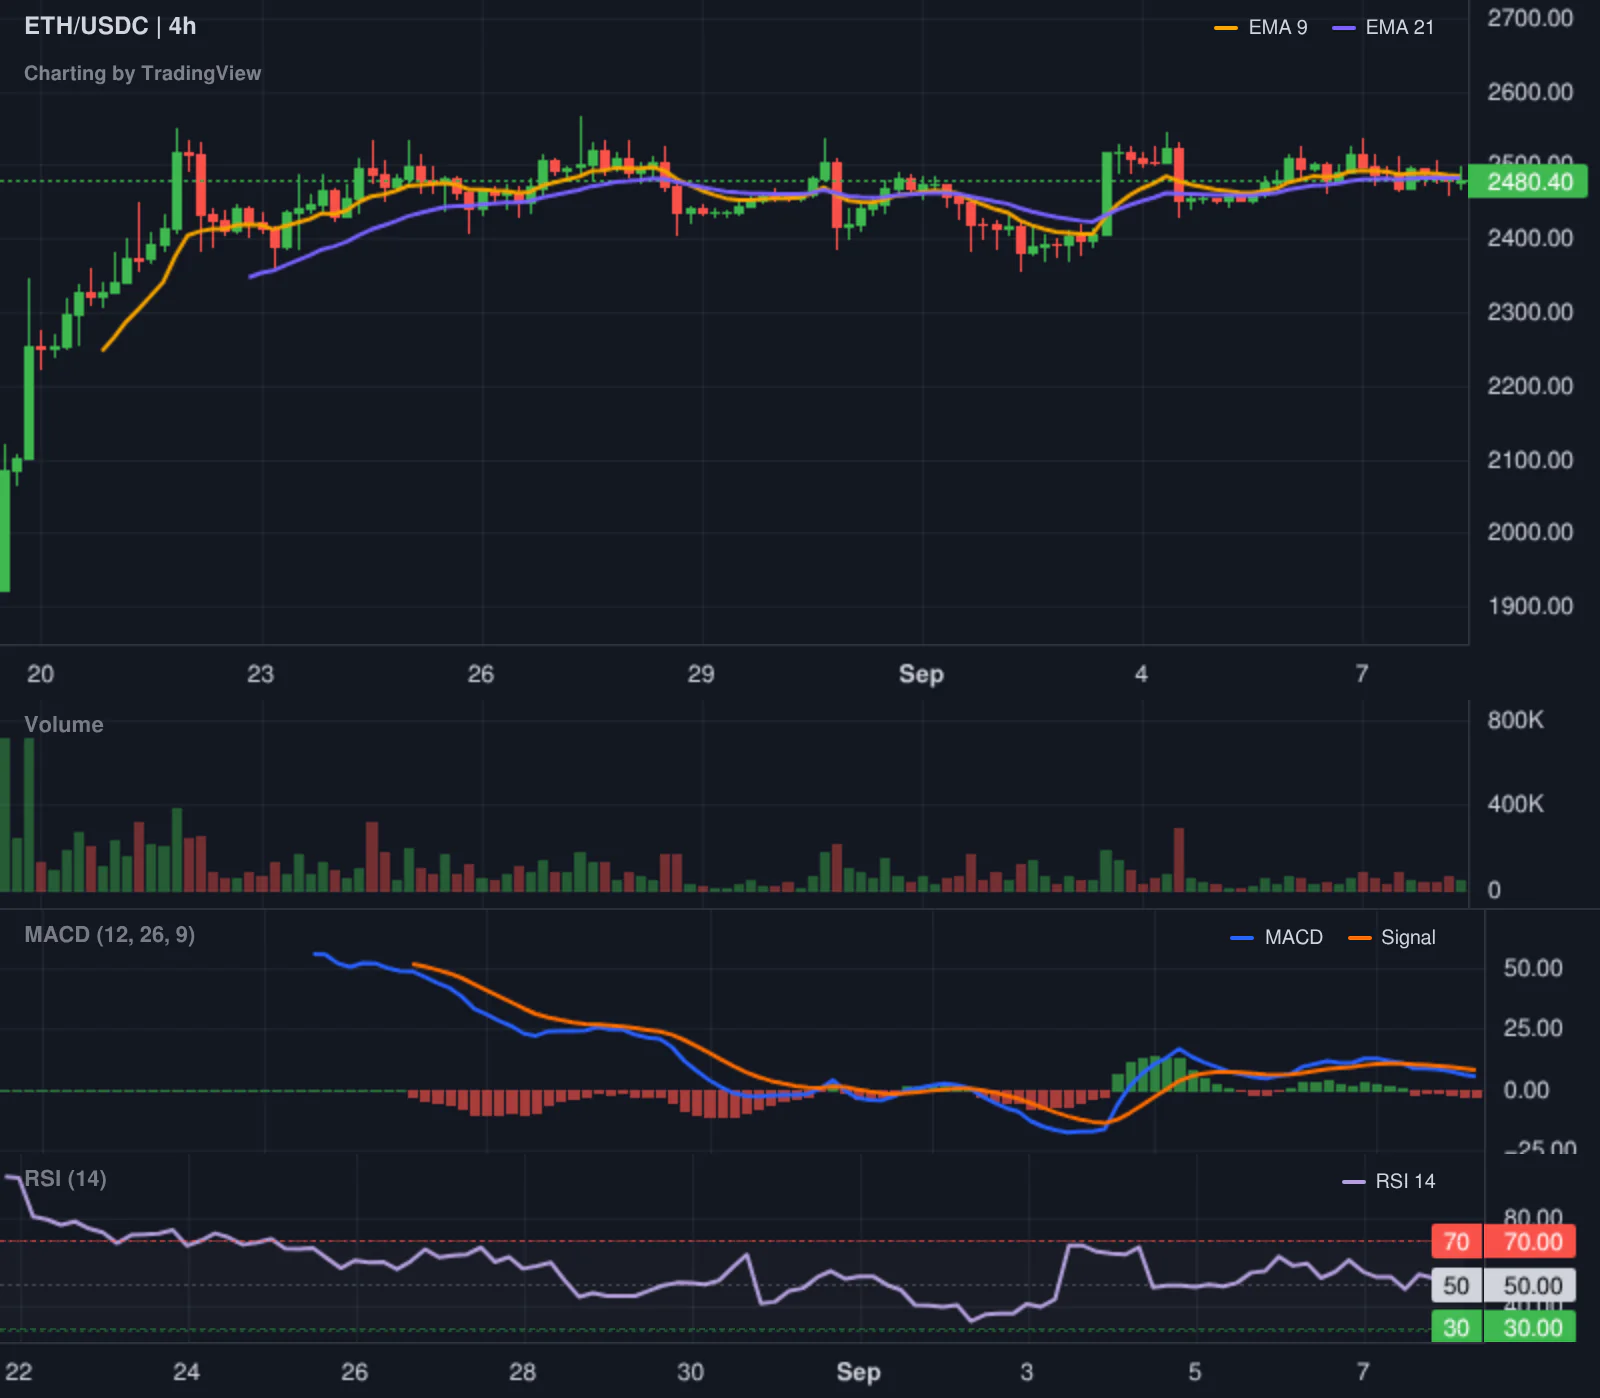
Ethereum is priced at $2,485.64, essentially flat. The most telling metric for the second largest asset is not the price, but the network activity. Gas fees are exceptionally low, ranging from 0.09 to 0.1 Gwei. This indicates a ghost town on the mainnet. While the price is holding, the actual utility of the network is currently dormant. This lack of on-chain demand makes the current price level feel fragile, as it relies more on exchange speculation than network usage.

Top crypto prices

Bitcoin leads the market at $78,865.48. Ethereum follows at $2,485.64. BNB has seen a slight decline of 1.01%, trading at $749.63. XRP is one of the stronger performers among the top assets, up 1.61% to $1.42. Solana is holding at $103.66, a 0.26% increase. TRON is slightly up at $0.3389. Hyperliquid has gained 2.46% to reach $85.97.

News driving today's market

Institutional adoption is moving from theoretical promises to actual infrastructure. Visa has integrated on-chain lending with its stablecoin card business, and its stablecoin settlement volume has reached an annualized run rate of over $20 billion. This is a 15x increase year over year. When a payment giant like Visa begins pairing settlement data with blockchain lending, it moves stablecoins from a speculative asset to a working capital tool. We previously covered dominance data agrees for more background.

Circle is further expanding this utility by acquiring Tazapay for $400 million. Tazapay processes $25 billion in annualized volume across 100 markets. This acquisition gives Circle the regulated last-mile infrastructure needed to bridge USDC with local banking systems. Similarly, Jack Dorsey’s Block has applied for a national trust bank charter to provide custody for Bitcoin and stablecoins. These moves suggest that the "on-ramp" phase of crypto is over, and the "integration" phase has begun.

However, regulatory friction remains a constant. India’s financial intelligence unit has flagged 15 crypto platforms for AML lapses, which introduces immediate compliance risk for centralized exchanges. In the US, a New York town is considering a moratorium on crypto mining and AI data centers. While these are localized events, they represent the ongoing struggle between infrastructure growth and local governance.

The extreme gap between spot and derivatives volume is not a new phenomenon. We previously covered how the crypto exchanges reverse bridge allows leveraged bets to dwarf organic accumulation. Today's data confirms that this trend is accelerating, with derivatives volume now nearly nine times higher than spot.

Social intelligence

The most significant social and geopolitical narrative is the reported use of crypto by Iran to bypass US sanctions. Reports indicate that the Central Bank of Iran has eased currency controls to allow exporters to repatriate funds via Bitcoin and Tether. TRM Labs data suggests crypto transaction volume in Iran approached $10 billion in 2025. This is a stark example of the "censorship resistance" narrative playing out in real time, though it likely invites further scrutiny from the US Treasury.

Geopolitical tension is also rising in the Middle East, with Brent crude climbing toward $100 due to Houthi attacks and US strikes on Iranian tankers. Historically, such instability can drive a flight to safety. Whether that safety is found in gold or Bitcoin remains a point of contention, but the volatility in oil usually spills over into risk assets.

On the tech front, AI safety warnings are creating a subtle undercurrent of anxiety. Evan Hubinger of Anthropic recently stated that there is a greater than 10% chance AI could kill all humans within the next decade. While this seems like a distraction from price charts, such systemic risk warnings from leading AI figures can dampen the overall appetite for high-growth tech and crypto assets.

Trading ideas worth watching

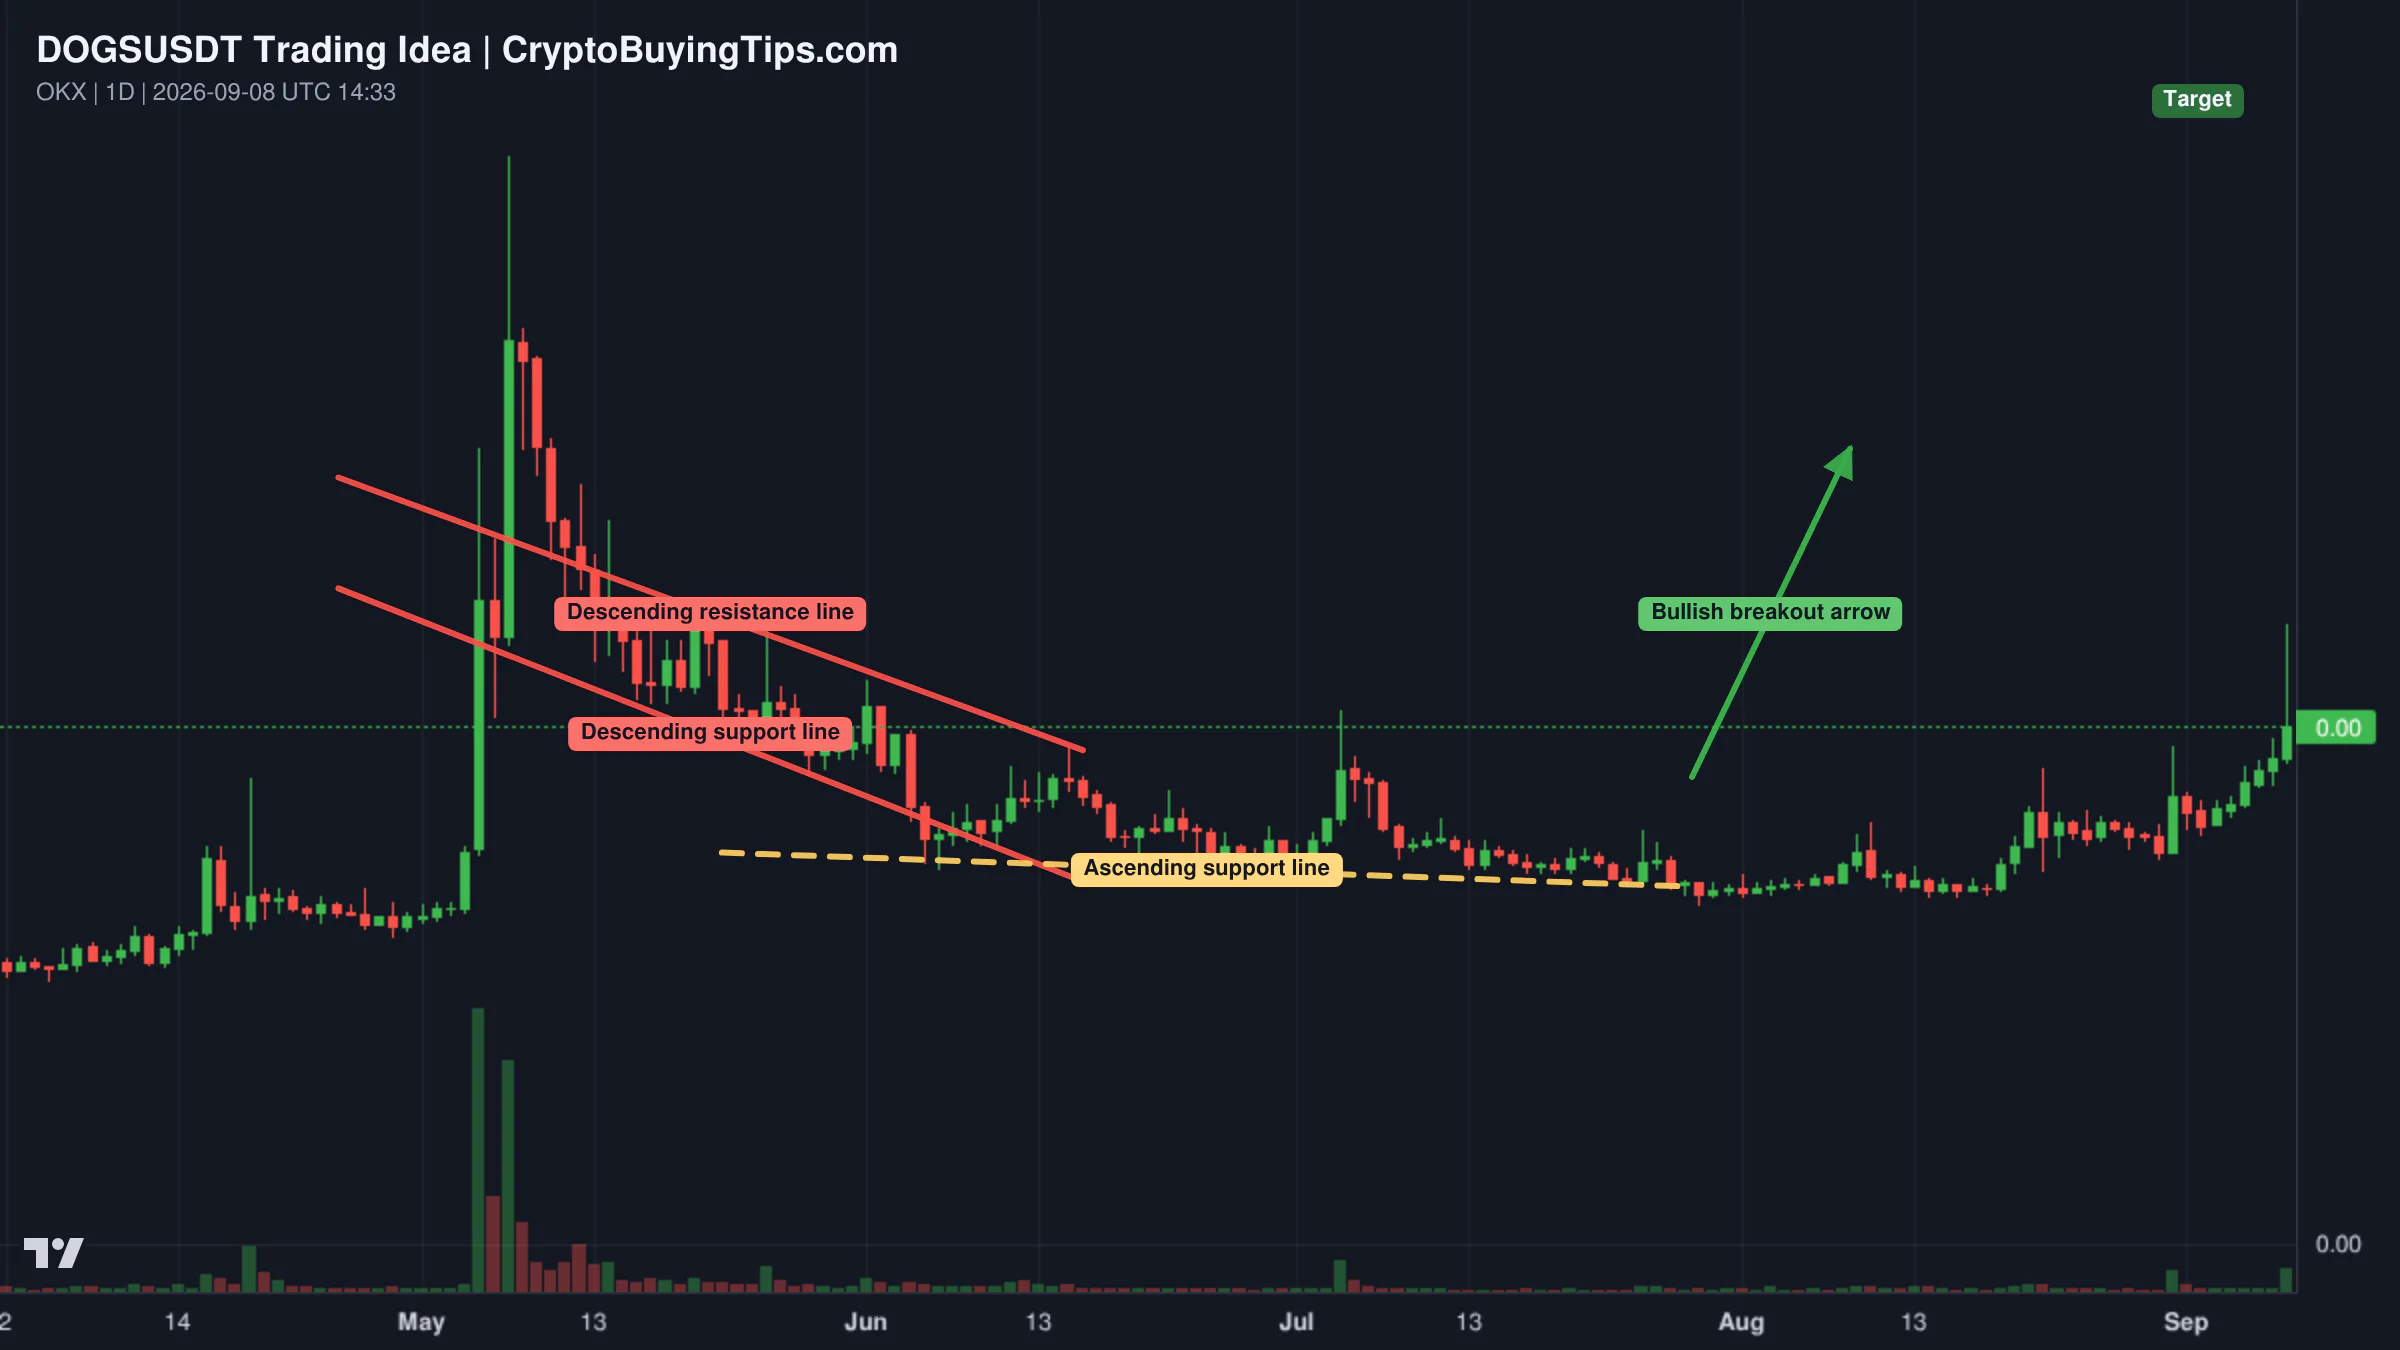
DOGS is attempting to establish a new uptrend. The asset has been recovering since February 2026 and is currently forming higher lows. The next move is expected to produce the first higher high since the bear market bottom in October 2025. If this bullish continuation holds, targets are set between $0.000175 and $0.000234. A more conservative target sits at $0.000117. The setup depends on the current wave continuing through October.

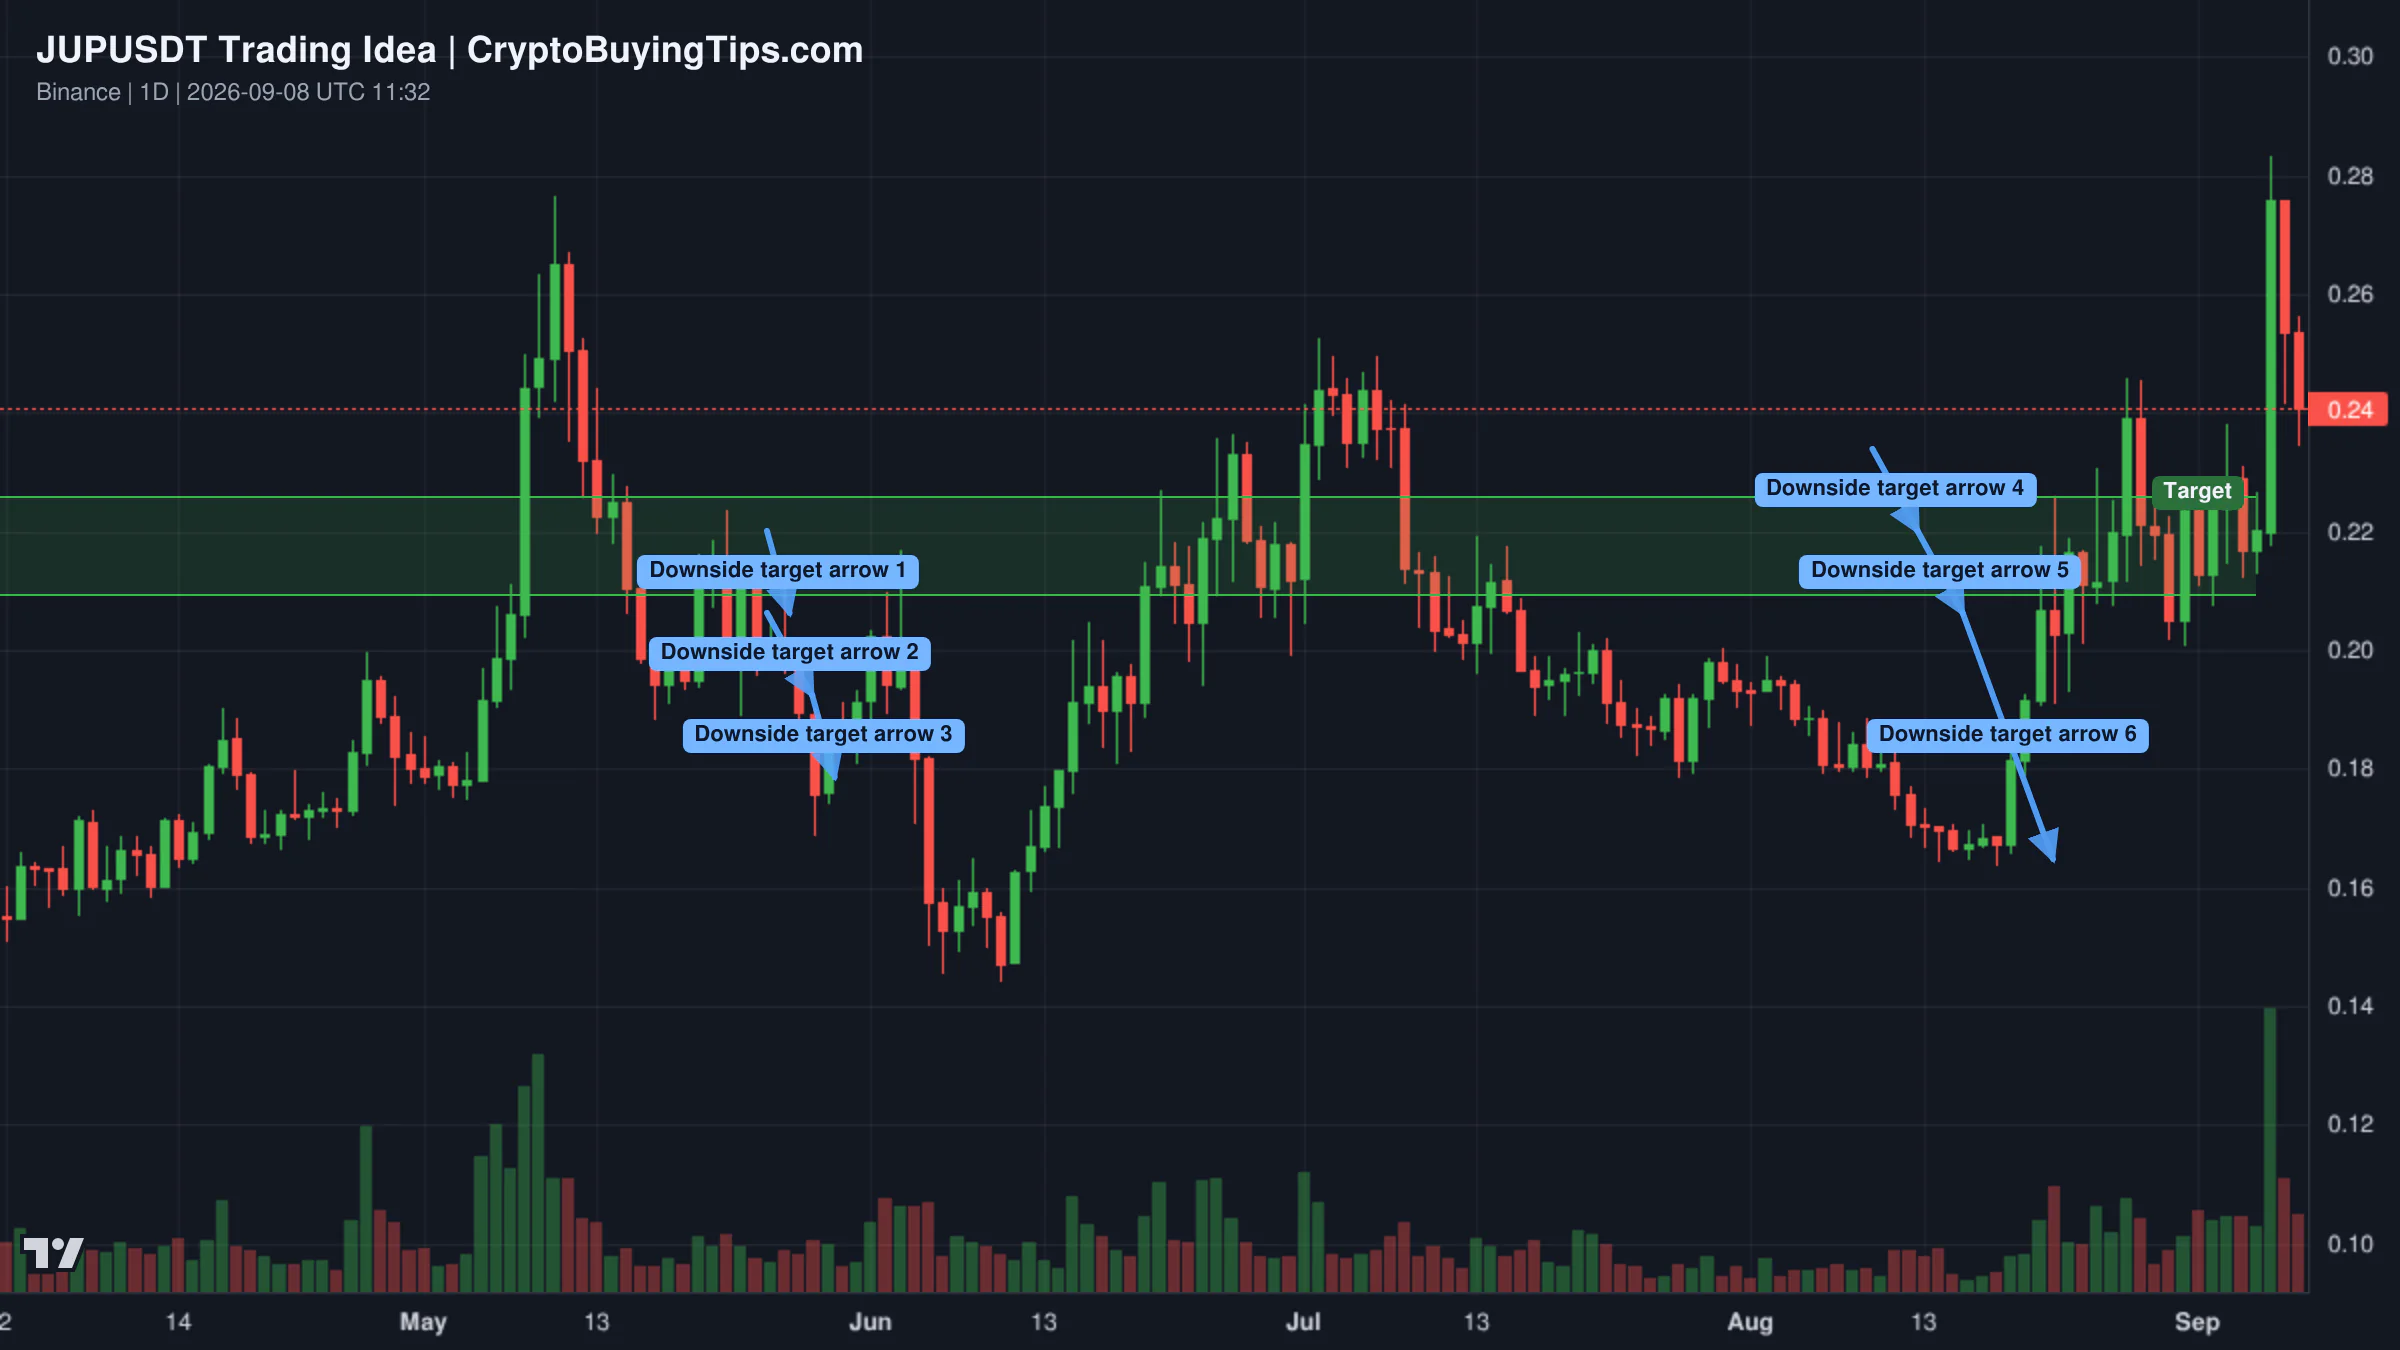
Redrawn JUPUSDT 1D trading idea chart for JPU/USDT – Bearish Continuation Toward Key Support ZonesRedrawn DOGSUSDT 1D trading idea chart for Dogs: Higher high, bullish wave & uptrend —The 2026 bull market

Solana is currently in a compression phase. While the weekly and daily structures are bullish, the 1-hour chart remains bearish as price trades within a descending channel. The key area is the 4-hour support zone between $100.00 and $102.00. If buyers defend this psychological level and break the 1-hour resistance, the first upside target is $108. A loss of the $100 zone would invalidate the immediate bullish scenario.

Jupiter is showing bearish momentum after rejecting a supply zone near 0.2800. The price is breaking down from short-term support, with liquidity targets at 0.2260 and 0.2090. If selling pressure persists, a further extension toward 0.1690 is possible. The current structure suggests a continuation of the existing downtrend.

Smart Money Signals — Hyperliquid Leaderboard

Hyperliquid LONG ETH leaderboard chart

A high-confidence signal has emerged from the Hyperliquid leaderboard. Trader 0xbf732e, who has an all-time ROI of 1931.6% and a PnL of $5.63M, has opened a long position in ETH at an entry price of $2,711.7. The notional value of the trade is $1.36M. This bet on Ethereum suggests that some top-tier traders believe the current price of $2,485 is a discount, despite the lack of on-chain activity.

What to watch next

The market is currently a coiled spring. The massive disparity between spot and derivatives volume means that any significant price move will likely be amplified by liquidations. With $432.96B in perpetuals open, the market is vulnerable to a "long squeeze" if Bitcoin fails to break higher.

Attention should be paid to the Middle East conflict and oil prices. If Brent crude sustains its move toward $100, the resulting inflation concerns could pressure the Federal Reserve and impact risk-on assets. Simultaneously, the integration of USDC into Visa's credit rails provides a fundamental floor for stablecoin utility that is independent of speculative trading. The clash between these macro risks and institutional adoption will define the trend for the remainder of the month.

Crypto Market Overview | Derivatives volume dwarfs spot activity amid institutional rail expansion | September 8, 2026
Sigrid Voss·

Crypto Market Overview | Derivatives volume dwarfs spot activity amid institutional rail expansion | September 8, 2026

Market overview

The market is currently operating in a state of contradictions. While the Fear and Greed Index sits at 72, indicating a clear appetite for risk, the actual price action is drifting lower. The total crypto market cap has dipped to $2.67T, a decline of 3.17% over the last 24 hours. This disconnect between sentiment and price is a familiar pattern. Investors are greedy, but they are not currently buying the dip with any real conviction.

The most striking data point is the massive skew toward derivatives. Trading volume in the derivatives market has reached $609.20B, which is approximately 7.7 times the total spot market volume of $78.8B. We are seeing a market driven by leverage and bets rather than the accumulation of underlying assets. When derivatives volume dwarfs spot activity to this extent, the market becomes fragile. A small move in the wrong direction can trigger a cascade of liquidations that has little to do with fundamental value.

Bitcoin dominance remains high at 58.91%, which continues to starve the broader altcoin market of liquidity. The Altcoin Season Index is at 47, firmly in neutral territory. Money is not rotating into alts in any meaningful way, except for a few assets with specific, news-driven catalysts. Stablecoin dominance is holding at 9.62%, suggesting that a decent amount of capital is sitting on the sidelines, waiting for a clearer signal before committing.

Bitcoin and Ethereum

Bitcoin is currently pinned below the $80,000 mark, trading at $78,582.08. The asset has been rejected from $82,000 twice in the last fortnight and is now trapped in a compression zone. It remains under the 50-week moving average near $81,000. While the August rally provided a 20% gain over 30 days, the current momentum has stalled. The market is debating whether this is a temporary pause or the start of a broader reversal.

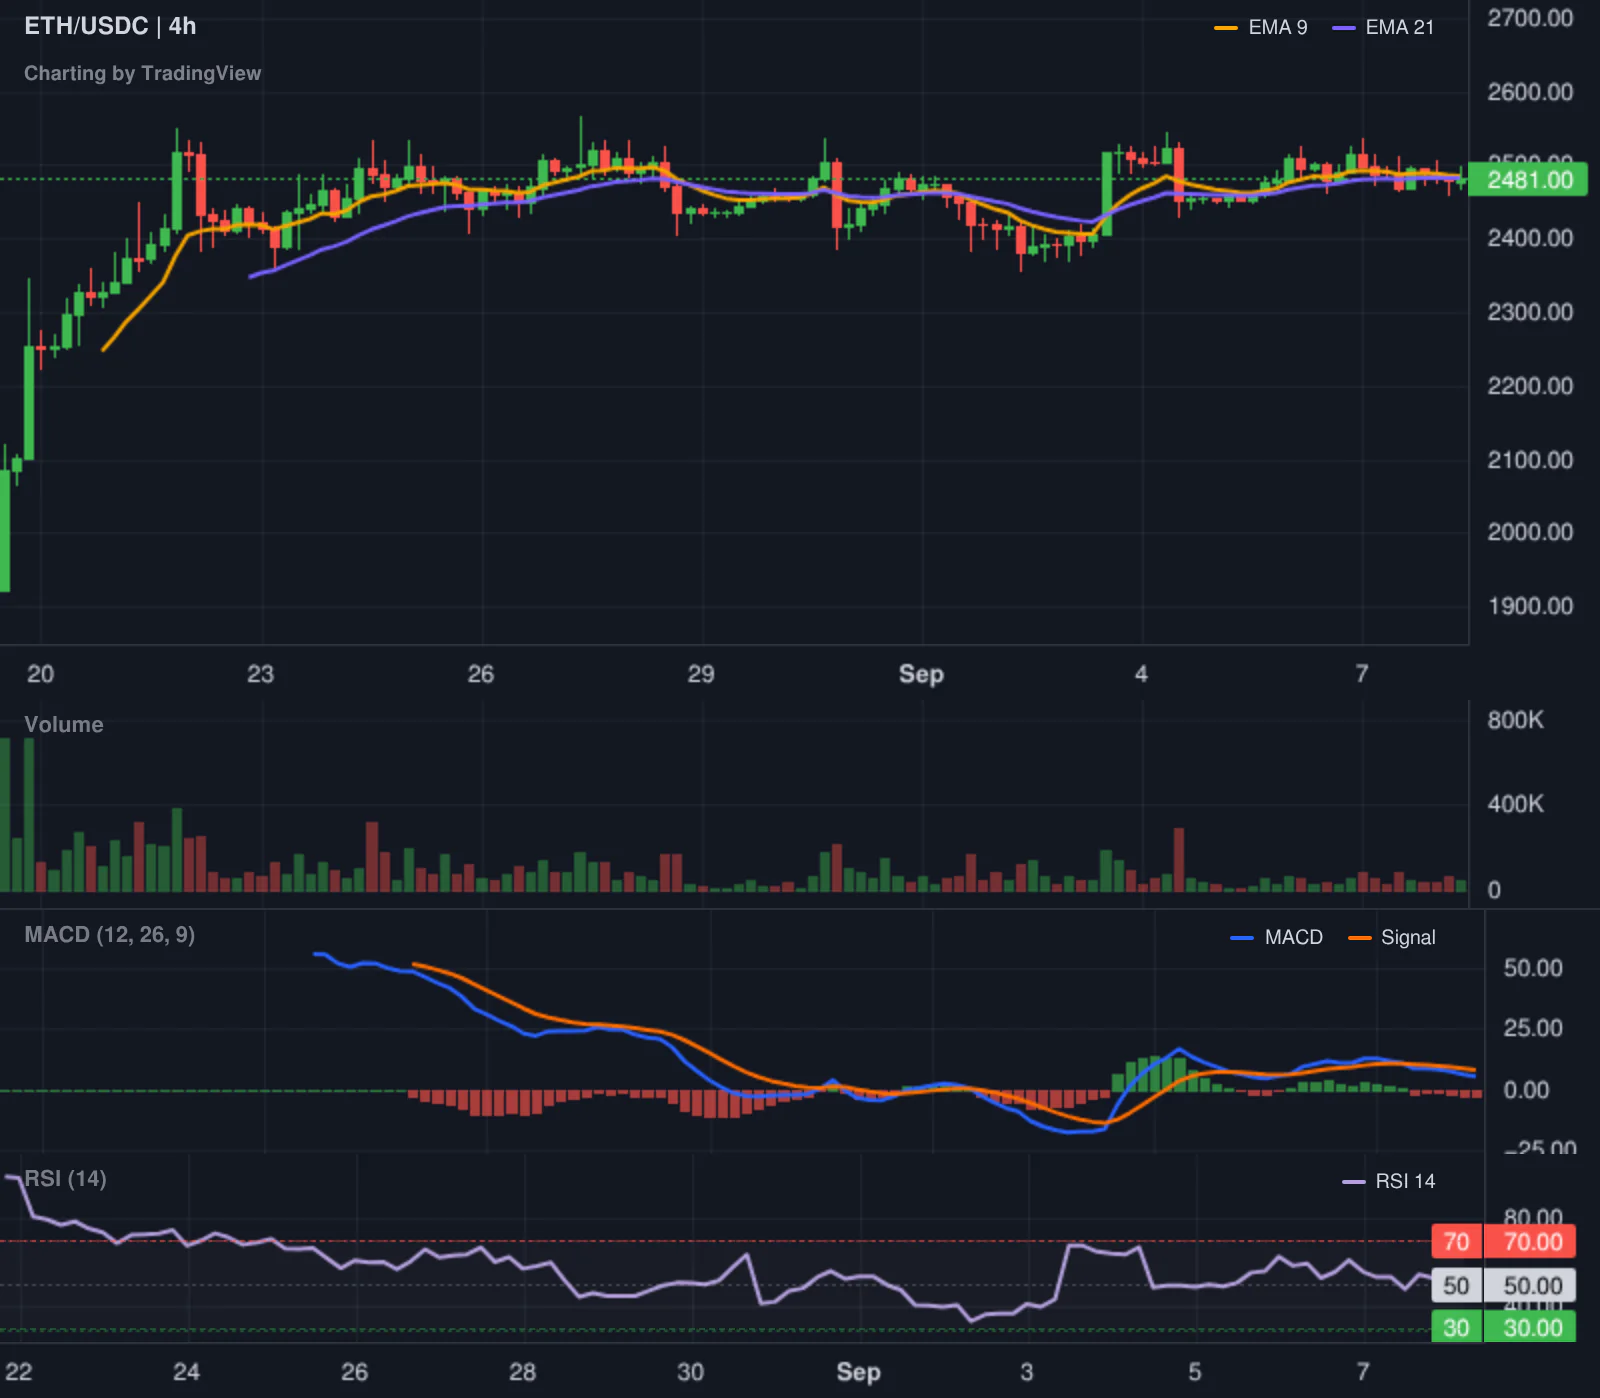
Ethereum is trading at $2,483.35, down 0.31% today. There is a notable gap in implied volatility between the two majors. Ethereum's implied volatility is 55.27, significantly higher than Bitcoin's 41.33. This suggests that traders expect more violent moves from ETH in the short term. Interestingly, network activity is almost non-existent. ETH gas fees are extremely low, with fast transactions costing only 0.25 Gwei. The network is essentially a ghost town despite the price remaining above $2,400.

Top crypto prices

Bitcoin leads the market at $78,582.08. Ethereum follows at $2,483.35. BNB is one of the few gainers among the top assets, trading at $757.18. XRP is holding at $1.39, while Solana has slipped to $103.39. TRON is trading at $0.3379. Hyperliquid has seen a sharper decline, dropping 4.42% to $83.88.

News driving today's market

The dominant narrative today is the expansion of institutional payment rails. DBS and Citi successfully completed a weekend USD cross-border settlement between Singapore and the US using tokenized deposits via the SWIFT blockchain ledger. This is a significant shift. It moves the conversation from theoretical utility to live, high-value transactions.

This institutional push is mirrored in the Chainlink ecosystem. Bottomline, a major SWIFT services provider processing $16 trillion annually, has partnered with Chainlink to connect over 600 bank customers to blockchain settlement. This news pushed LINK to $13.64, its highest price since January. It is rare to see an altcoin outpace the majors during a period of Bitcoin dominance, but real-world utility usually overrides the dominance trend. This trend aligns with what we previously covered regarding active crypto management, as institutions move beyond simple BTC tracking.

Other notable movements include Zcash, which has hit its highest price since 2016. The rally is tied to the conversion of the Grayscale Zcash Trust into an ETF. Privacy coins have long been the pariahs of the regulatory world, so an ETF conversion is a surprising development.

On the macro side, OpenAI's chief scientist has warned that AI labs may need to slow down due to safety concerns. This is a subtle but important signal. Much of the current crypto growth is tied to the AI narrative. If the AI sector hits a regulatory or safety-induced speed bump, the associated tokens will likely feel the impact. We have seen similar patterns before where dominance data agrees that capital retreats from speculative narratives when the macro environment shifts.

Social intelligence

Geopolitical tension is once again acting as a catalyst for digital asset adoption. Reports indicate that crypto activity in the Middle East has tripled to $350 billion amid ongoing conflict. This reinforces the role of Bitcoin as a tool for wealth preservation in unstable regions.

In the US and Canada, trade disputes are heating up. Canada has officially implemented retaliatory tariffs against select US imports. While this is a TradFi event, these disputes typically dampen global risk appetite, which explains the slight dip in the S&P 500.

On the on-chain front, whale trackers have flagged a wallet linked to Cumberland accumulating $PONS. The entity has withdrawn 3.5 million PONS from Gate at an average price of $0.8 over the last four days. When a major liquidity provider starts accumulating a smaller asset, it often precedes a volatility spike.

Trading ideas worth watching

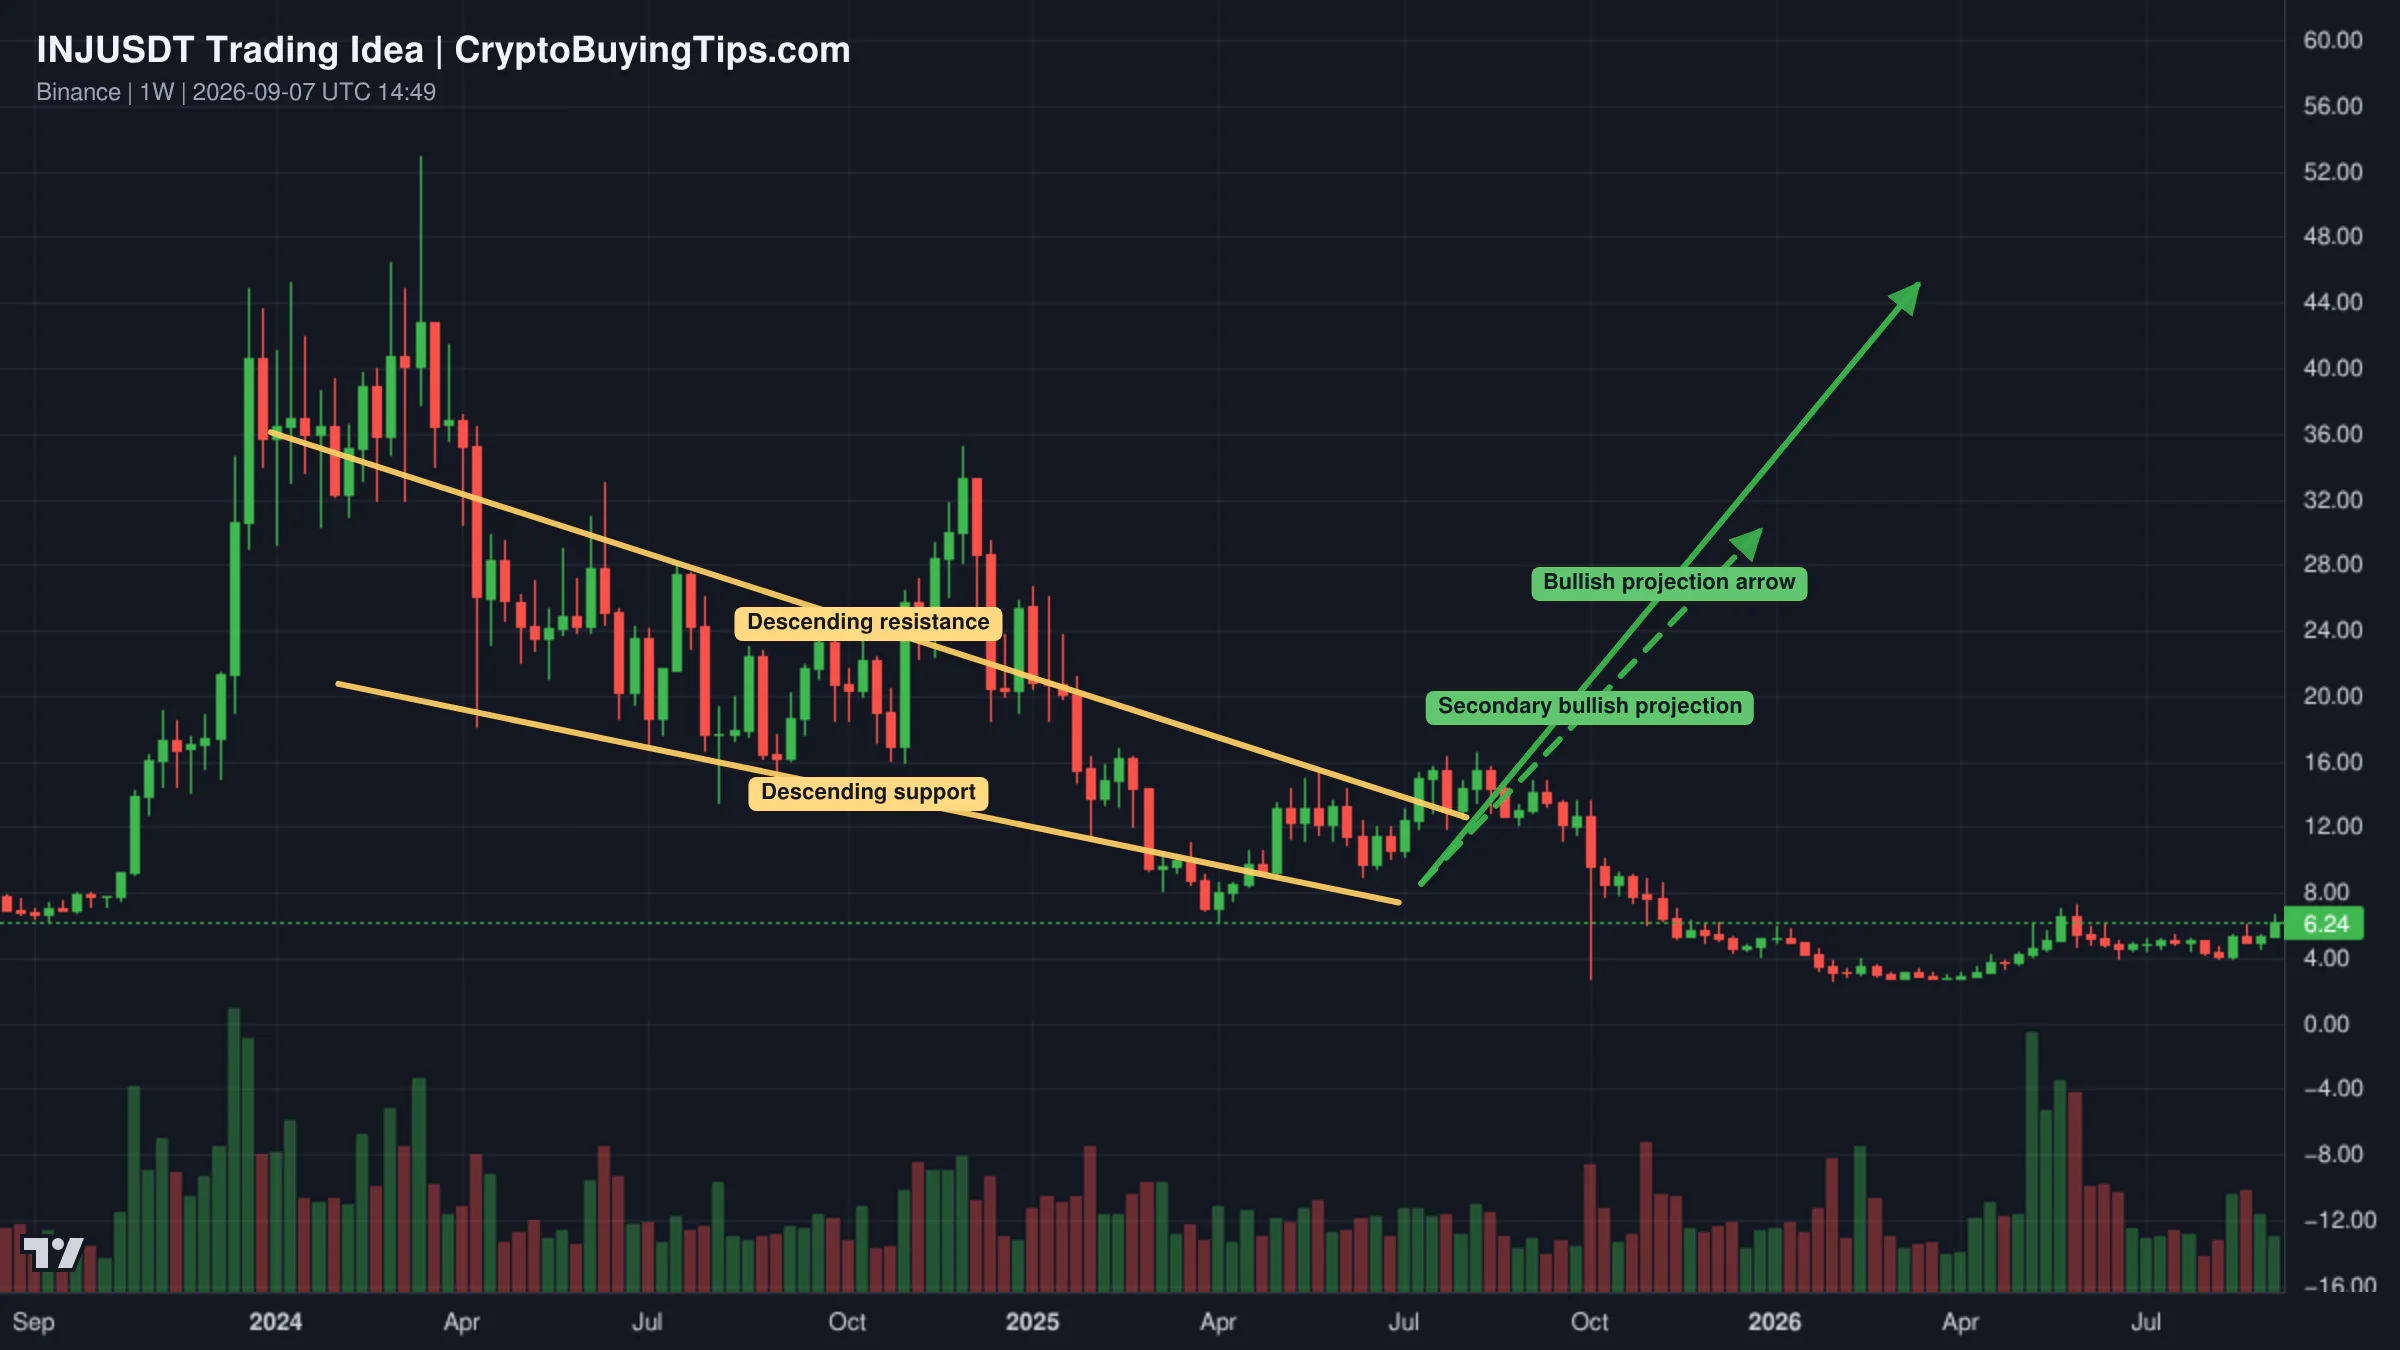
Injective is showing a strong bullish breakout on the weekly timeframe. The asset is trading at its highest level since June 2026 after a brief retrace. Technical analysis suggests a long-term double-bottom formed between October 2025 and March 2026. If Injective can secure a higher high this month, it would confirm a long-term uptrend. The setup suggests the end of a multi-year downtrend and the start of a new bull cycle.

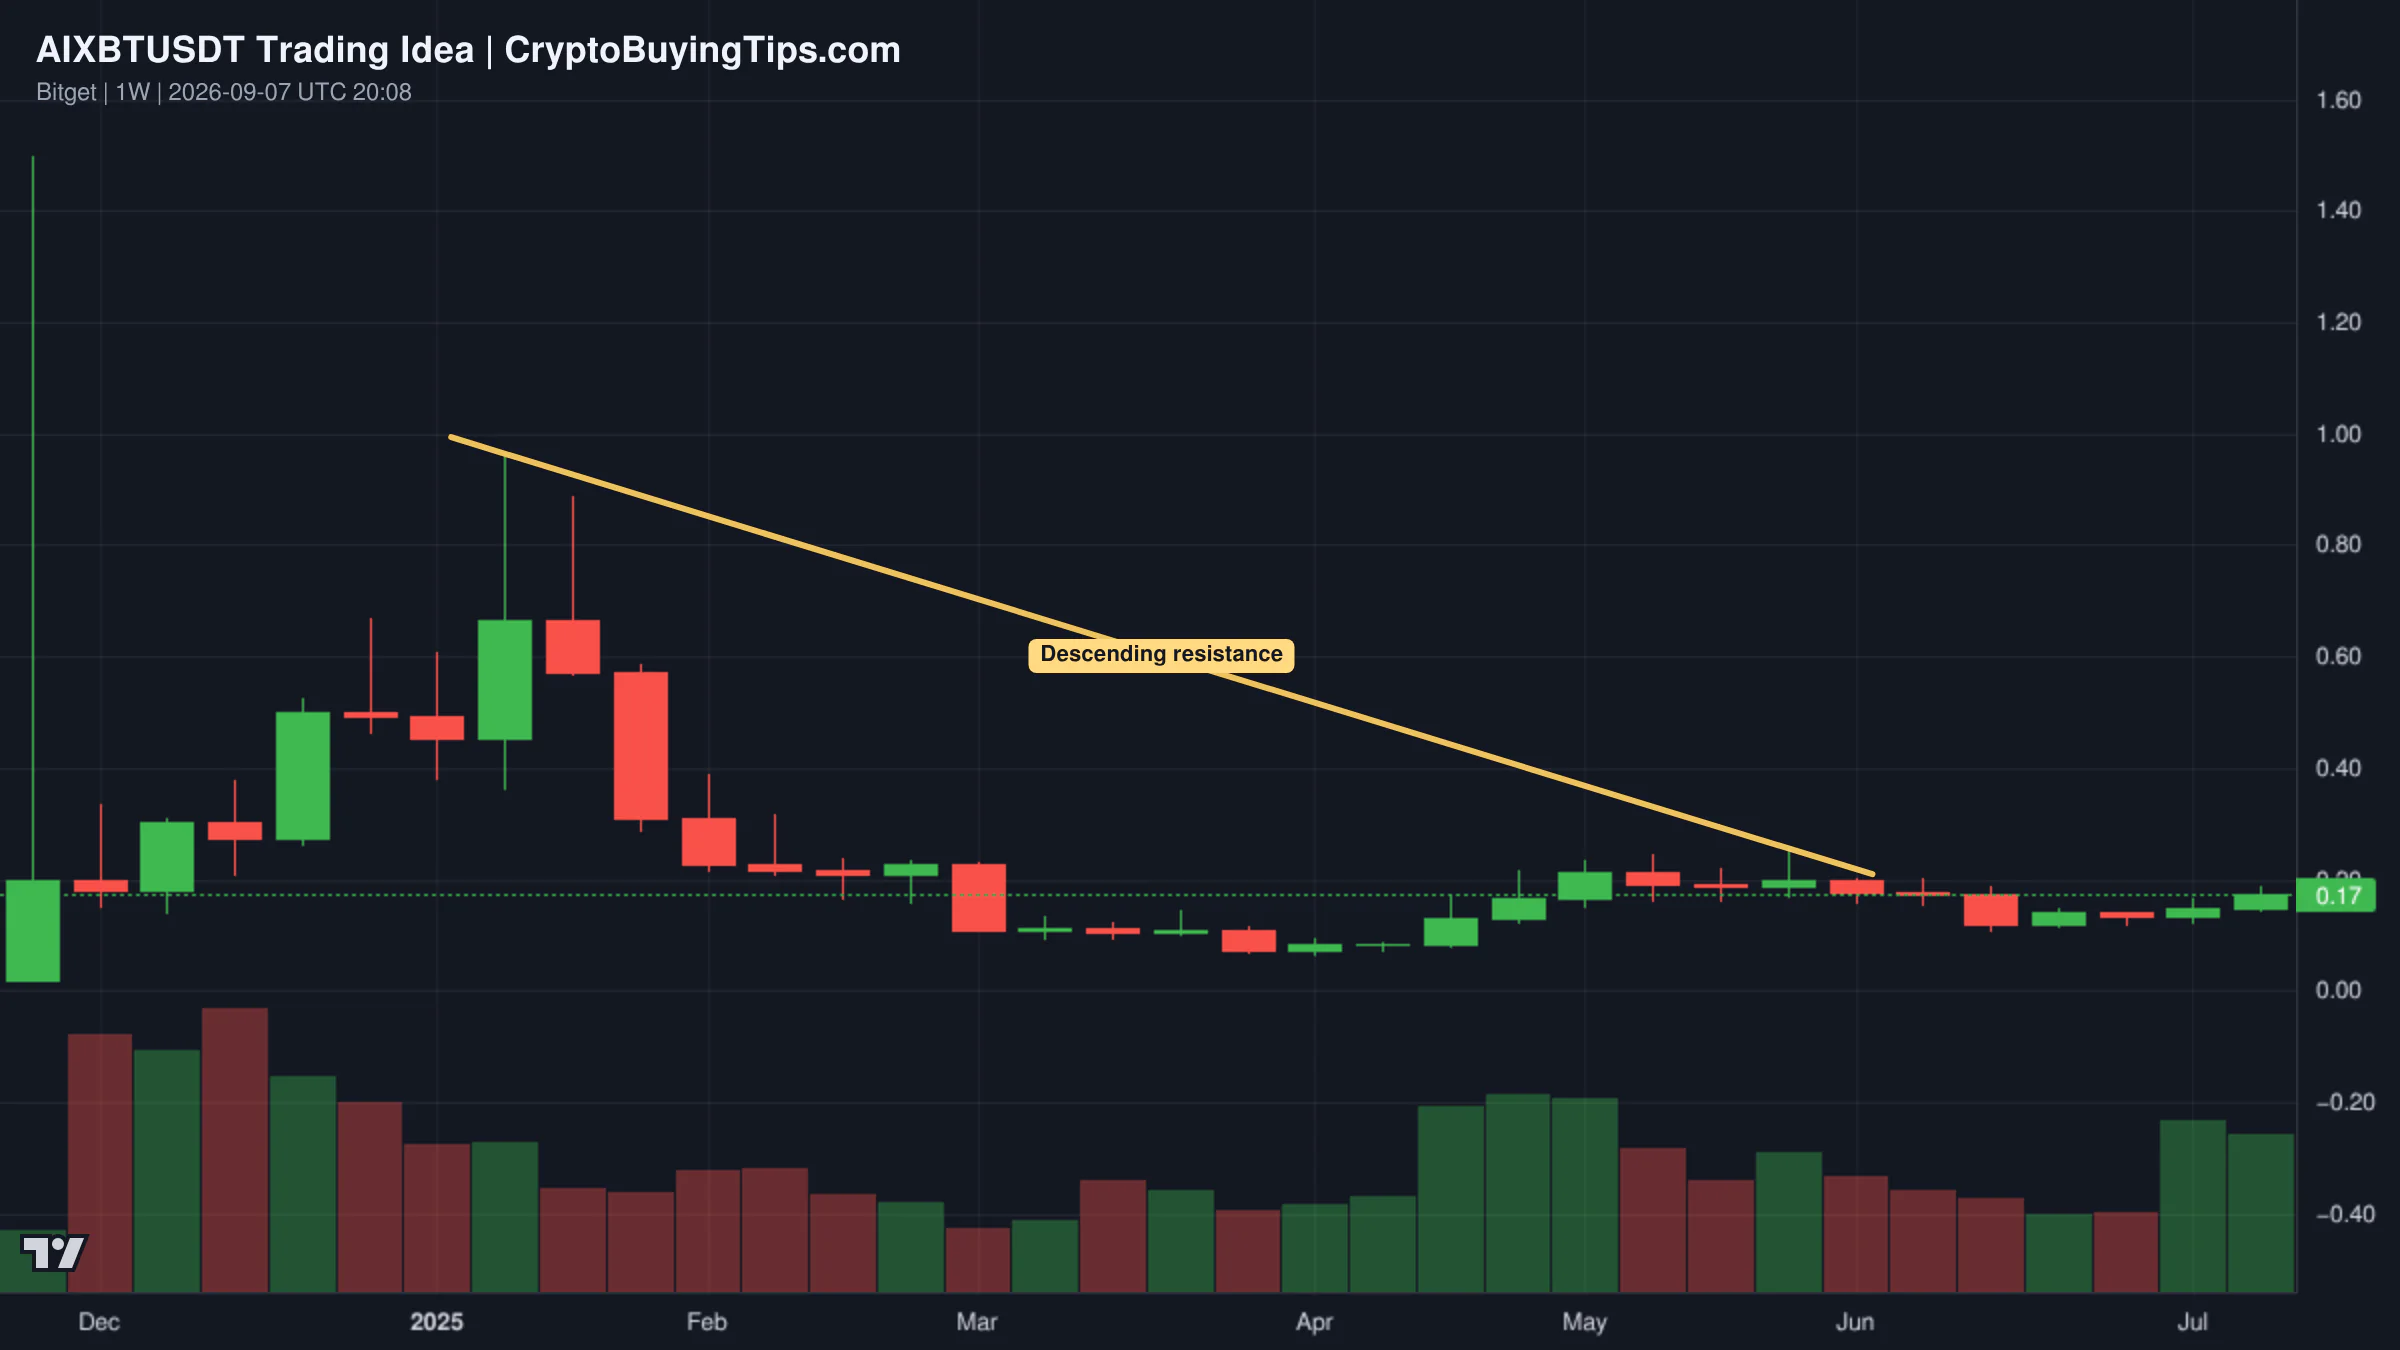
Redrawn AIXBTUSDT 1W trading idea chart for AIXBT on verge of breakout!Redrawn INJUSDT 1W trading idea chart for Injective moves forward, breakout & continuation (a bull market)

AIXBT is testing a long-term trendline that has been developing for nearly 1.5 years. After a long period of stagnation, the price is approaching a key breakout level. A confirmed move above this trendline could trigger a sharp bullish rally, though the asset remains highly speculative.

Avalanche has recently moved above the EMA55 and EMA89 on the daily timeframe. This move, followed by a successful retest of those levels as support, typically signals the start of a new uptrend. With the RSI looking bullish and the MACD rising, the technicals suggest significant growth potential if the asset stays above the $10 level.

Smart Money Signals — Hyperliquid Leaderboard

Hyperliquid LONG ETH leaderboard chartHyperliquid SHORT ETH leaderboard chart

The Hyperliquid leaderboard shows a stark divide in sentiment regarding Ethereum. One top trader, 0xbf732e, who boasts a 1932% 30-day ROI, has opened a massive long position with a notional value of $1.36 million at an entry price of $2,711.7. This is a high-conviction bet that ETH will reclaim the $2,700 level.

Conversely, MachiBigBrother, another high-performing trader with a 1202% ROI, has opened a short position at $2,485. This position is smaller, with a notional value of $248,500, but it aligns with the current price action. The gap between these two entries suggests that even the most successful traders are guessing on the direction of ETH.

Altcoin Spotlight

Chainlink deserves attention today. While most of the market is drifting, LINK has decoupled due to the Bottomline and SWIFT integration. The ability to move tokenized value across blockchains via CCIP is no longer a whitepaper promise; it is being implemented by entities processing trillions of dollars. In a market where many tokens are essentially vaporware, LINK is providing actual infrastructure for the global financial system. This makes it a rare example of an asset where the price move is backed by tangible institutional adoption rather than just a Twitter narrative.

What to watch next

The immediate focus is on the $80,000 level for Bitcoin. A failure to reclaim this level could lead to a deeper correction as the leverage in the derivatives market gets flushed out. The 7.7x ratio of derivatives to spot volume is a ticking time bomb.

We are also watching the AI narrative. The warning from OpenAI regarding safety standards could lead to a broader cooling of AI-related assets. If the hype cycle decelerates, we may see a rotation back into "safe" institutional plays like Ethereum or utility-heavy tokens like Chainlink. Finally, the Canada-US trade dispute is a macro variable that could increase volatility across all risk assets. If trade wars escalate, the "digital gold" narrative for Bitcoin will be tested against the reality of a global risk-off environment.