Market Overviews

Daily crypto market overviews, trend analysis, and key updates from our editorial team.

Crypto Market Overview — May 8, 2026
Sigrid Voss·

Crypto Market Overview — May 8, 2026

Market overview

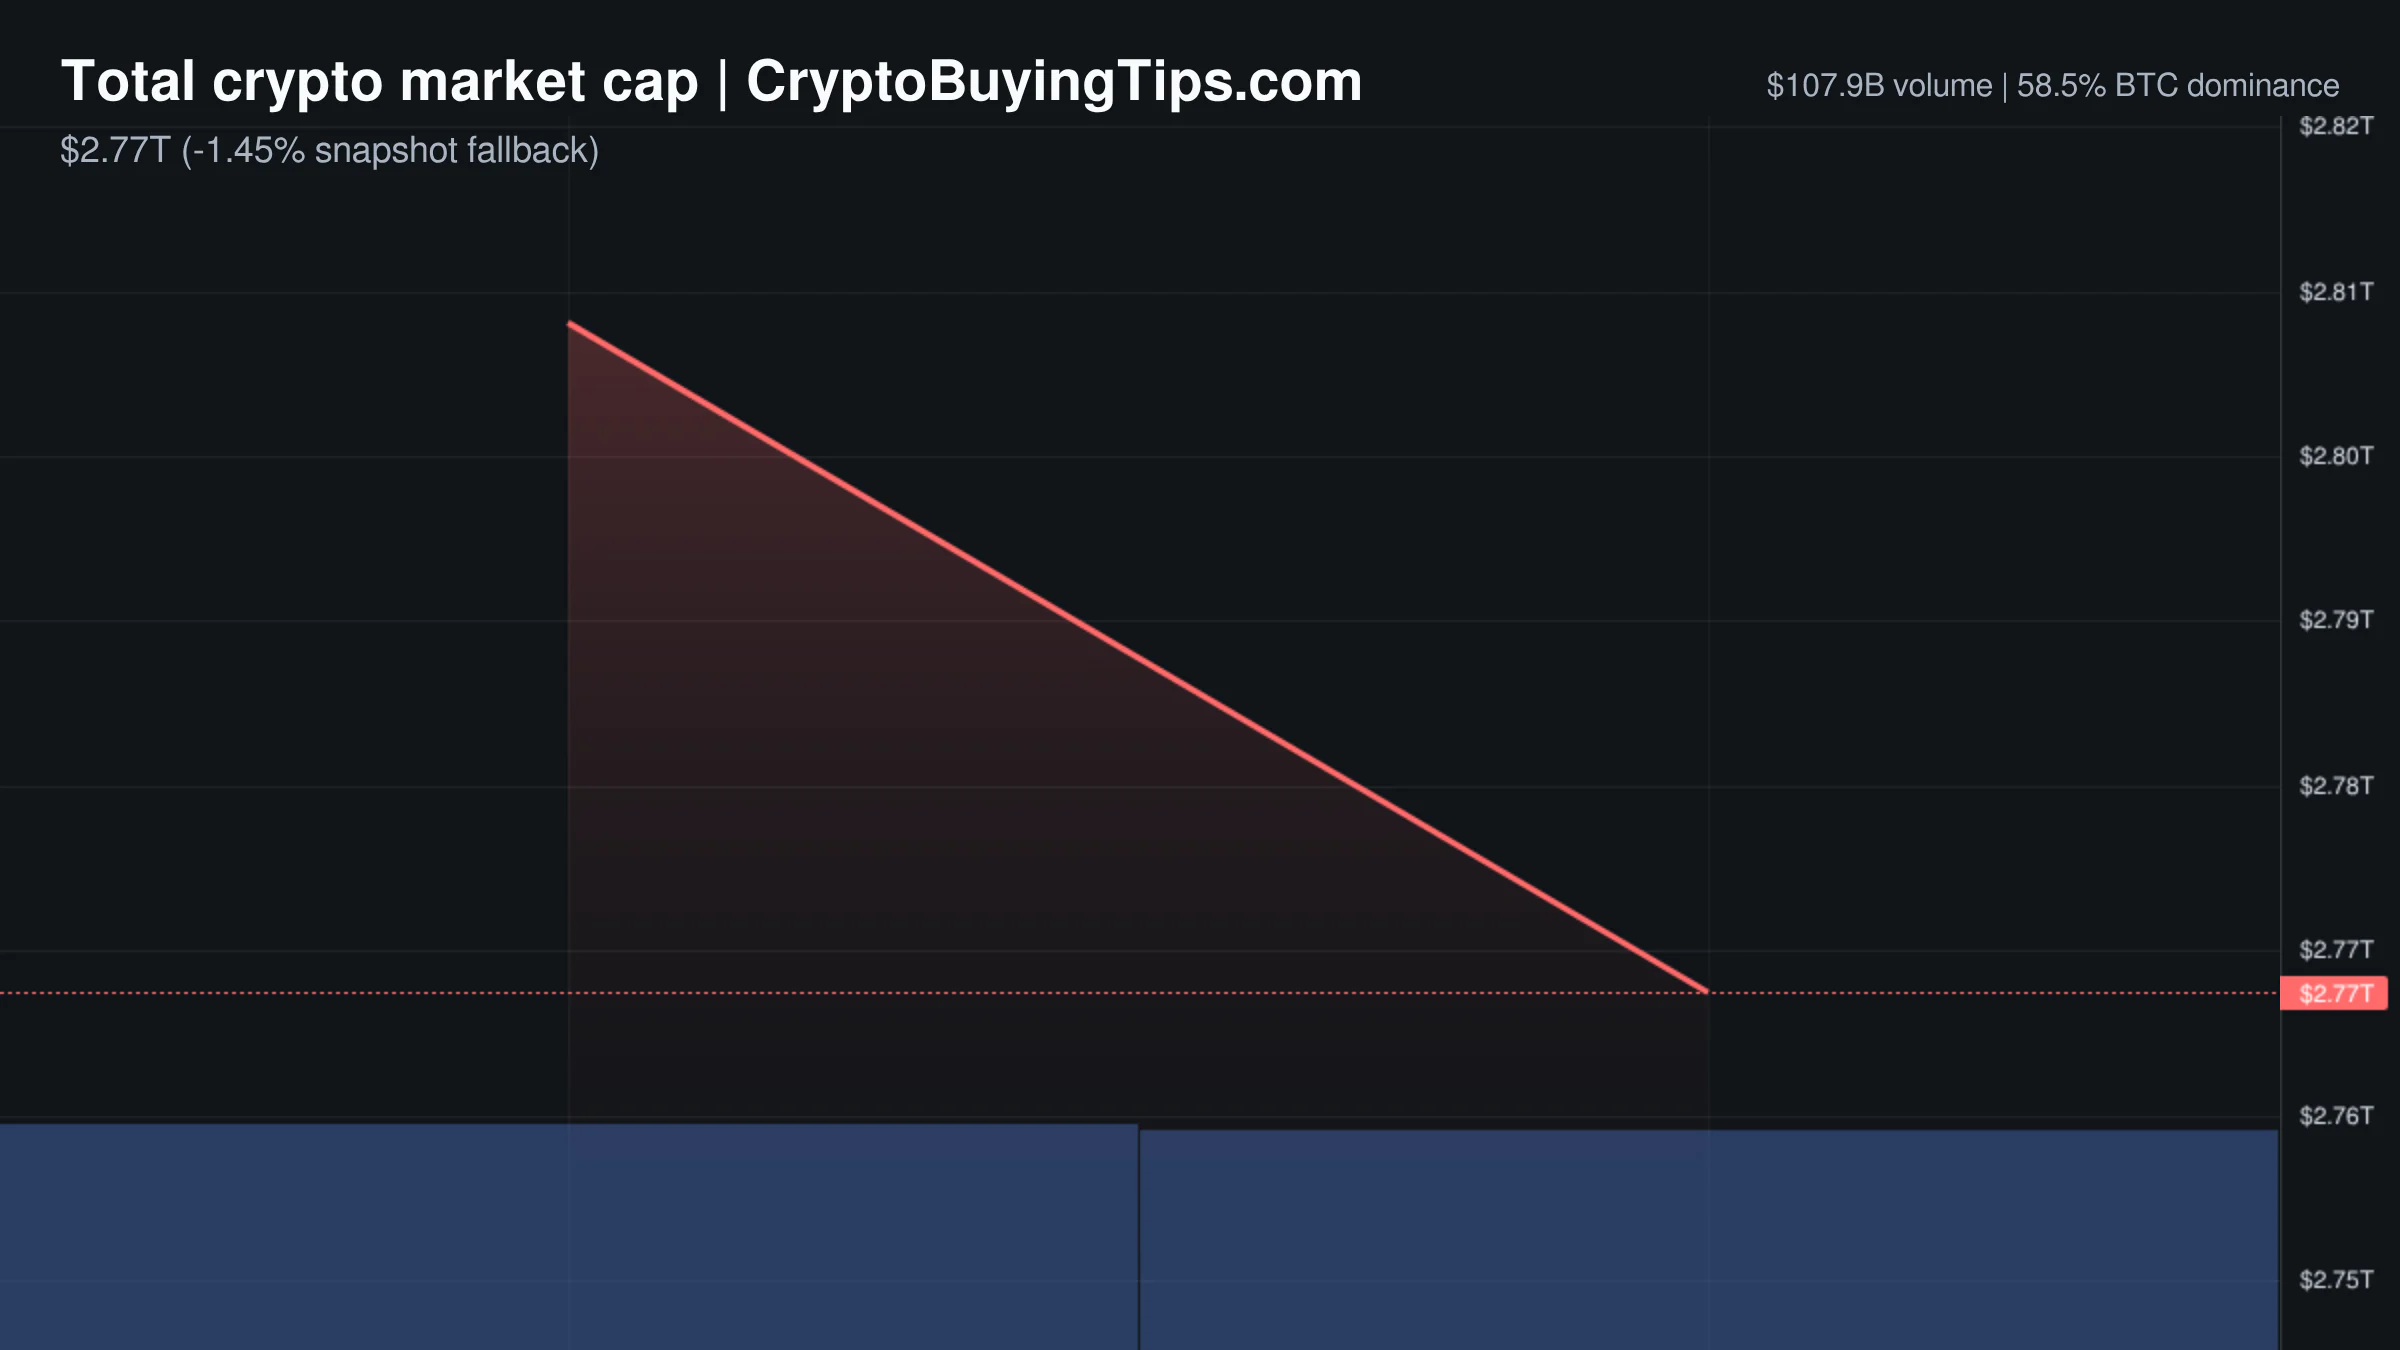
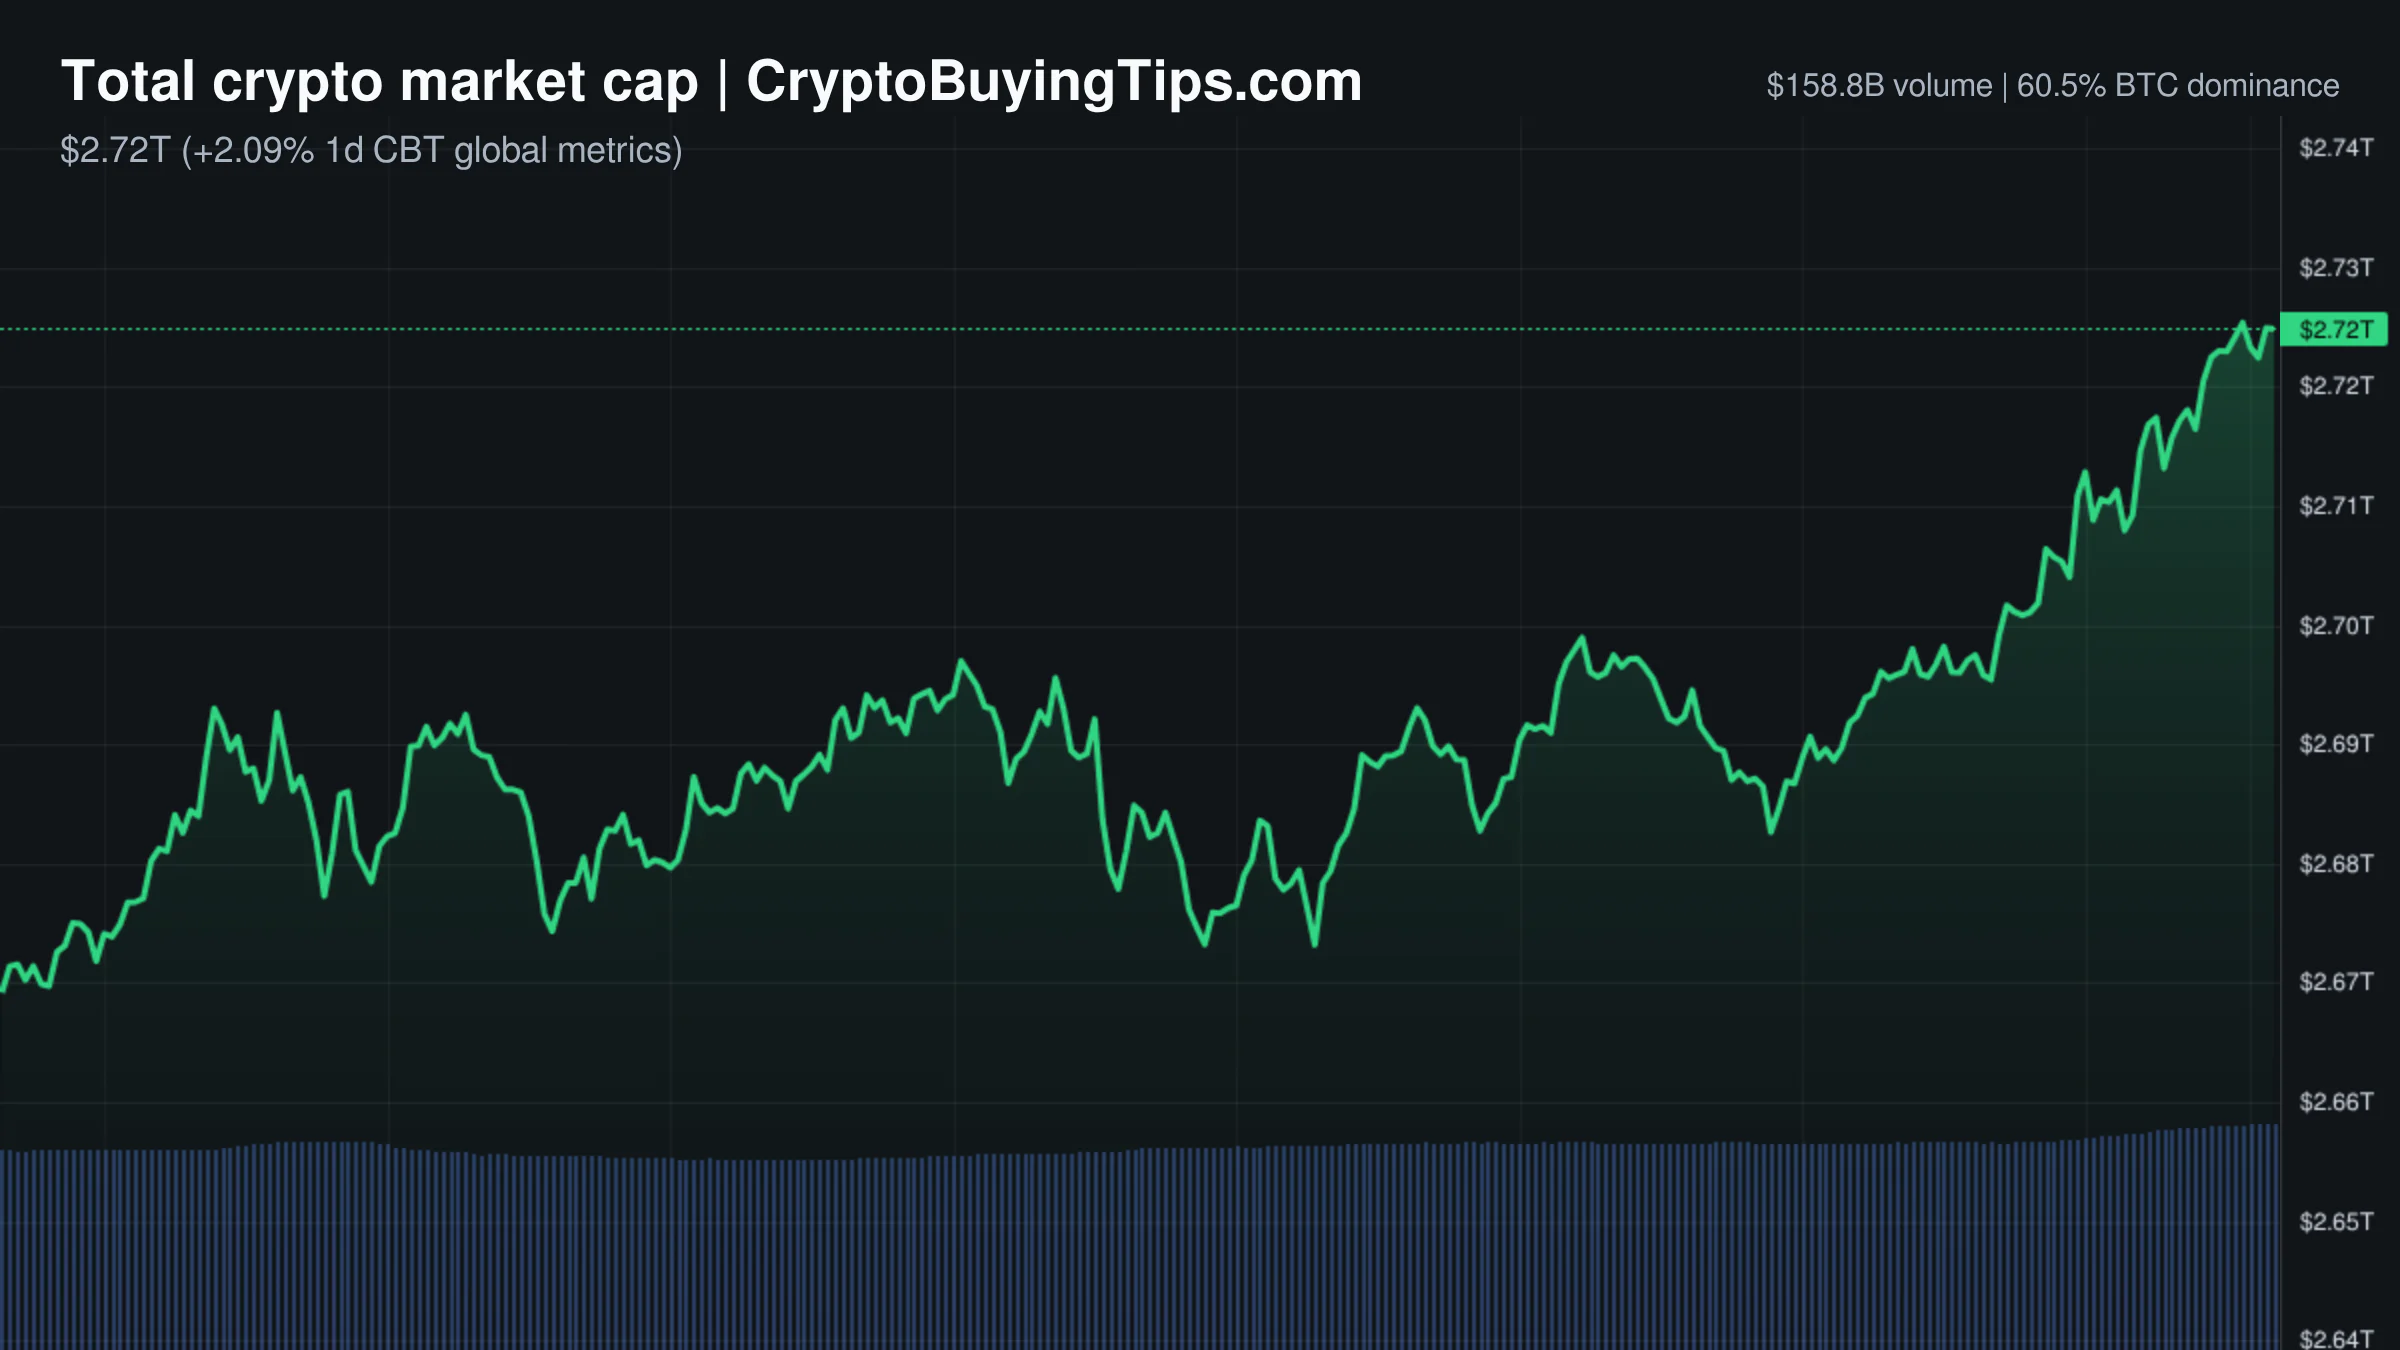
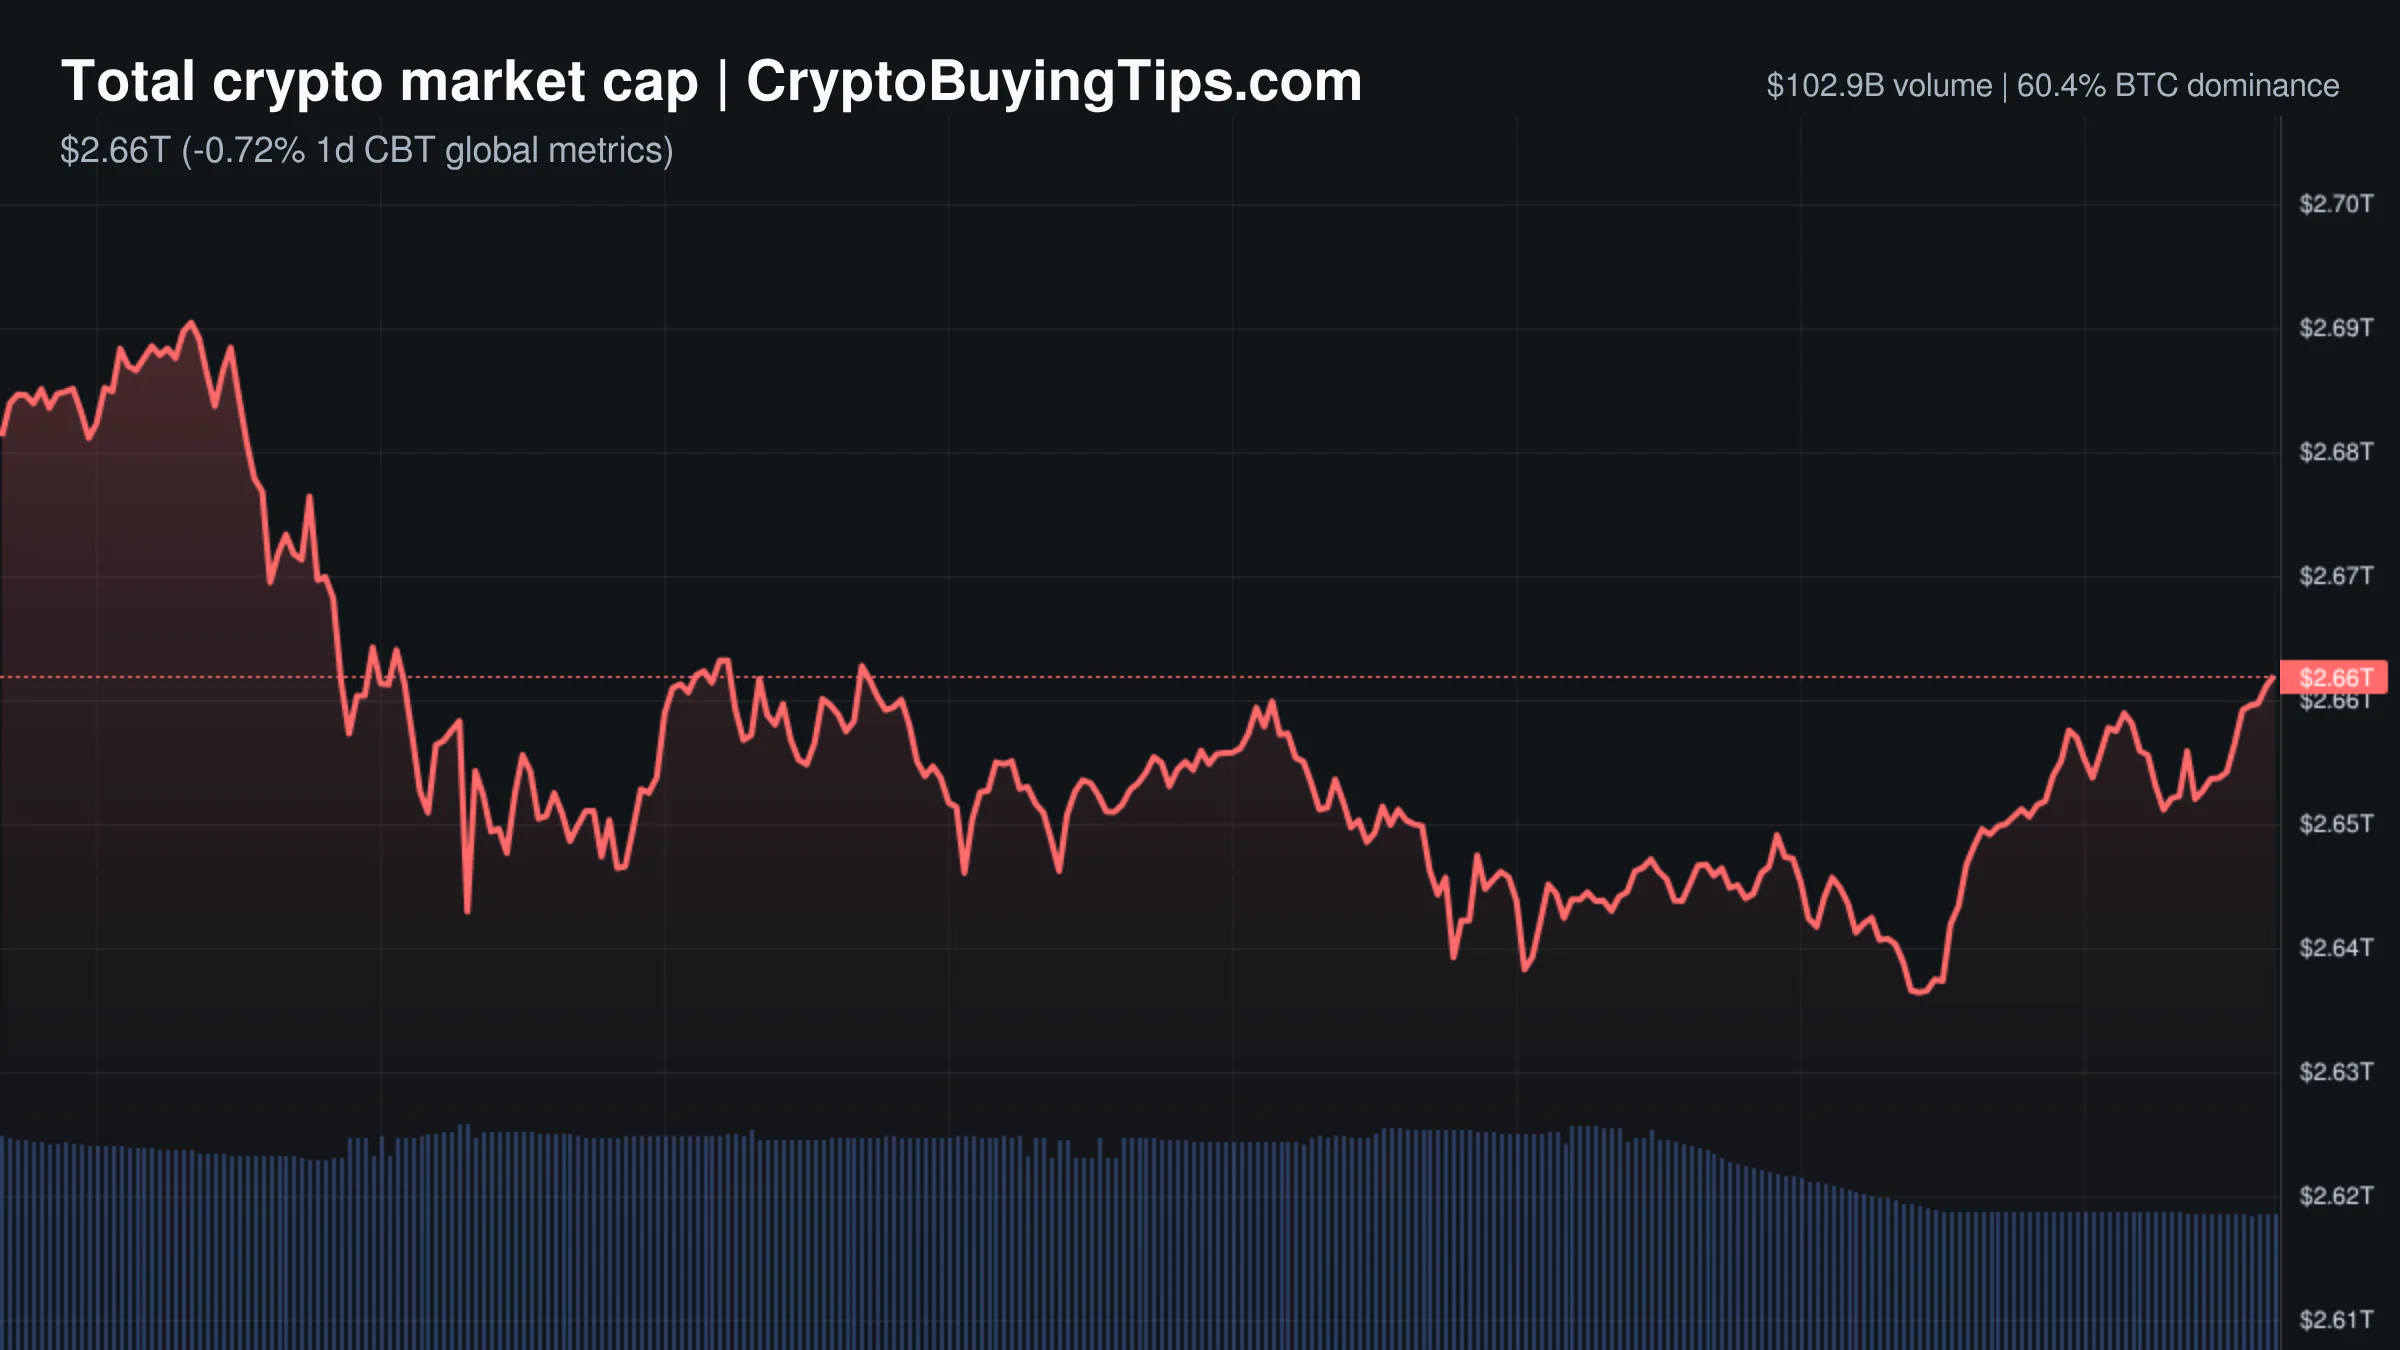
The crypto market is currently in a state of heavy consolidation. Total market cap sits at $2.66T, down 0.76% over the last 24 hours. While the price action looks relatively flat, the underlying liquidity data is more concerning. Trading volume has collapsed by nearly 30%, falling to $102.16B. Even more telling is the 43.12% drop in stablecoin volume. When stablecoin activity dries up this quickly, it usually means traders are stepping aside and waiting for a clear direction rather than deploying capital.

Sentiment is strictly neutral, with the Fear and Greed Index at 48/100. This lack of conviction is visible in the derivatives market. Open interest in perpetuals remains high at $442.6B, but volume in those contracts is down 11.64%. We have a lot of positions open but very little new aggression. This often leads to a "coiled spring" effect where a small move in either direction can trigger a chain of liquidations because the market is too thin to absorb large orders.

The current regime is firmly a Bitcoin season. Bitcoin dominance is at 60.35%, and the Altcoin Season Index is only 42/100. Capital is not rotating into smaller assets. Instead, investors are clinging to the largest asset while the rest of the market drifts. The NASDAQ (QQQ) is slightly down at $694.94, suggesting a general risk-off mood in the broader tech sector that is leaking into crypto.

Bitcoin and Ethereum

Bitcoin daily market structure chart for the crypto market overview

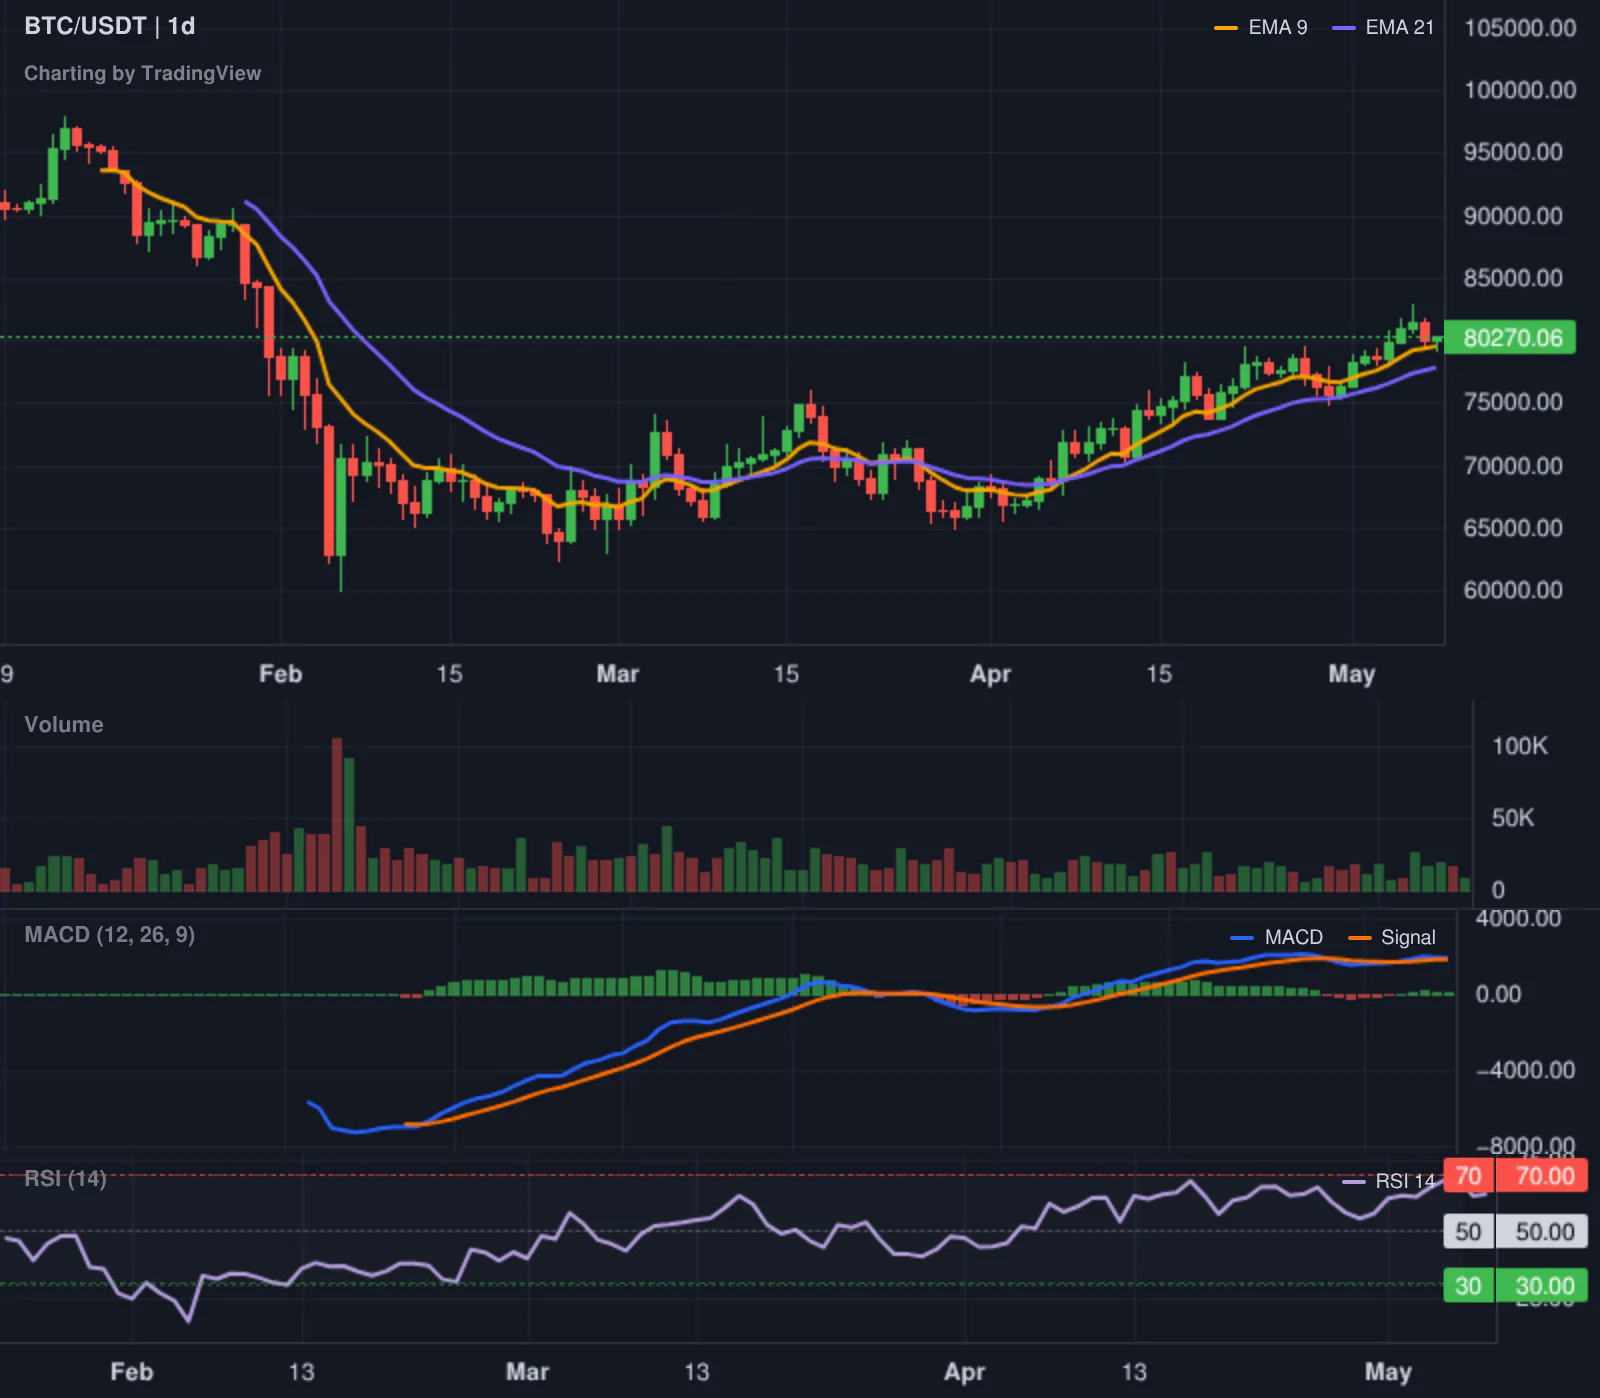
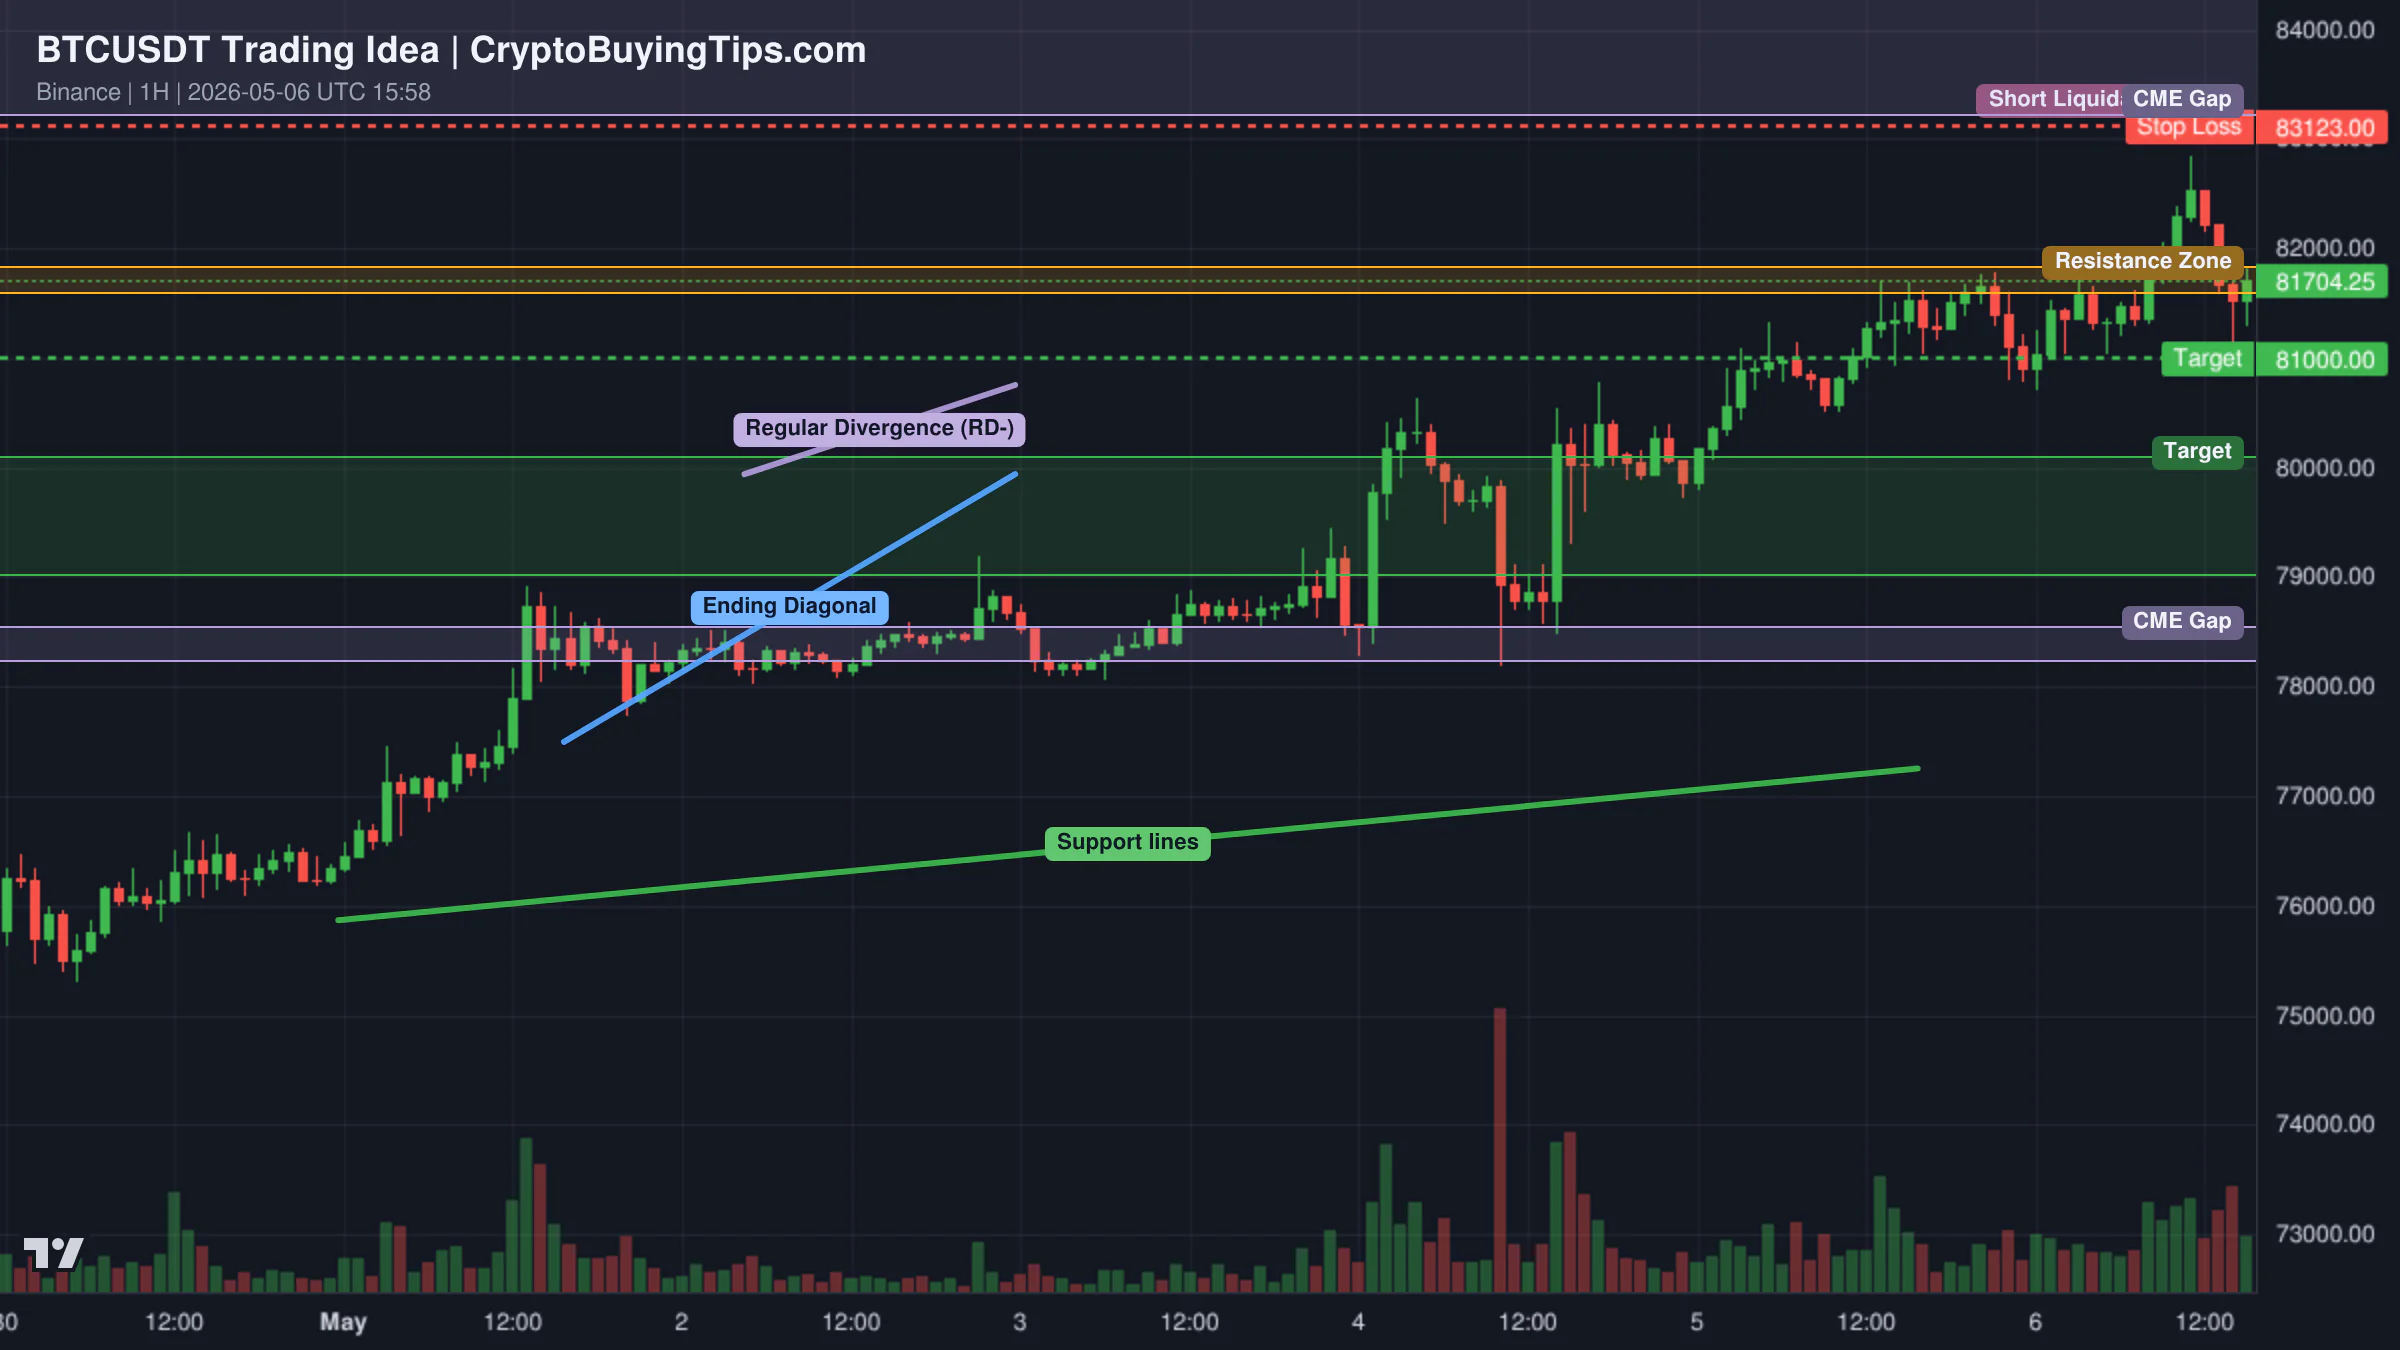
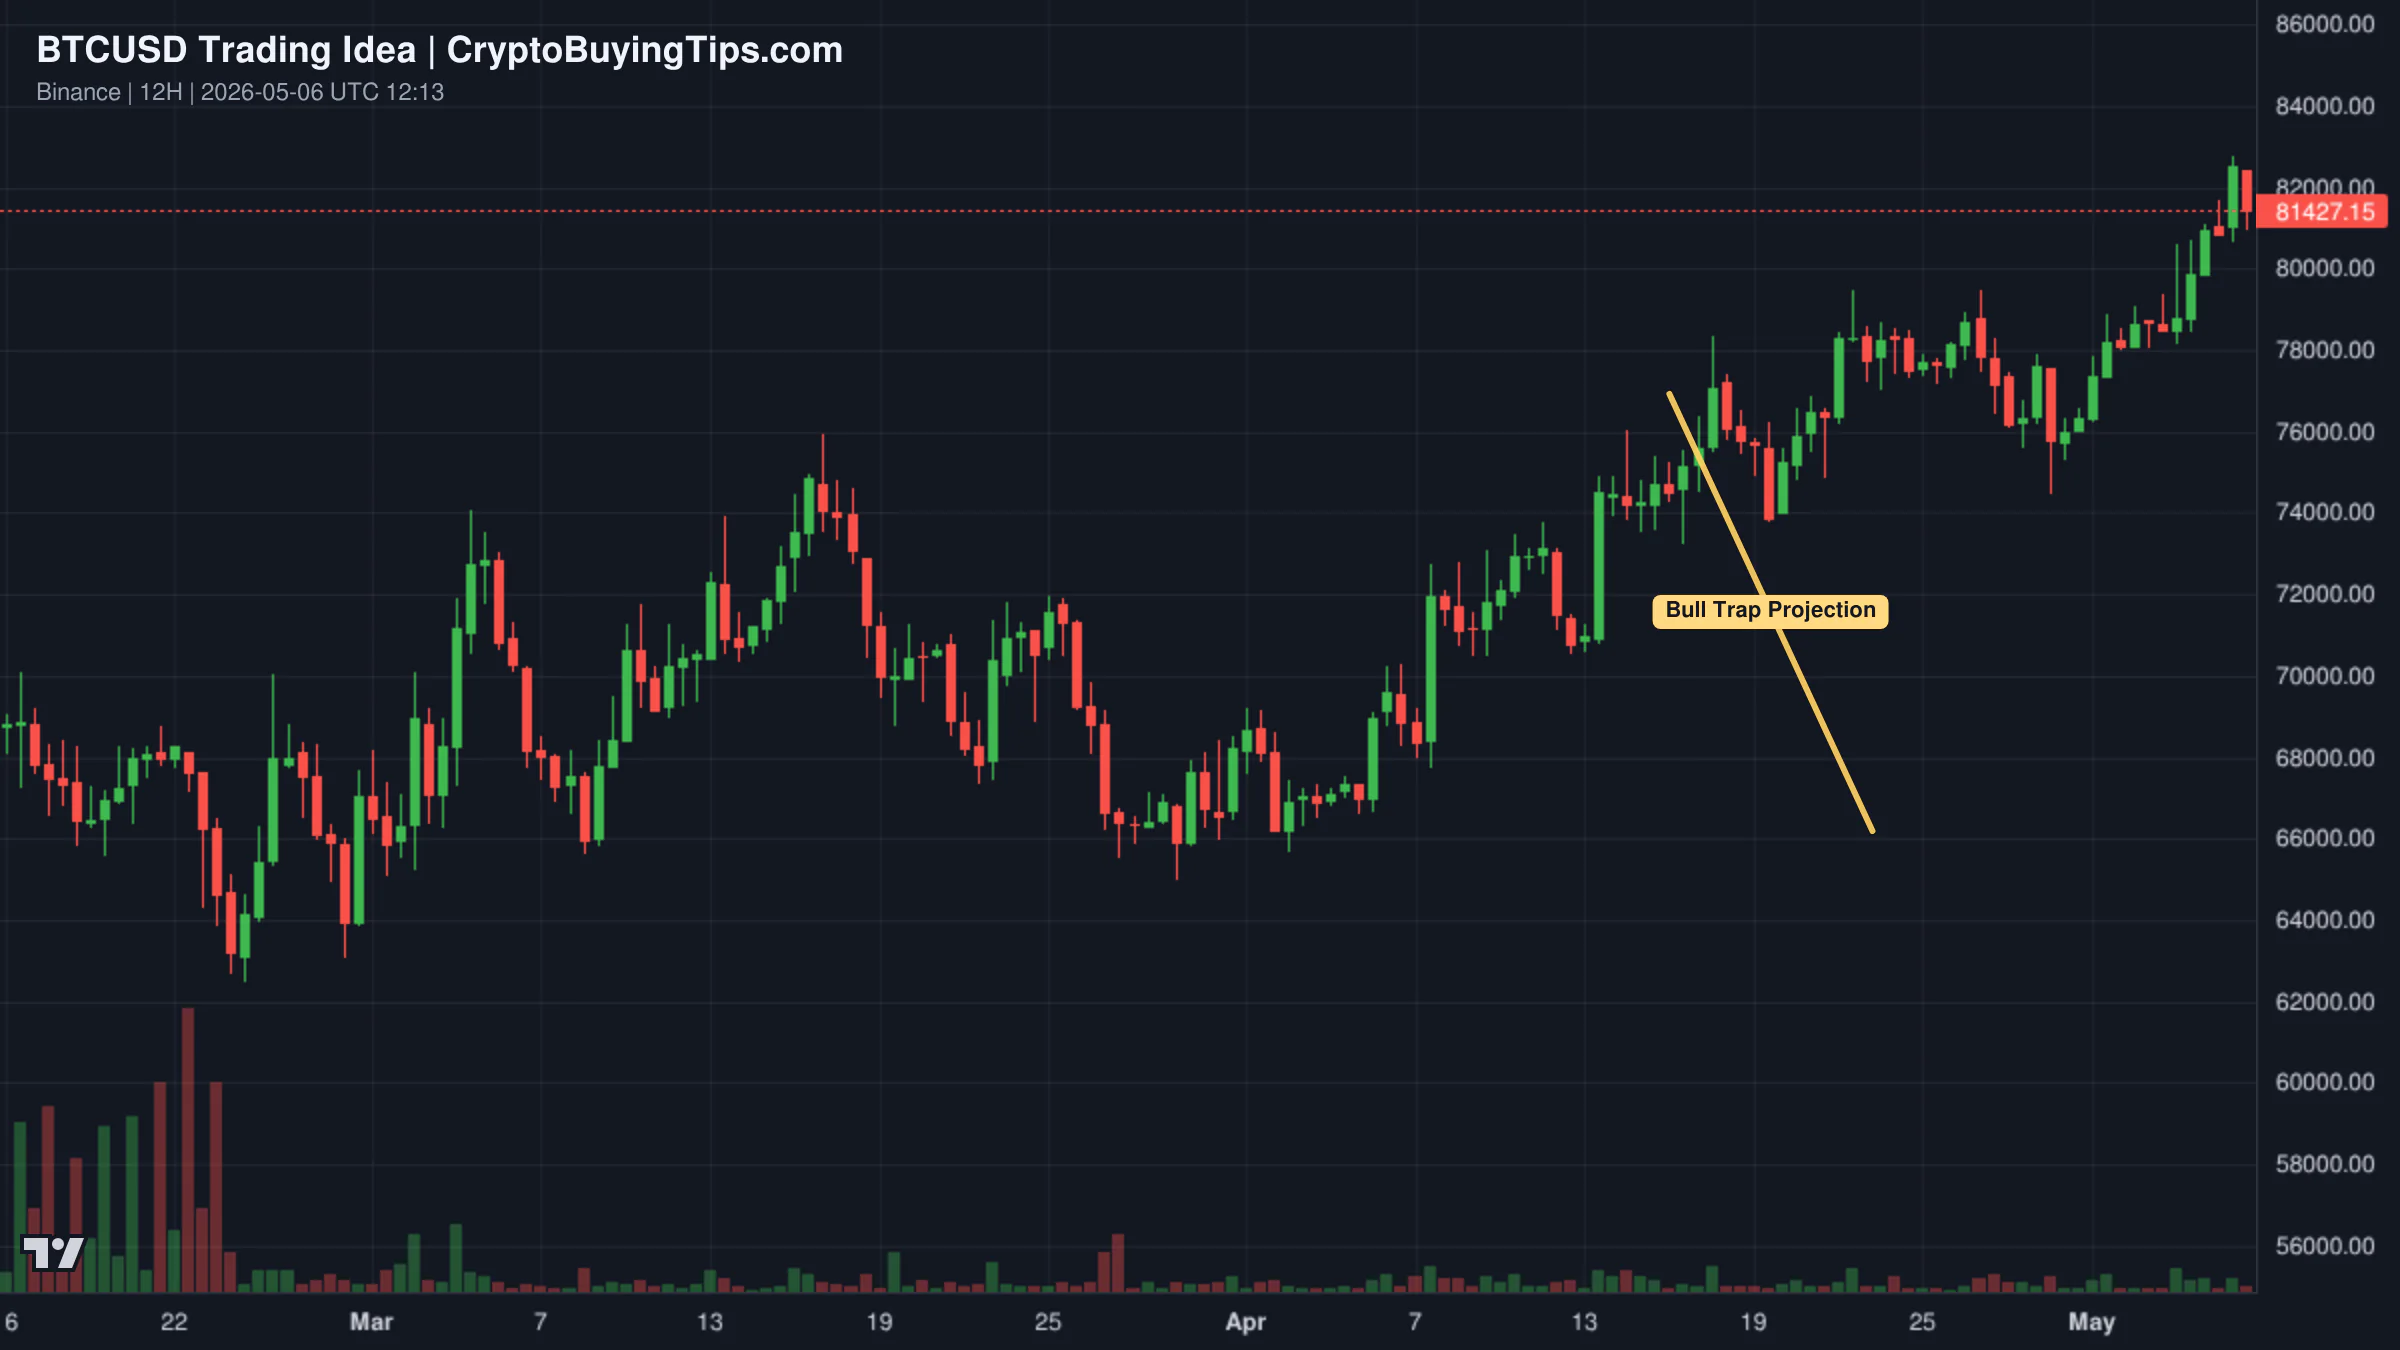
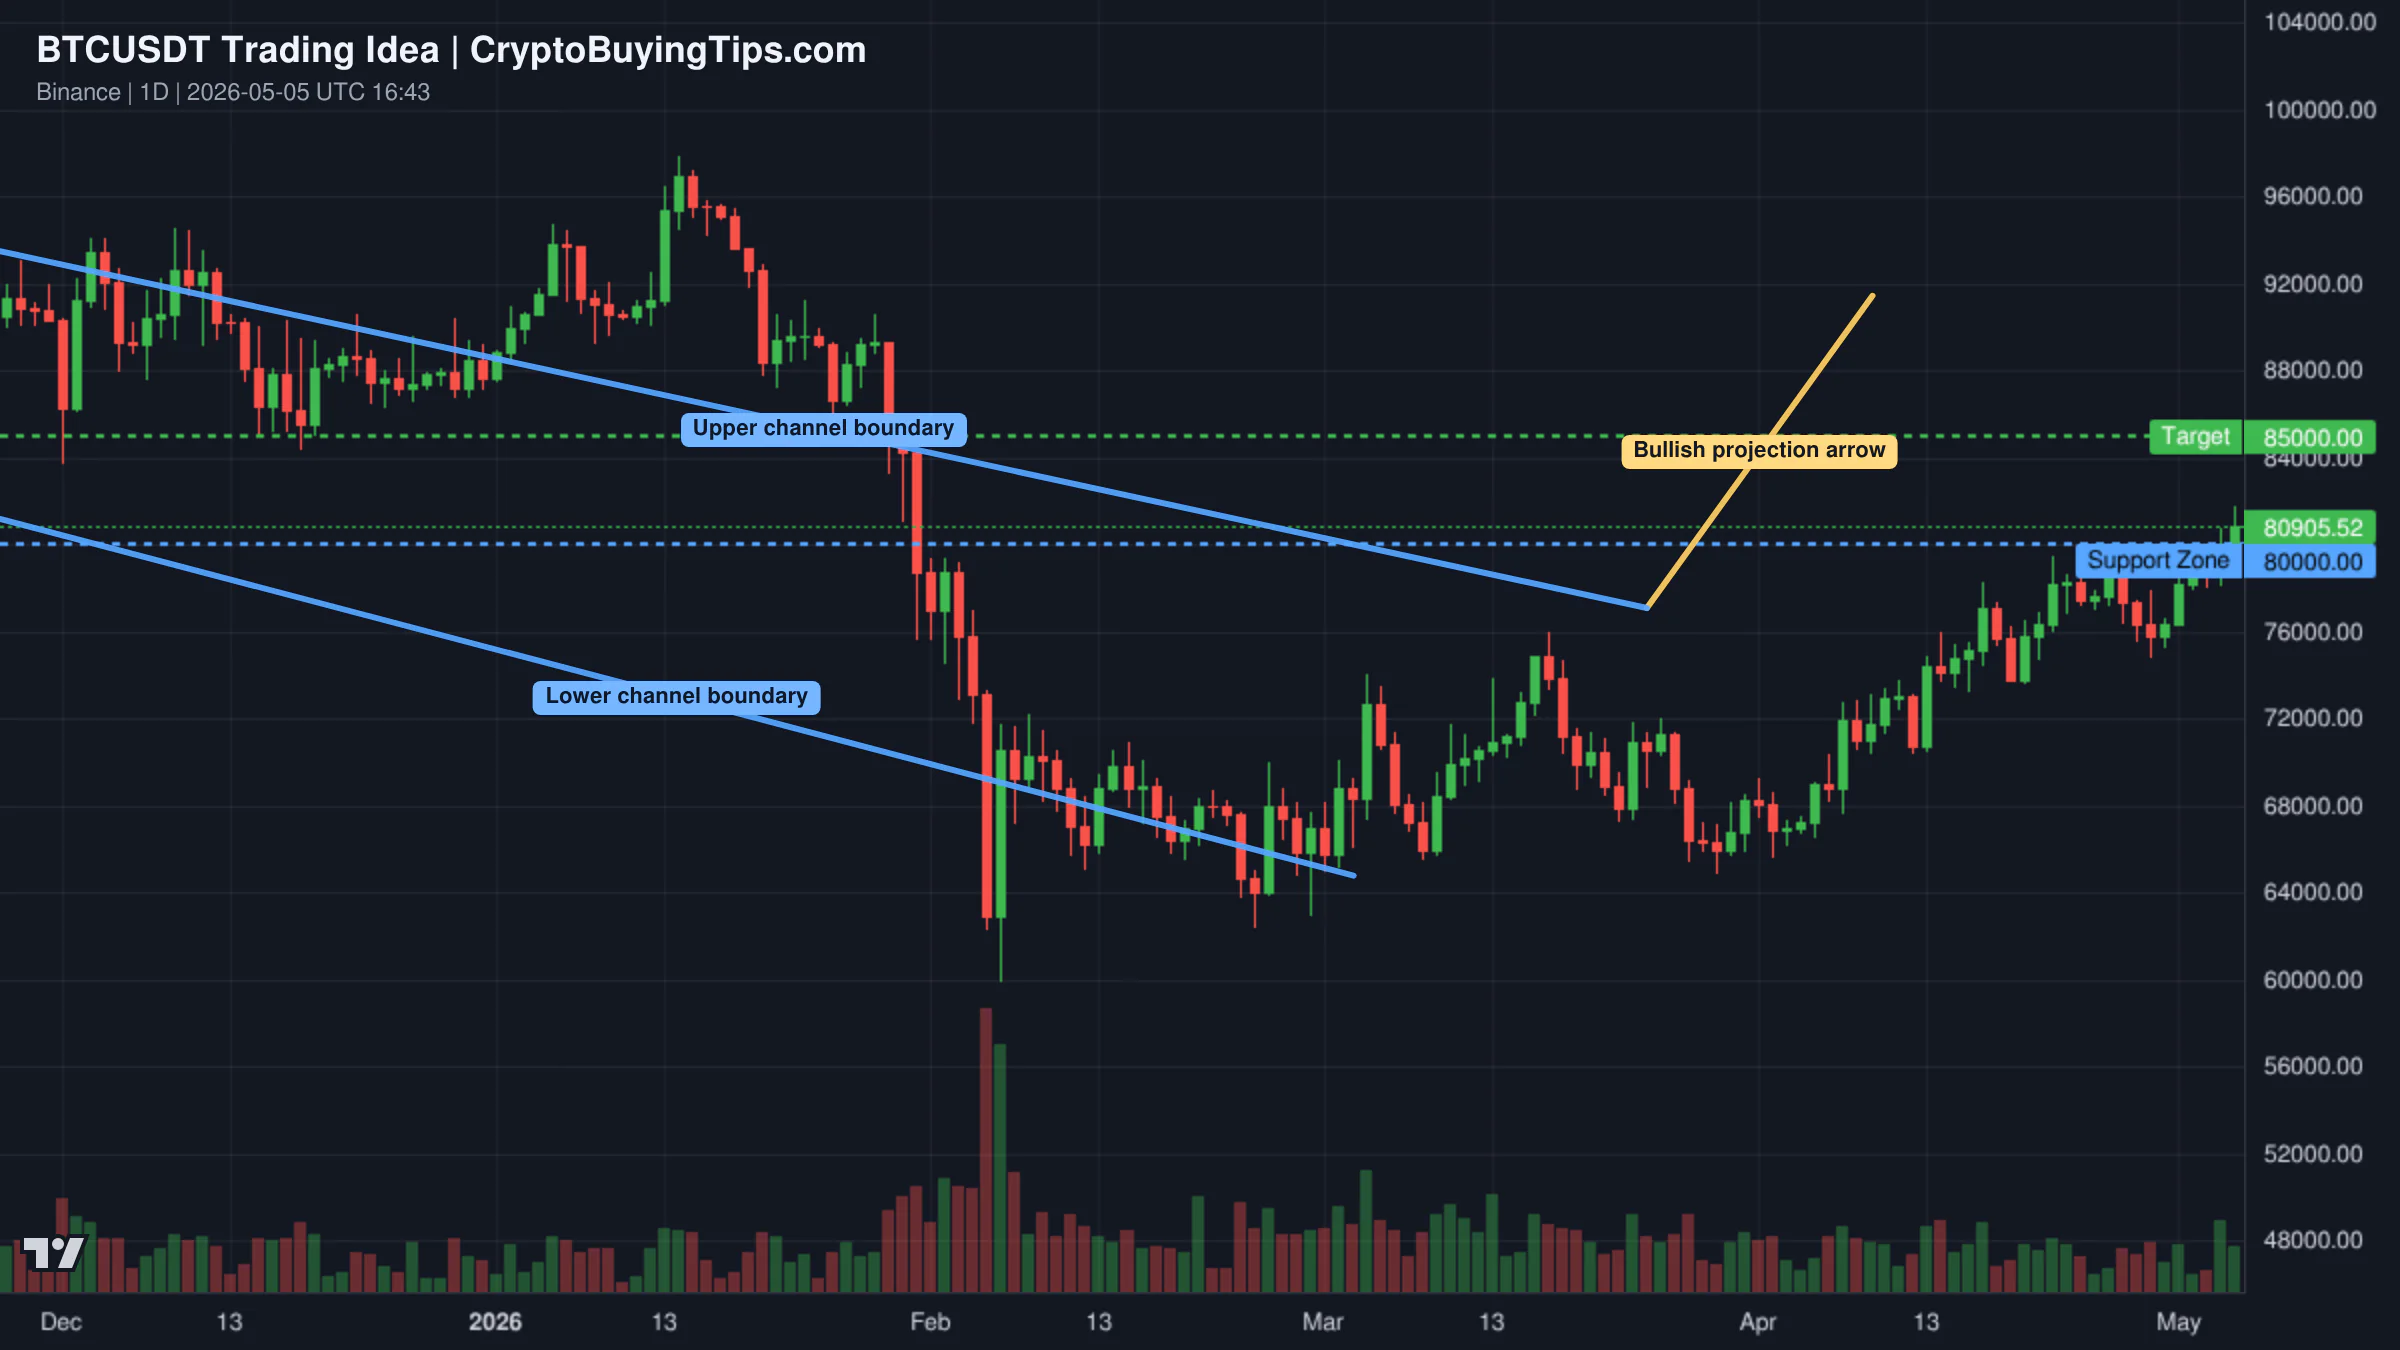
Bitcoin is trading at $76,504.74, showing a slight gain of 0.79% despite the broader market dip. This divergence confirms that Bitcoin is the primary safe haven in the current environment. With a market cap of $1.53T, it is absorbing what little liquidity remains. Implied volatility for Bitcoin is 40.09%, which is relatively low for a market this size. This suggests that the big players are not expecting a massive move in the next few days.

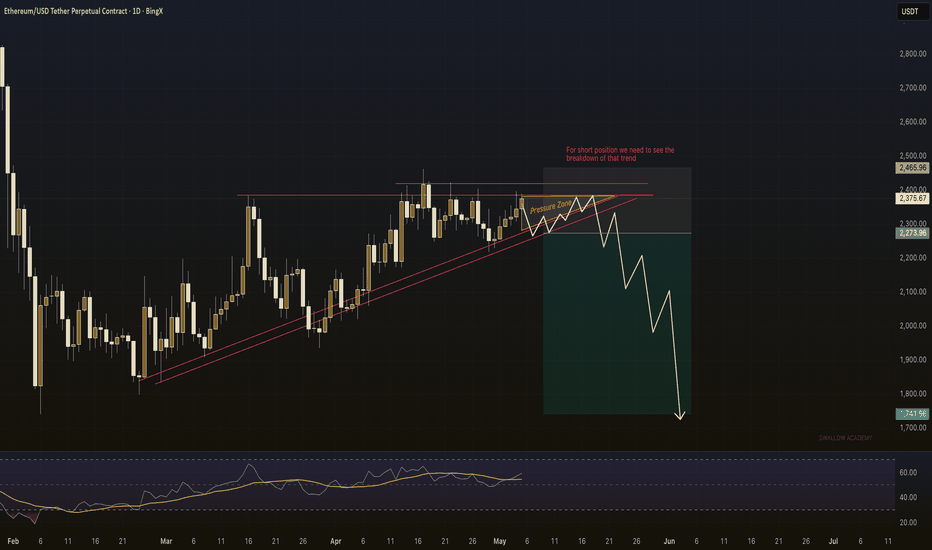
Ethereum is struggling more, priced at $2,261.81 with a marginal 0.15% increase. Ethereum dominance has slipped to 10.38%. A key signal here is the network state. Gas fees are very low, with fast transactions costing only 6.83 Gwei. Low gas fees are usually a sign of low on-chain activity. If the DeFi ecosystem is not seeing a surge in transactions, the fundamental demand for ETH as a gas token drops, which explains why it is underperforming relative to Bitcoin. Implied volatility for Ethereum is higher at 55.86%, meaning traders expect more erratic price swings for ETH than for BTC.

Top crypto prices

The top assets are mostly seeing red or flat movement. XRP is at $1.37, down 0.21%. BNB follows a similar path at $616.14, also down 0.21%. Solana is trading at $83.25, down 0.06%.

One outlier is TRON, which climbed 1.21% to $0.3270. In a market where almost everything is bleeding or stagnant, this kind of move often indicates specific utility demand or a localized rotation. Hyperliquid remains flat at $39.86, holding its ground at a $10.16B market cap.

News driving today's market

There are no major news catalysts available for today. The market is moving almost entirely on technicals and liquidity flows. The primary driver is the massive drop in volume. When 24h volume falls by nearly 30% and stablecoin movement drops by over 40%, it indicates a lack of new buyers. The market is currently digesting previous gains without any fresh news to push it higher.

Social intelligence

Social context is currently unavailable. However, the neutral Fear and Greed score of 48 reflects the general apathy seen across social channels. There is no overwhelming bullishness or panic, just a quiet period of waiting.

What to watch next

The most important metric to watch right now is the stablecoin volume. If stablecoin activity continues to decline, we can expect the market to drift lower or stay in this tight range. A sudden spike in stablecoin volume would be the first real signal that a new trend is starting.

Keep an eye on Bitcoin dominance. As long as it stays around 60%, any attempt at an altcoin rally will likely fail. For a real altcoin season to begin, we need to see dominance drop and the Altcoin Season Index climb toward 75. Until then, the safest bet is to monitor the $76,000 level for Bitcoin. If it loses that support on high volume, the neutral sentiment could quickly turn to fear.

Crypto Market Overview — May 7, 2026
Sigrid Voss·

Crypto Market Overview — May 7, 2026

Market overview

The crypto market is currently in a state of short-term bearishness, characterized by a decline in both total market cap and trading volume. The total market cap sits at $2.77T, down 1.58% over the last 24 hours, while trading volume has dipped to $107.9B. This simultaneous drop in price and activity suggests a lack of conviction among buyers at current levels. A significant red flag is the 13.35% decrease in stablecoin volume, which typically indicates a drop in active trading liquidity or a cautious shift in how capital is being moved.

Sentiment remains neutral, with the Fear and Greed Index holding steady at 49. This lack of emotional extremes often precedes a period of consolidation. While the S&P 500 and NASDAQ are showing strength, with gains of 1.39% and 2.09% respectively, that optimism has not fully trickled down to the crypto markets today. Instead, we see a market that is essentially waiting for a clear catalyst to determine the next direction.

The relationship between Bitcoin and the broader market remains skewed. Bitcoin dominance is high, fluctuating between 58.48% and 60.37% depending on the data source. This confirms we are firmly in a Bitcoin Season. Money is not rotating into altcoins, as the Altcoin Season Index remains neutral at 30 to 41. When Bitcoin holds its value better than the rest of the market during a dip, it shows that investors are treating the flagship asset as a relative safe haven compared to the higher risk of smaller tokens.

Bitcoin and Ethereum

Bitcoin is trading at $76,504.74, showing a slight gain of 0.79%. The price action is heavily influenced by institutional appetite. Spot Bitcoin ETFs have maintained a five-day inflow streak totaling nearly $1.7 billion. This institutional demand is the primary floor for the price, preventing a deeper correction despite the broader market's bearish lean. However, there is a conflict in the narrative. While ETFs are buying, there are reports of potential sales from MicroStrategy to meet corporate obligations, which introduces a layer of uncertainty.

Ethereum is trading at $2,261.81, nearly flat with a 0.15% change. The network context is particularly quiet. ETH gas fees are extremely low at 0.47 Gwei, which is a sign of very low on-chain activity. This lack of utility and network congestion suggests that the current price is not being driven by organic ecosystem growth but rather by macro movements. Ethereum dominance is holding at around 10.14%, reflecting its role as the primary altcoin but highlighting its struggle to regain the momentum seen in previous cycles.

Top crypto prices

The market is seeing a mixed bag of performance among the top assets. Bitcoin remains the clear leader at $76,504.74. Ethereum follows at $2,261.81. XRP is priced at $1.37, down 0.21%, while BNB is at $616.14, also down 0.21%.

Solana is trading at $83.25, showing a marginal decline of 0.06%. TRON is one of the few gainers in the top ten, up 1.21% at $0.3270. Hyperliquid is holding steady at $39.86 with no change in the last 24 hours.

News driving today's market

Institutional adoption is the dominant theme of the week. The most significant news is the collaboration between JPMorgan, Mastercard, and Ripple to settle tokenized US Treasuries on the XRP Ledger. This is a major validation for the protocol. When the world's largest banks use a blockchain for cross-border treasury transfers, it proves the technology is moving from the "experiment" phase to actual utility. This provides a fundamental tailwind for XRP and the broader concept of tokenized real-world assets.

On the regulatory front, the White House has set a July 4 deadline to pass a landmark crypto regulation bill. This introduces a deadline for volatility. While the Coinbase CLO believes the Clarity Act will pass this summer, providing much-needed stability for stablecoins, the Bank of England is opposing unhosted wallet bans. This creates a fragmented regulatory environment where the US may move toward clarity while the UK remains restrictive.

BNY Mellon's expansion of crypto services in Abu Dhabi further reinforces the institutional trend. As the world's largest custody bank, their move into digital asset infrastructure in a crypto-friendly hub like the UAE suggests that the plumbing for institutional capital is being built out globally.

Social intelligence

Geopolitical risk is the primary focus of real-time intelligence. Reports from ISNA and Tasnim News Agency indicate a volatile situation regarding US-Iran relations. There are conflicting reports about whether Iran is discussing an end to the war or rejecting US proposals entirely. This uncertainty is a direct hit to risk sentiment. If tensions escalate in the Strait of Hormuz, we can expect a flight to safety, which often benefits Bitcoin as a hedge, even if it hurts the broader altcoin market.

In the equity-crypto correlation space, AMD shares soared 16% at the open. This surge in semiconductor demand, driven by AI adoption, typically correlates with a positive outlook for AI-related tokens and mining infrastructure. It suggests that the "AI trade" is still very much alive, even if the general crypto market is consolidating.

Trading ideas worth watching

There is a strong focus on BTCUSDT and the CME gap. One analysis suggests that while Bitcoin claimed the 82K CME gap, this could be a bull trap. The logic is that the push above the gap often wipes out late shorts and attracts late longs, creating a liquidity peak. If the price stalls or rejects at this level, it may not be a breakout but a setup for a reversal. Traders should watch the reaction at 82K rather than the fact that it was touched.

Redrawn BTCUSDT 60 trading idea chart for Bitcoin Near the 200_SMA— Will This Test Decide the Next Move?Redrawn BTCUSD 720 trading idea chart for BTC Claimed the 82K CME Gap… But Don’t Get Trapped!!

Another setup for BTCUSDT focuses on the 200-day Simple Moving Average (SMA). There is a negative regular divergence between peaks, suggesting momentum is fading. The target for a potential drop is $81,000, with a deeper liquidation zone between $80,100 and $79,000. A stop loss above $83,123 is suggested for those playing the downside. This trade is closely tied to the S&P 500; if the stock market falters, the 200-SMA test becomes much more likely to fail.

For those looking at altcoins, FETUSDT is being watched for the start of a new bullish cycle. The analysis suggests that the Artificial Superintelligence Alliance has completed a full cycle of bullishness and bearishness, ending with a higher low. The outlook here is long-term growth, though a period of sideways consolidation is expected later this year. This is a play on the AI narrative rather than short-term price action.

Altcoin Spotlight

XRP deserves attention today due to the high-impact news regarding the XRP Ledger. The fact that JPMorgan and Mastercard are using the ledger for tokenized US Treasury transfers is a fundamental shift. This is not just a price pump based on a tweet; it is a functional use case by the most powerful financial institutions in the world. While the price has remained relatively flat at $1.37, the underlying utility is increasing, which often leads to a delayed but sustained price correction upward.

What to watch next

The market is currently caught between two opposing forces: massive institutional inflows via ETFs and growing geopolitical instability. The immediate focus is on the 82K level for Bitcoin. If the market can hold this as support, the path toward $85,000 remains open. However, if the 200-day SMA is broken, we could see a rapid descent toward the $79,000 liquidation zone.

Beyond the charts, the July 4 regulatory deadline from the White House is the next major macro event. Any leak or draft of the legislation will likely cause a spike in volatility. Traders should also keep a close eye on the stablecoin volume; if it continues to drop, it indicates that the "dry powder" is not being deployed, which would be a bearish sign for an altcoin season. For now, the market remains in a neutral holding pattern, waiting for either a geopolitical resolution or a regulatory breakthrough.

Crypto Market Overview — May 6, 2026
Sigrid Voss·

Crypto Market Overview — May 6, 2026

Market overview

The total crypto market cap sits at $2.81T, reflecting a modest 24h increase of 1.90%. While the surface level suggests a bullish lean, the underlying structure reveals a market heavily dependent on leverage. Derivatives volume has reached $867.27B, dwarfing the $158.68B in spot volume. This disparity indicates that current price action is being driven more by speculative positioning than by organic spot accumulation.

Sentiment remains neutral with a Fear and Greed Index score of 52. This lack of extreme conviction coincides with a consolidation phase. Bitcoin dominance is high at 58.56%, and the Altcoin Season Index at 24 confirms that the market is firmly in a Bitcoin season. Capital is not yet rotating into smaller assets, as evidenced by the Total3 market cap remaining at $872.4B.

Macro correlations remain tight. The S&P 500 and NASDAQ both posted gains of 0.80% and 1.30% respectively, suggesting a general risk-on mood in traditional finance that is providing a tailwind for digital assets. However, the high implied volatility for Ethereum at 57.00 compared to Bitcoin at 41.30 suggests traders expect more violent swings from the second largest asset.

Bitcoin and Ethereum

Bitcoin is trading at $76,504.74. Despite the price being below the $80,000 psychological mark, there is significant institutional support. Recent reports indicate a surge in ETF investments after a brief period of outflows. This institutional floor is keeping the asset stable, though the market is weighing this against new corporate strategies. Strategy Inc. recently outlined principles that include selling Bitcoin when advantageous, which introduces a potential source of institutional selling pressure.

Ethereum is priced at $2,261.81. The network is currently seeing extremely low gas fees, with fast transactions costing only 0.22 Gwei. This suggests a significant drop in on-chain demand or congestion, which is a mixed signal. While low fees are good for users, they often reflect a lack of active DeFi engagement. This lack of activity is compounded by reports of a massive whale moving 60,000 ETH to a Binance wallet, a move that typically signals an intention to sell and puts immediate pressure on the price.

Top crypto prices

Bitcoin leads the market at $76,504.74 with a 0.79% increase. Ethereum follows at $2,261.81, up 0.15%. XRP is trading at $1.37, down 0.21%. BNB is at $616.14, also down 0.21%. Solana is priced at $83.25, showing a slight decrease of 0.06%. TRON has gained 1.21% to reach $0.3270. Hyperliquid remains flat at $39.86.

News driving today's market

Institutional adoption is moving into the tokenization phase. Coinbase has taken an equity stake in Centrifuge to expand tokenized ETFs and credit products. Similarly, State Street and Galaxy have launched a tokenized fund for on-chain cash management. These moves suggest that the "mainstreaming" of crypto is shifting from simple price speculation to the actual migration of financial infrastructure onto the blockchain.

The Solana ecosystem is seeing a major corporate win with Western Union launching USDPT, a dollar-backed stablecoin. This could fundamentally change how the company handles settlements and likely increases the utility of the Solana network.

However, the DeFi sector is struggling with security. The Drift protocol is currently attempting to recover $295 million following a DPRK-linked exploit. Meanwhile, victims of an Aave hack are attempting to reframe the theft as fraud to gain legal title to stolen assets. These events, combined with a lawsuit against Coinbase regarding the return of $55 million in stolen funds, highlight a growing tension between the promise of "code is law" and the reality of legal recovery in the wake of massive exploits.

Social intelligence

Geopolitical risk is currently a primary concern for macro traders. Reports indicate a potential pause in the movement of ships through the Strait of Hormuz between the US and Iran. Any disruption to oil shipping typically triggers volatility across all risk assets, including crypto.

On-chain data is flashing warnings for Ethereum. As mentioned, the transfer of 60,000 ETH to Binance is a high-conviction signal for potential downside. Simultaneously, reports of a $361 million hack at Binance involving BNB and USDC add a layer of exchange-side risk that could trigger panic selling if not handled transparently.

Interestingly, whale activity is shifting toward AI-related equities. On-chain analysts have spotted a fresh wallet aggressively longing Micron (MU) on Hyperliquid, suggesting that some "smart money" is hedging crypto positions with high-conviction bets on the hardware side of the AI trade.

Trading ideas worth watching

A bearish setup is forming for ETHUSDT on the daily timeframe. The price is currently squeezed between horizontal resistance near 2,400 and a rising trendline. A clean daily close below the trendline support at 2,274 would confirm a market structure shift to the downside. In this scenario, the first target is the 2,000 psychological level, with a final objective of 1,742. The trade is invalidated if the price closes above 2,465.

Trading idea chart: ETHUSDT.P - ETHUSD – Bearish Breakdown Setup Forming, Eyes on 1,742

Conversely, some analysts see a new bull season for BTCUSDT. This view is based on a confirmed breakout above $80,000, which has now established a fresh support zone. If this structure holds, the immediate target is $85,000, with a medium-term objective of $106,000. The strength of this move depends on sustained buying pressure and the avoidance of a deep retest of the breakout zone.

Redrawn BTCUSDT 1D trading idea chart for Bitcoin new bull season started

For ETHUSDT, there is a competing bullish thesis. This view suggests that Ethereum has broken a major channel resistance and is now climbing a new ascending channel. If the price can break the current channel resistance and clear the $3,000 mark, it could trigger a move toward a new all-time high.

Smart Money Signals — Hyperliquid Leaderboard

Hyperliquid LONG NEAR leaderboard chartHyperliquid LONG TON leaderboard chart

High-ROI traders on Hyperliquid are currently positioning for a bounce in select altcoins. A trader with a 151% 30-day ROI has opened a long position in NEAR at $1.4383. Another trader, boasting a 123% 30-day ROI, has entered a long on TON at $2.1033.

The most aggressive move comes from a trader with a 284% all-time ROI, who has deployed $8,200 into a long position for PURR at $0.085. These positions suggest that while the broader market is in a Bitcoin season, top performers are selectively betting on ecosystem leaders and high-momentum tokens.

Altcoin Spotlight

Solana deserves attention today due to the convergence of fundamental and technical catalysts. Despite a slight 24h dip, the launch of Western Union's USDPT stablecoin provides a massive fundamental utility boost. Furthermore, the Drift protocol's transparent plan to repay users after its $295 million hack is helping the ecosystem recover its reputation. With a 5.48% gain noted in recent activity, Solana is showing more relative strength than Ethereum in the current environment.

What to watch next

The immediate focus is on the $80,000 level for Bitcoin. Whether this becomes a permanent floor or a failed breakout will determine if the market enters a true "new bull season" or returns to a wider consolidation range.

For Ethereum, the critical trigger is the 2,274 support level. A break here, combined with the potential selling pressure from the 60,000 ETH Binance transfer, could lead to a rapid decline toward 2,000.

Finally, keep a close eye on the Strait of Hormuz. Geopolitical instability in that region often overrides technical analysis, and any escalation could force a "risk-off" liquidation event across both traditional and crypto markets.