Market Overviews

Daily crypto market overviews, trend analysis, and key updates from our editorial team.

Crypto Market Overview | leverage spikes amid spot slide and derivatives volume surge | July 28, 2026
Sigrid Voss·

Crypto Market Overview | leverage spikes amid spot slide and derivatives volume surge | July 28, 2026

Market overview

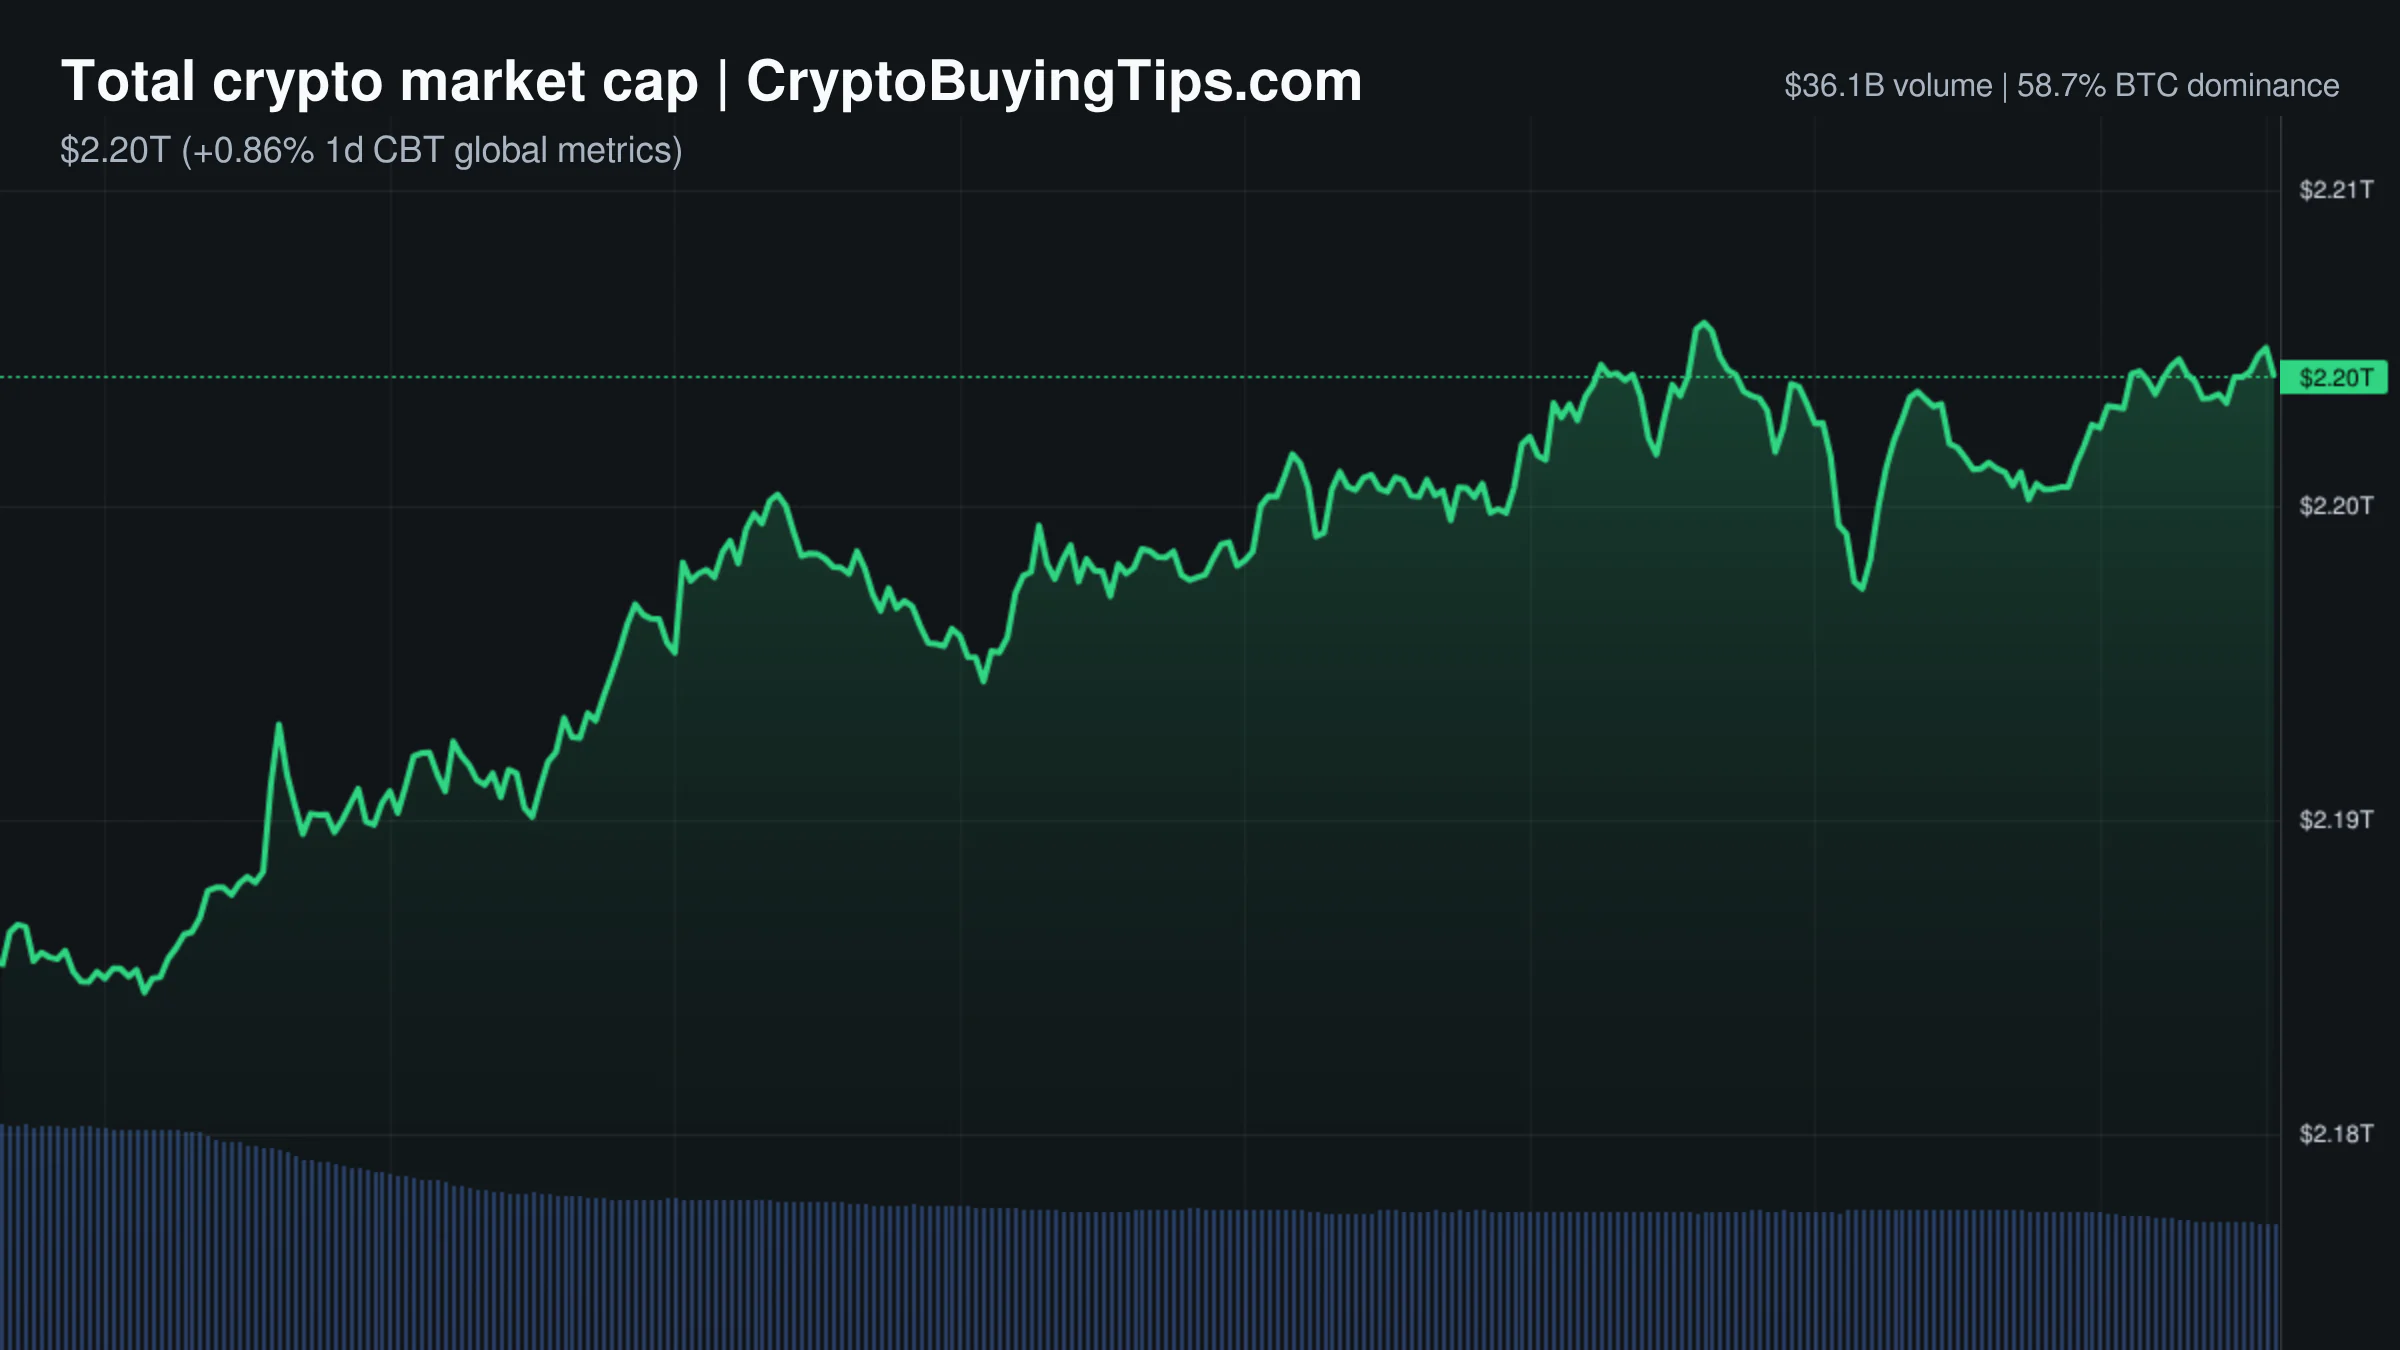
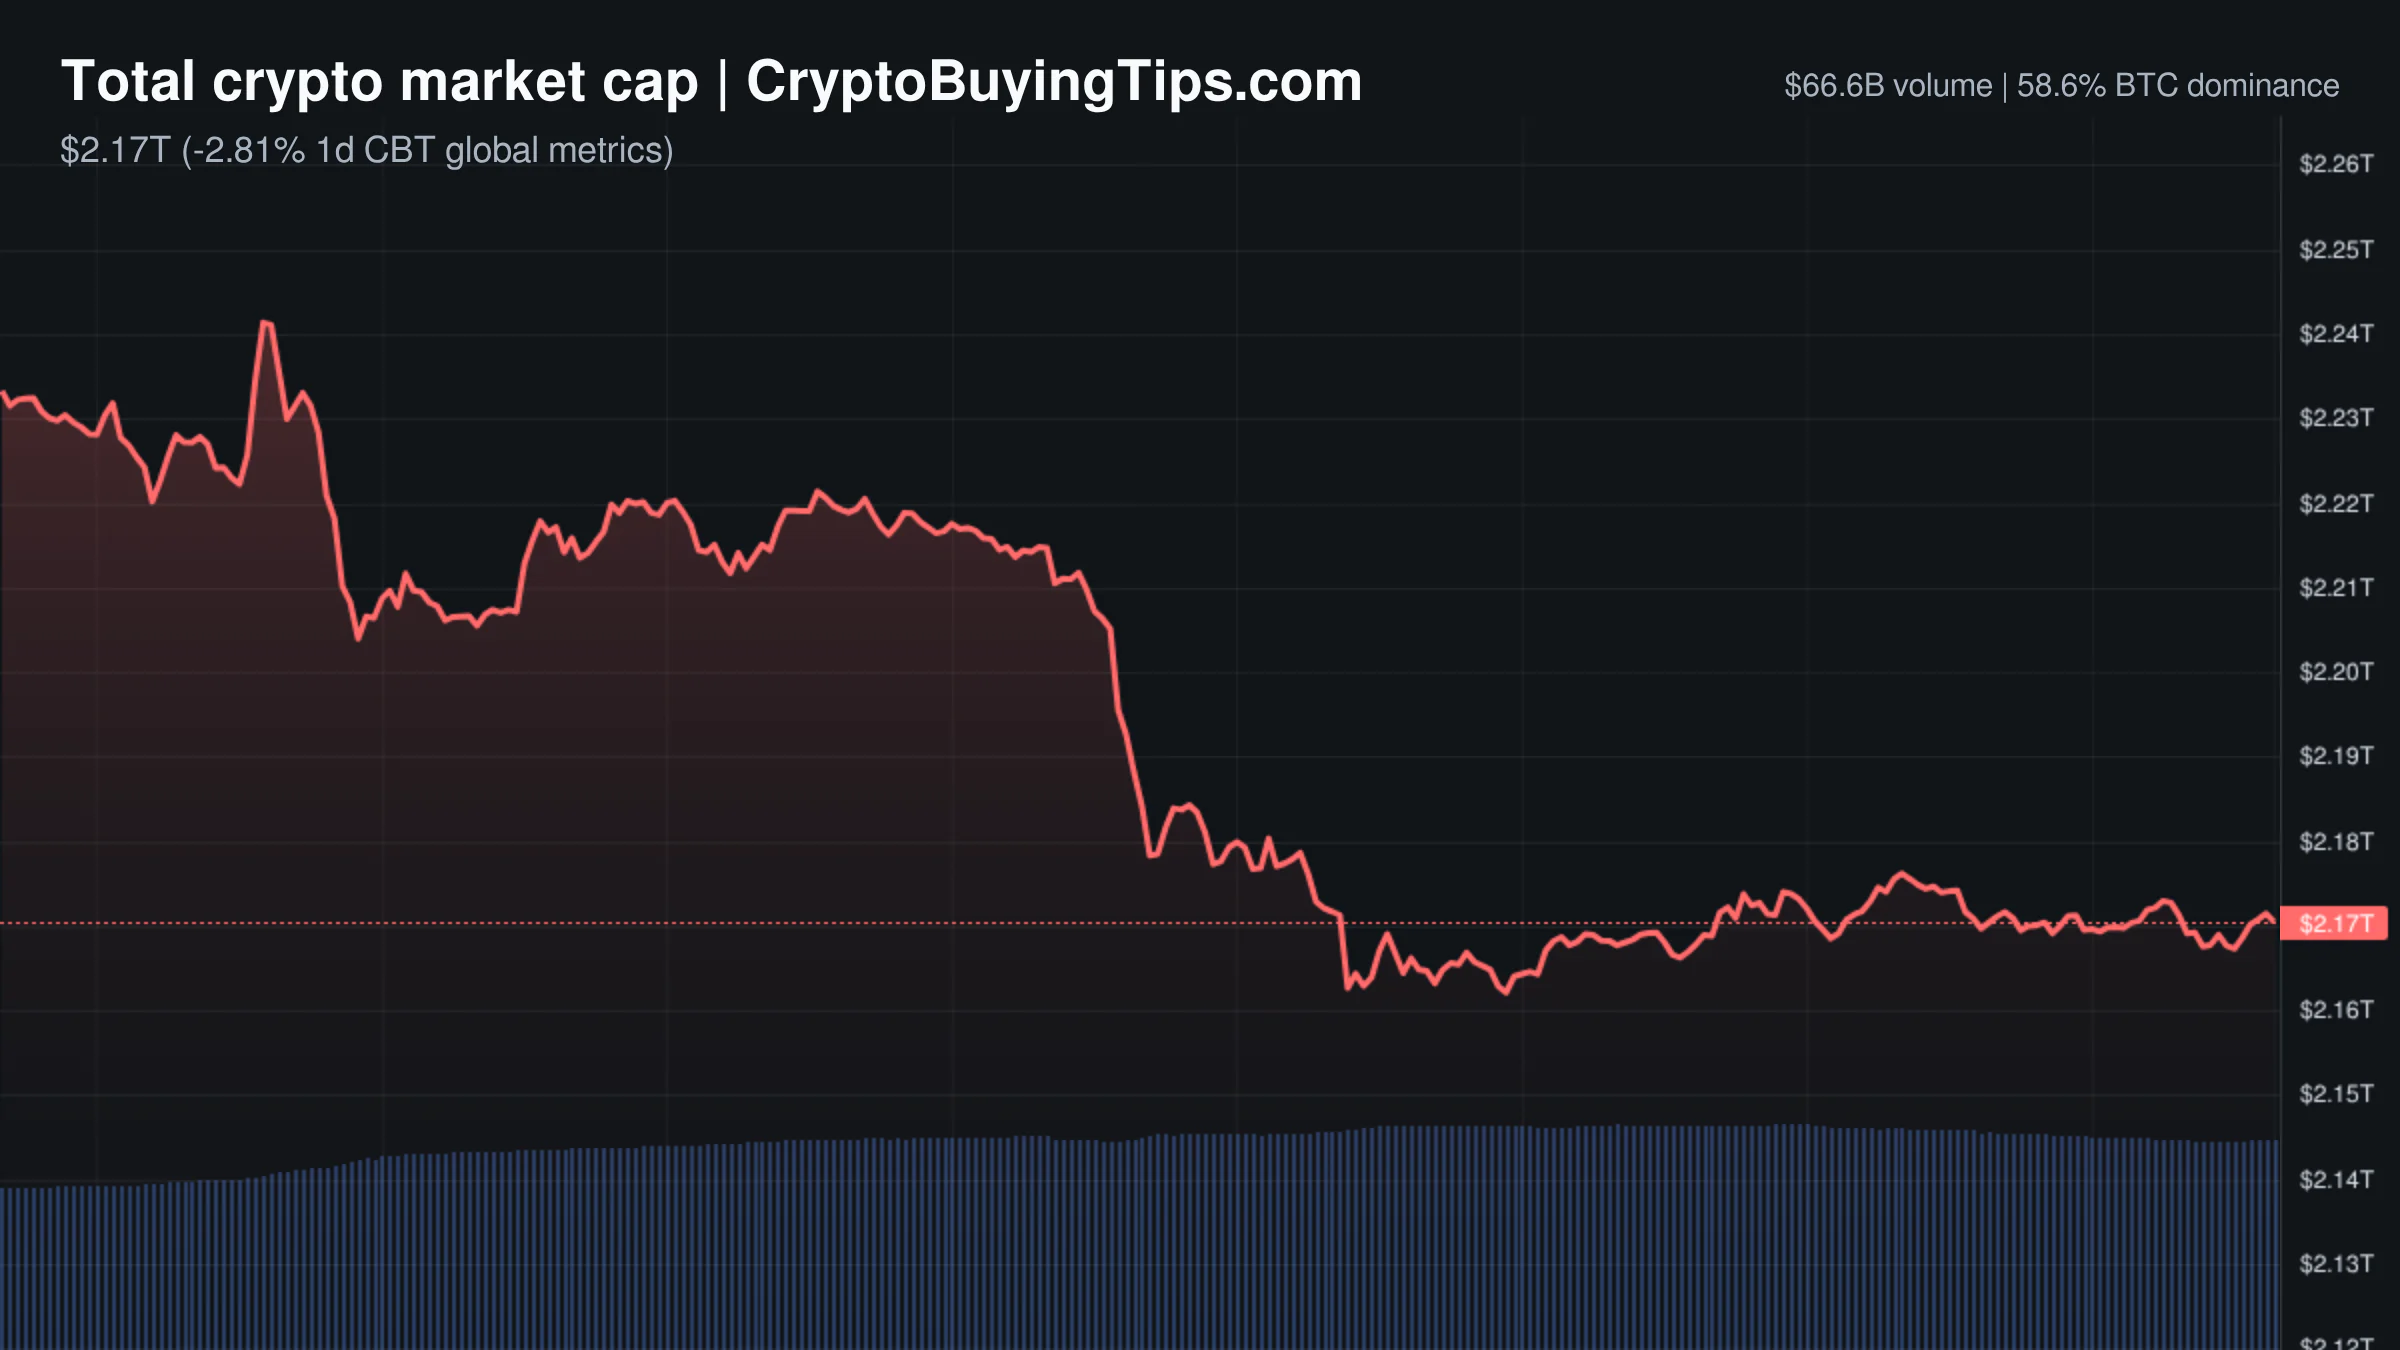
The crypto market is currently experiencing a textbook leverage flush. While the total market cap contracted by 2.80% to settle around $2.17T, the underlying activity suggests a desperate struggle between leveraged longs and opportunistic shorts. The most telling metric is the divergence between spot and derivatives volume. 24h derivatives volume has surged 45.64% to $688.65B, which is more than ten times the spot volume of $66.53B. When derivatives activity dwarfs spot trading to this extent, price action is usually driven by liquidations and hedging rather than genuine accumulation.

Sentiment has shifted firmly into "Fear" with a Fear and Greed Index score of 34. This coincides with a broader risk-off mood in traditional markets, where the NASDAQ fell 0.31% and global chip stocks are seeing a deep selloff. Bitcoin dominance remains high at 58.63%, suggesting that while the entire market is bleeding, capital is clinging to the largest asset for safety. The Altcoin Season Index sits at 52, a neutral reading that confirms the market is in a holding pattern. We are seeing a scenario where traders are using high leverage to fight a downtrend, which often leads to the kind of disorderly volatility we are seeing today.

Bitcoin and Ethereum

Bitcoin is currently trading at $63,434.05, down 2.84% over the last 24 hours. The asset is testing a key psychological and technical floor around the $63,000 mark. The lack of significant institutional ETF flow data today leaves a vacuum that is being filled by derivatives volatility. The price action is currently a battle between the $63,000 buyer zone and a descending resistance line near $65,000.

Ethereum has had a worse day, dropping 4.48% to $1,878.36. The asset is struggling with a lack of immediate catalysts and a continuing slide in dominance, which now sits at 10.44%. On the technical side, Lido is moving $16.5 billion in staked ether to consolidate validators and reduce the total count by a third. While this is a positive move for network efficiency and long-term stability, the market is currently too focused on immediate liquidity to care about validator optimization.

Top crypto prices

Bitcoin (BTC) is at $63,434.05, down 2.84%.

Ethereum (ETH) is at $1,878.36, down 4.48%.

BNB (BNB) is at $565.95, down 1.21%.

XRP (XRP) is at $1.05, down 4.74%.

Solana (SOL) is at $73.19, down 4.35%.

TRON (TRX) is at $0.3258, down 1.43%.

Hyperliquid (HYPE) is at $54.73, down 9.23%.

News driving today's market

The primary narrative today is the escalating war between the CME Group and the CFTC. The CME is suing its own regulator over the decision to allow blockchain-based perpetual futures on platforms like Coinbase and Kalshi. It is a rare and somewhat comical sight to see the largest derivatives exchange in the U.S. fighting the government to protect its monopoly on futures contracts. This conflict highlights the growing tension as "perps" move from the fringes of DeFi into the regulated Wall Street fold.

The institutional appetite for these products is evident, with Bank of America estimating annual perpetual futures volume at $90 trillion. This suggests that while the regulators and exchanges are fighting in court, the actual capital is moving toward these instruments. We have previously noted how volume data suggests fight in the broader market, and this derivatives war is the latest example of that friction.

In other news, the Hong Kong Monetary Authority is pushing a quantum-preparedness index to protect tokenized deposits from future computing threats. This is a long-term institutional play that suggests Hong Kong is building for a decade, not a quarter. Meanwhile, prediction markets have scored a partial win as a judge blocked a ban on these markets in Minnesota. This provides some regulatory breathing room for platforms like Polymarket. Given the current climate of fear, we believe that rising stablecoin dominance in crypto is the only real hedge for retail traders while these legal battles play out.

Social intelligence

The social mood is heavily weighed down by geopolitical escalation. Reports from the Kremlin regarding the "special military operation" and accusations of attacks on gas pipelines are creating a risk-off environment. When geopolitical tensions spike, the "digital gold" narrative for Bitcoin often fails to materialize in the short term, as traders simply move to cash.

This is compounded by a global chip selloff. South Korea's Kospi plunged 10% and Japan's Nikkei fell 4% due to concerns over AI spending and China's technological progress. Since the crypto market has become increasingly correlated with AI and tech stocks, this selloff is acting as a drag on prices. The market is effectively pricing in a "tech winter" alongside a geopolitical crisis, which is a poor recipe for a bullish day.

On a more boring but regulatory-positive note, Nexo is utilizing German MiCAR-licensed partners for its EEA custody. This is a standard compliance move, but it shows that the era of "move fast and break things" is being replaced by a slow, bureaucratic slog through European regulations.

Trading ideas worth watching

There is a strong bullish setup for BTCUSDT based on a channel bounce. Bitcoin has retested the lower support floor of an ascending channel near $63,200. The data shows that institutional buy orders stepped in to absorb the selling pressure right at this level. The target for this trade is the horizontal resistance line around $65,800. The risk is a four-hour close below $62,800, which would invalidate the channel and likely trigger another wave of liquidations.
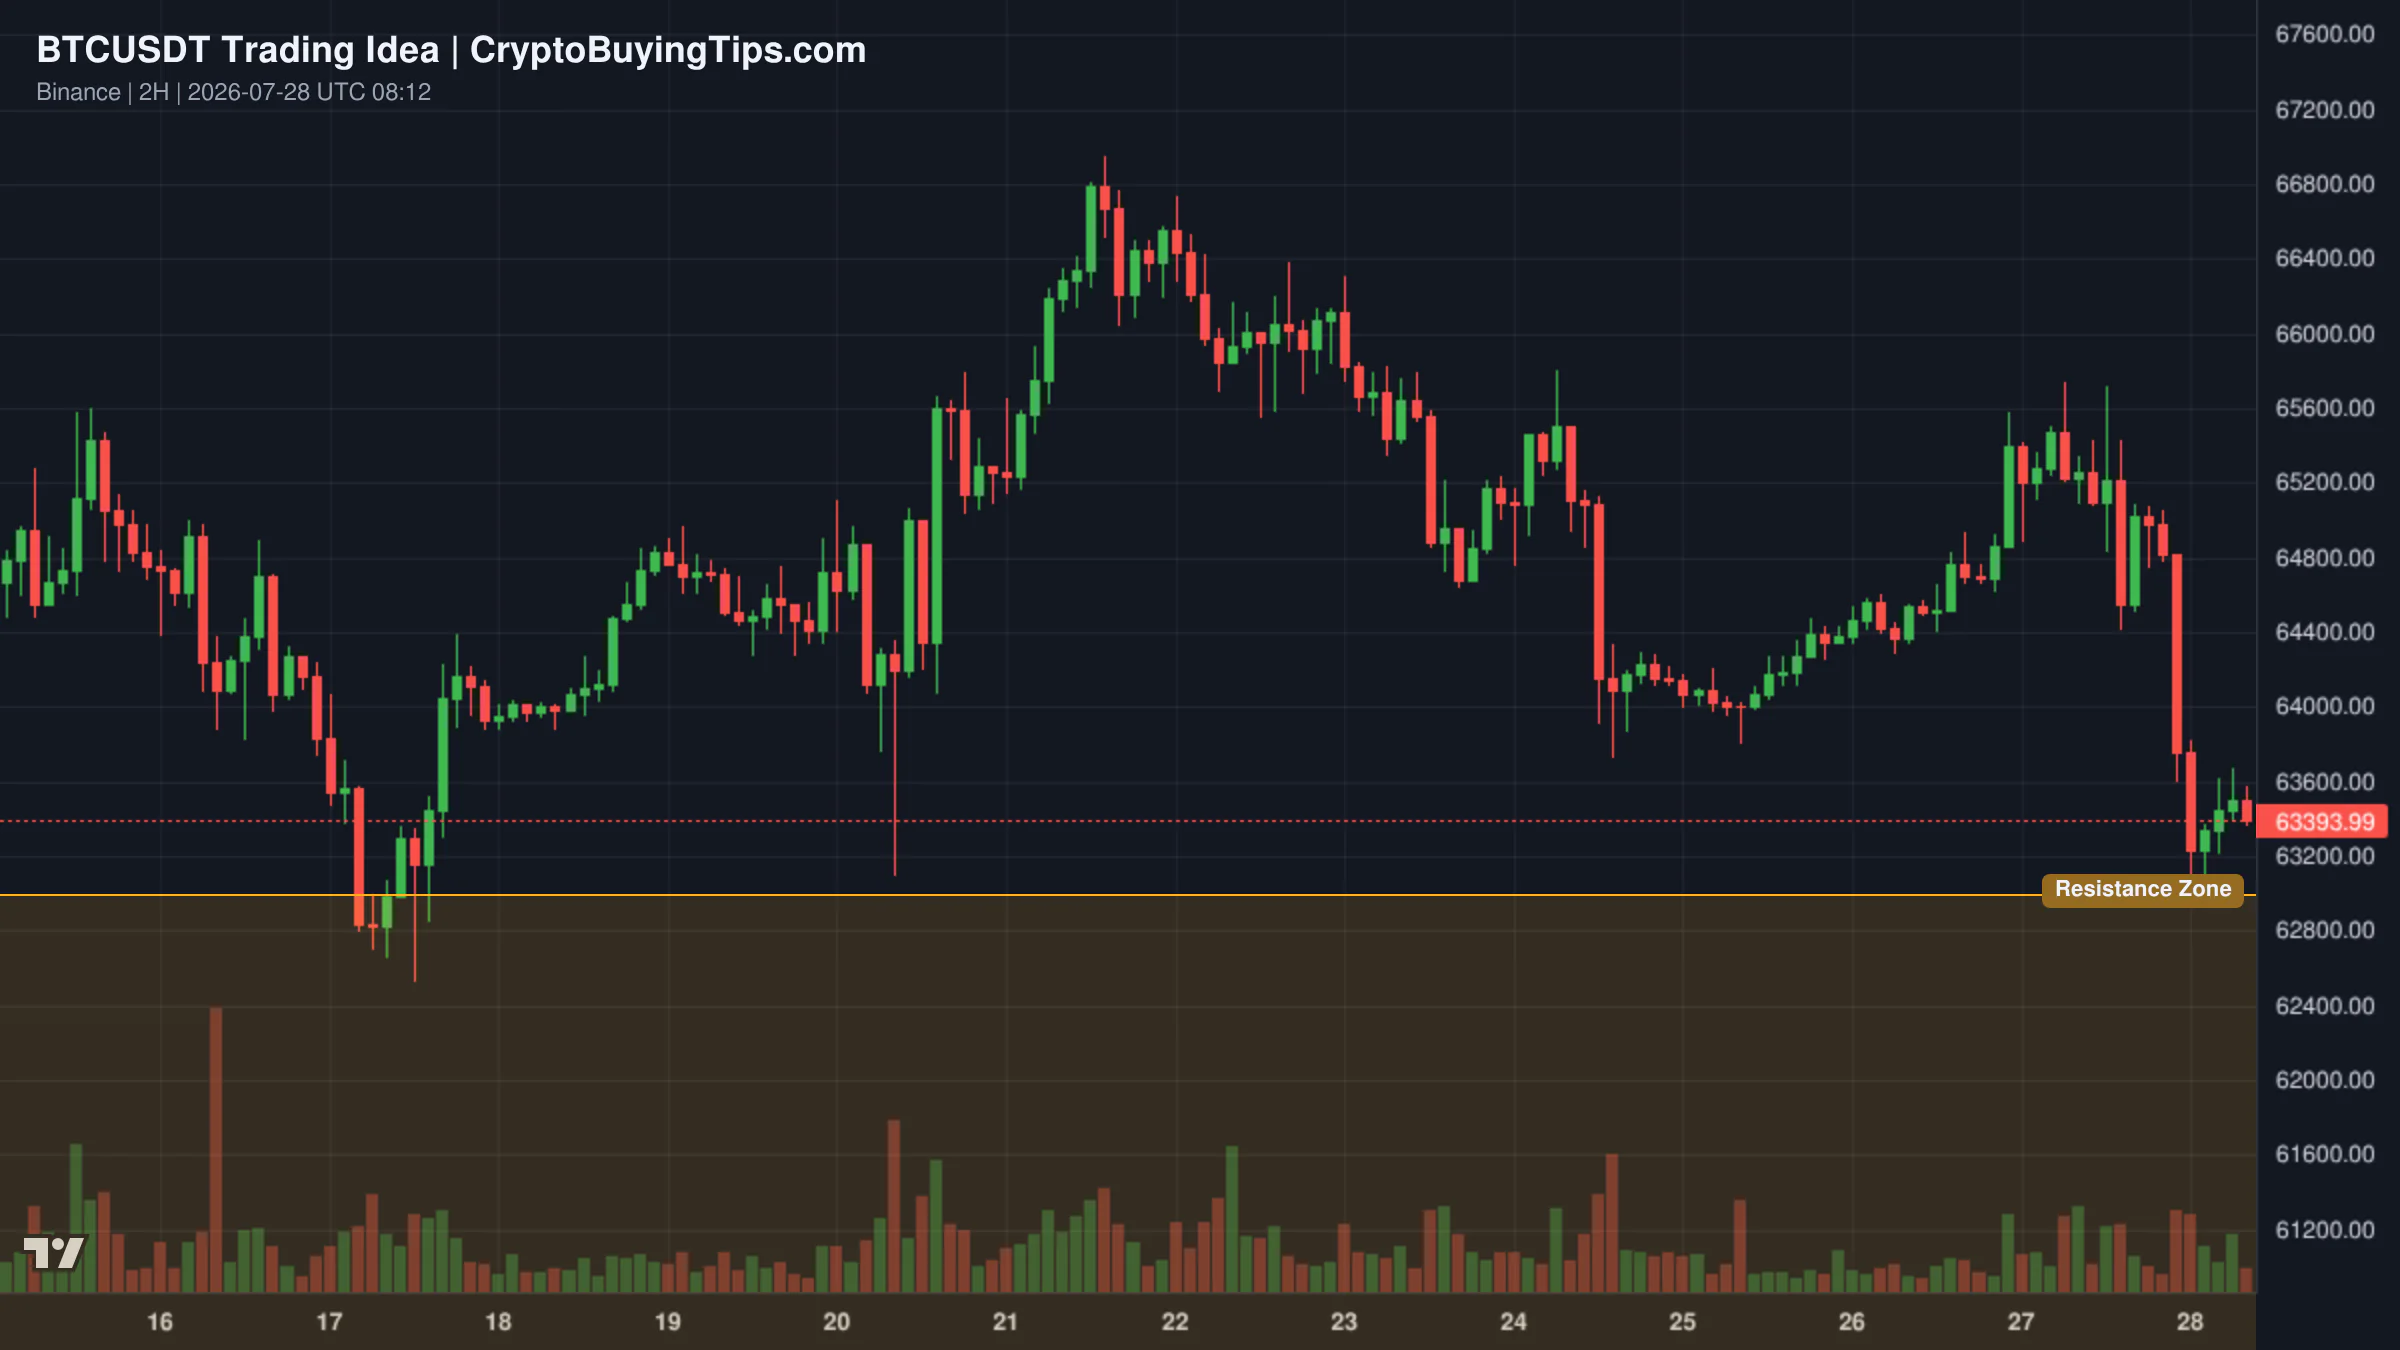
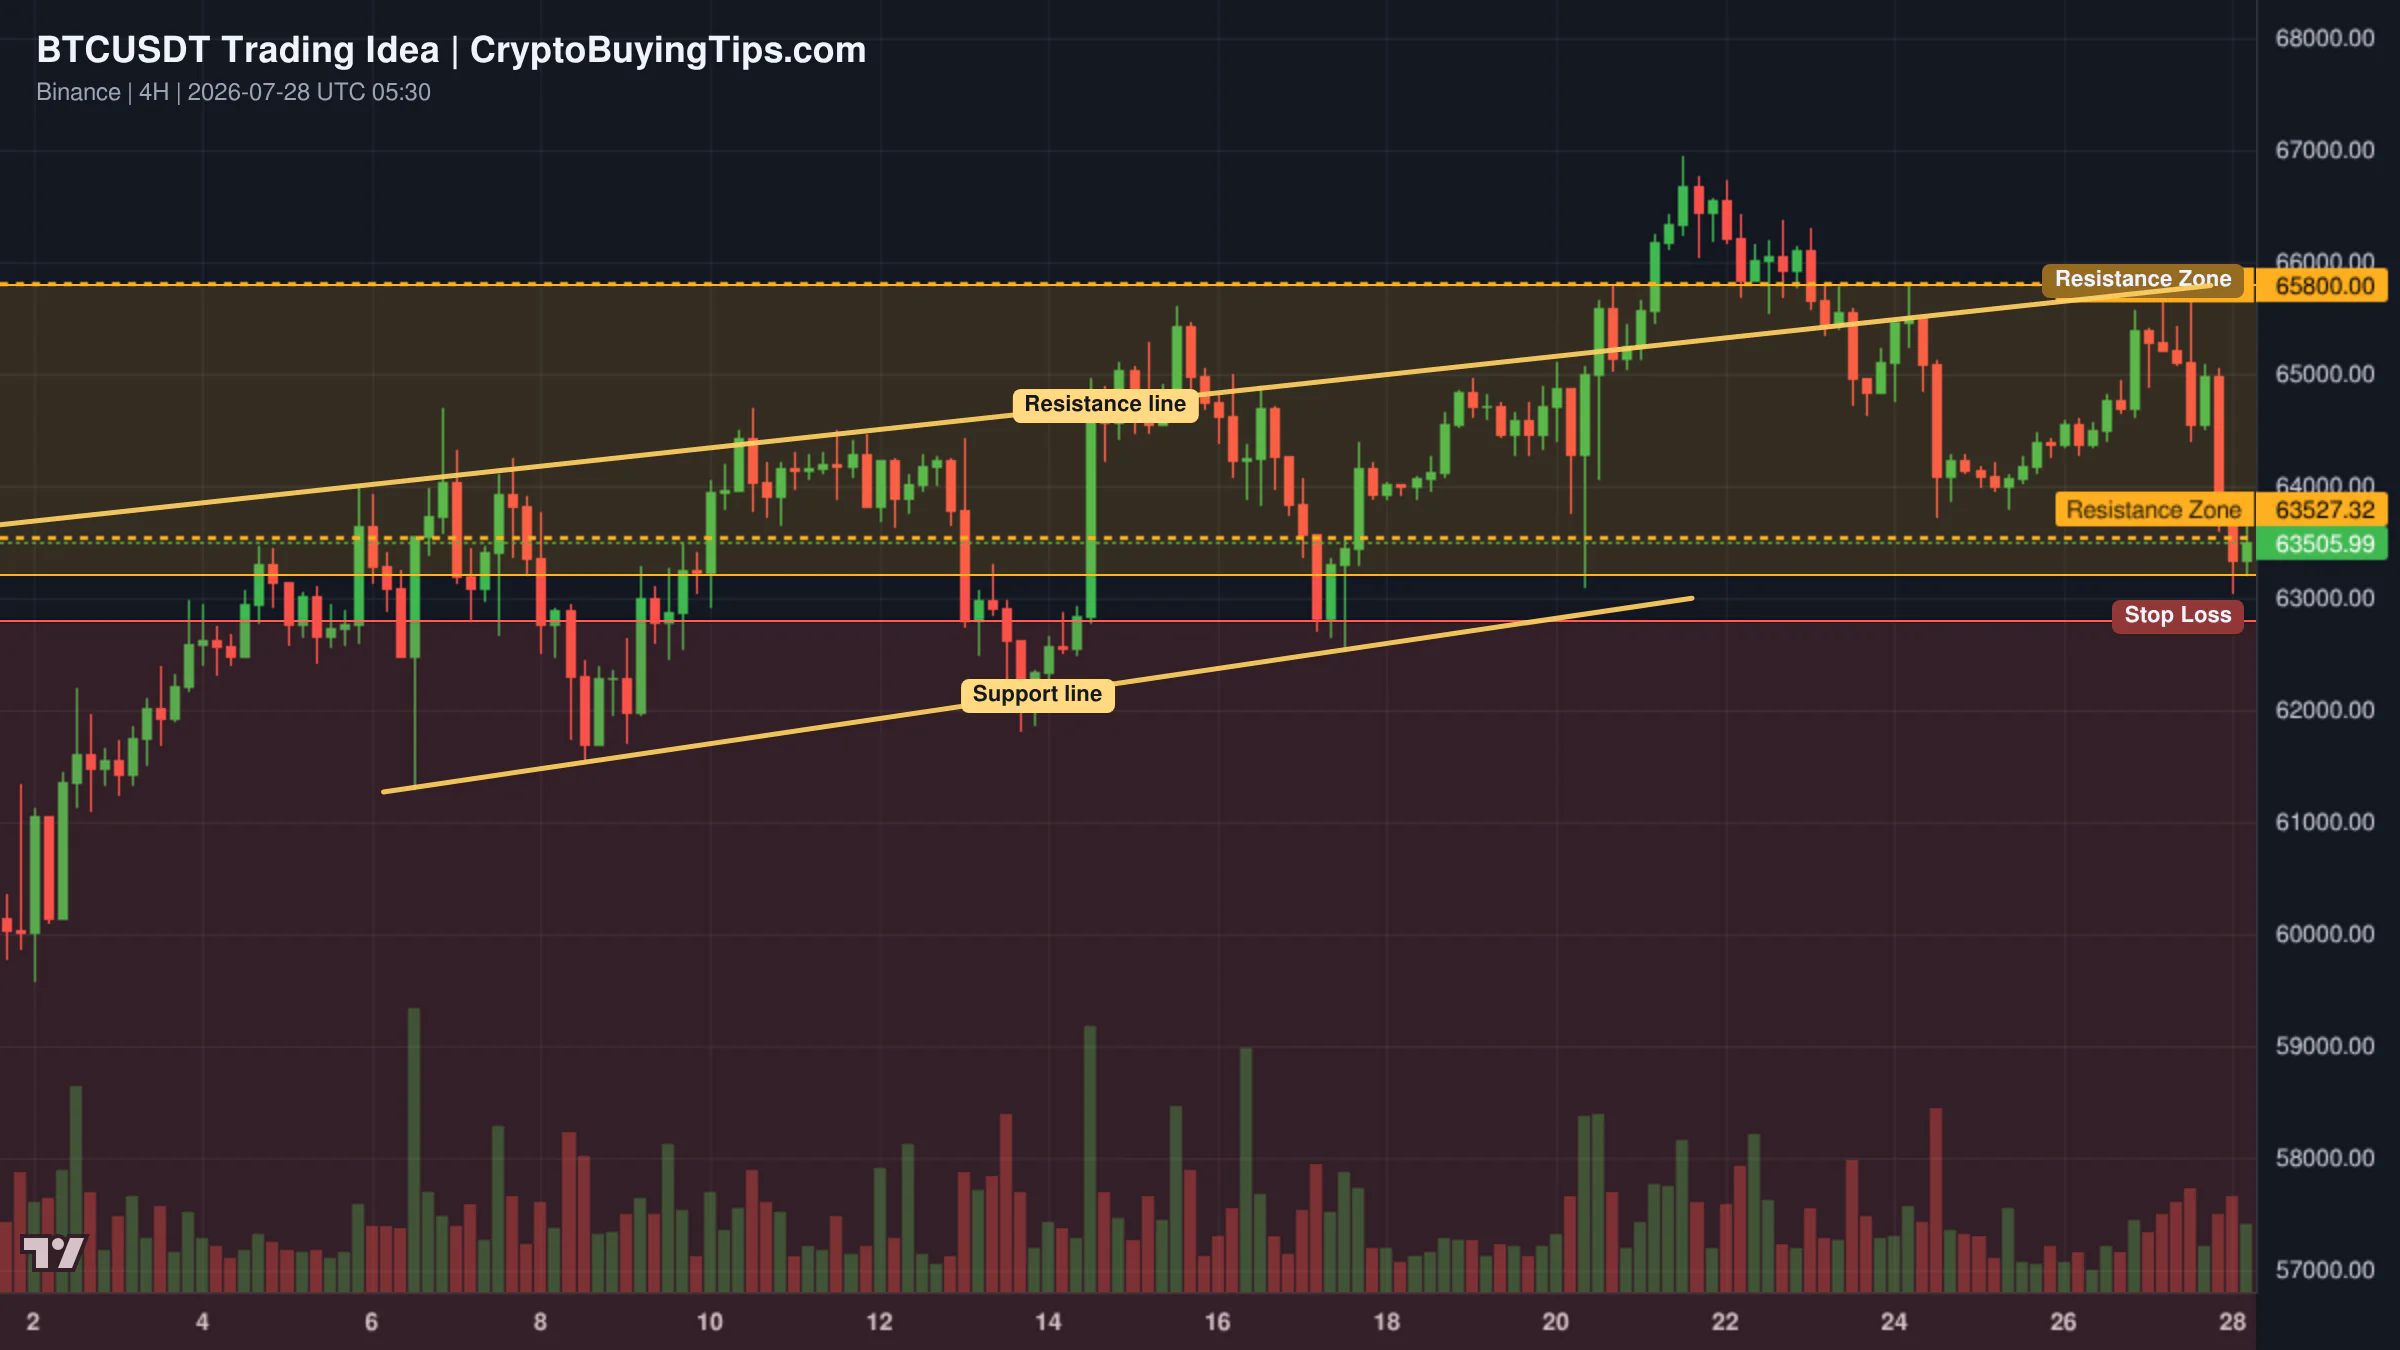
Redrawn BTCUSDT 120 trading idea chart for BTCUSDT Holds Trendline Support, Recovery Toward $65K in FocusRedrawn BTCUSDT 240 trading idea chart for BTC/USDT: THE $65,800 CHANNEL BOUNCE!

Another perspective on BTCUSDT focuses on the $63,000 buyer zone. As long as the price holds this area and the rising trendline, a recovery toward $65,000 remains the likely scenario. However, a breakdown below $63,000 would weaken the bullish case and suggest that the current "fear" is justified.

For those looking at altcoins, ENA has been stuck in a wide consolidation range between $0.07 and $0.14 for six months. The neutral read here is to wait for the asset to establish itself above the midpoint of $0.095. Until that happens, the asset is simply drifting, and there is little reason to rush into a trade that has shown no direction for half a year.

Smart Money Signals — Hyperliquid Leaderboard
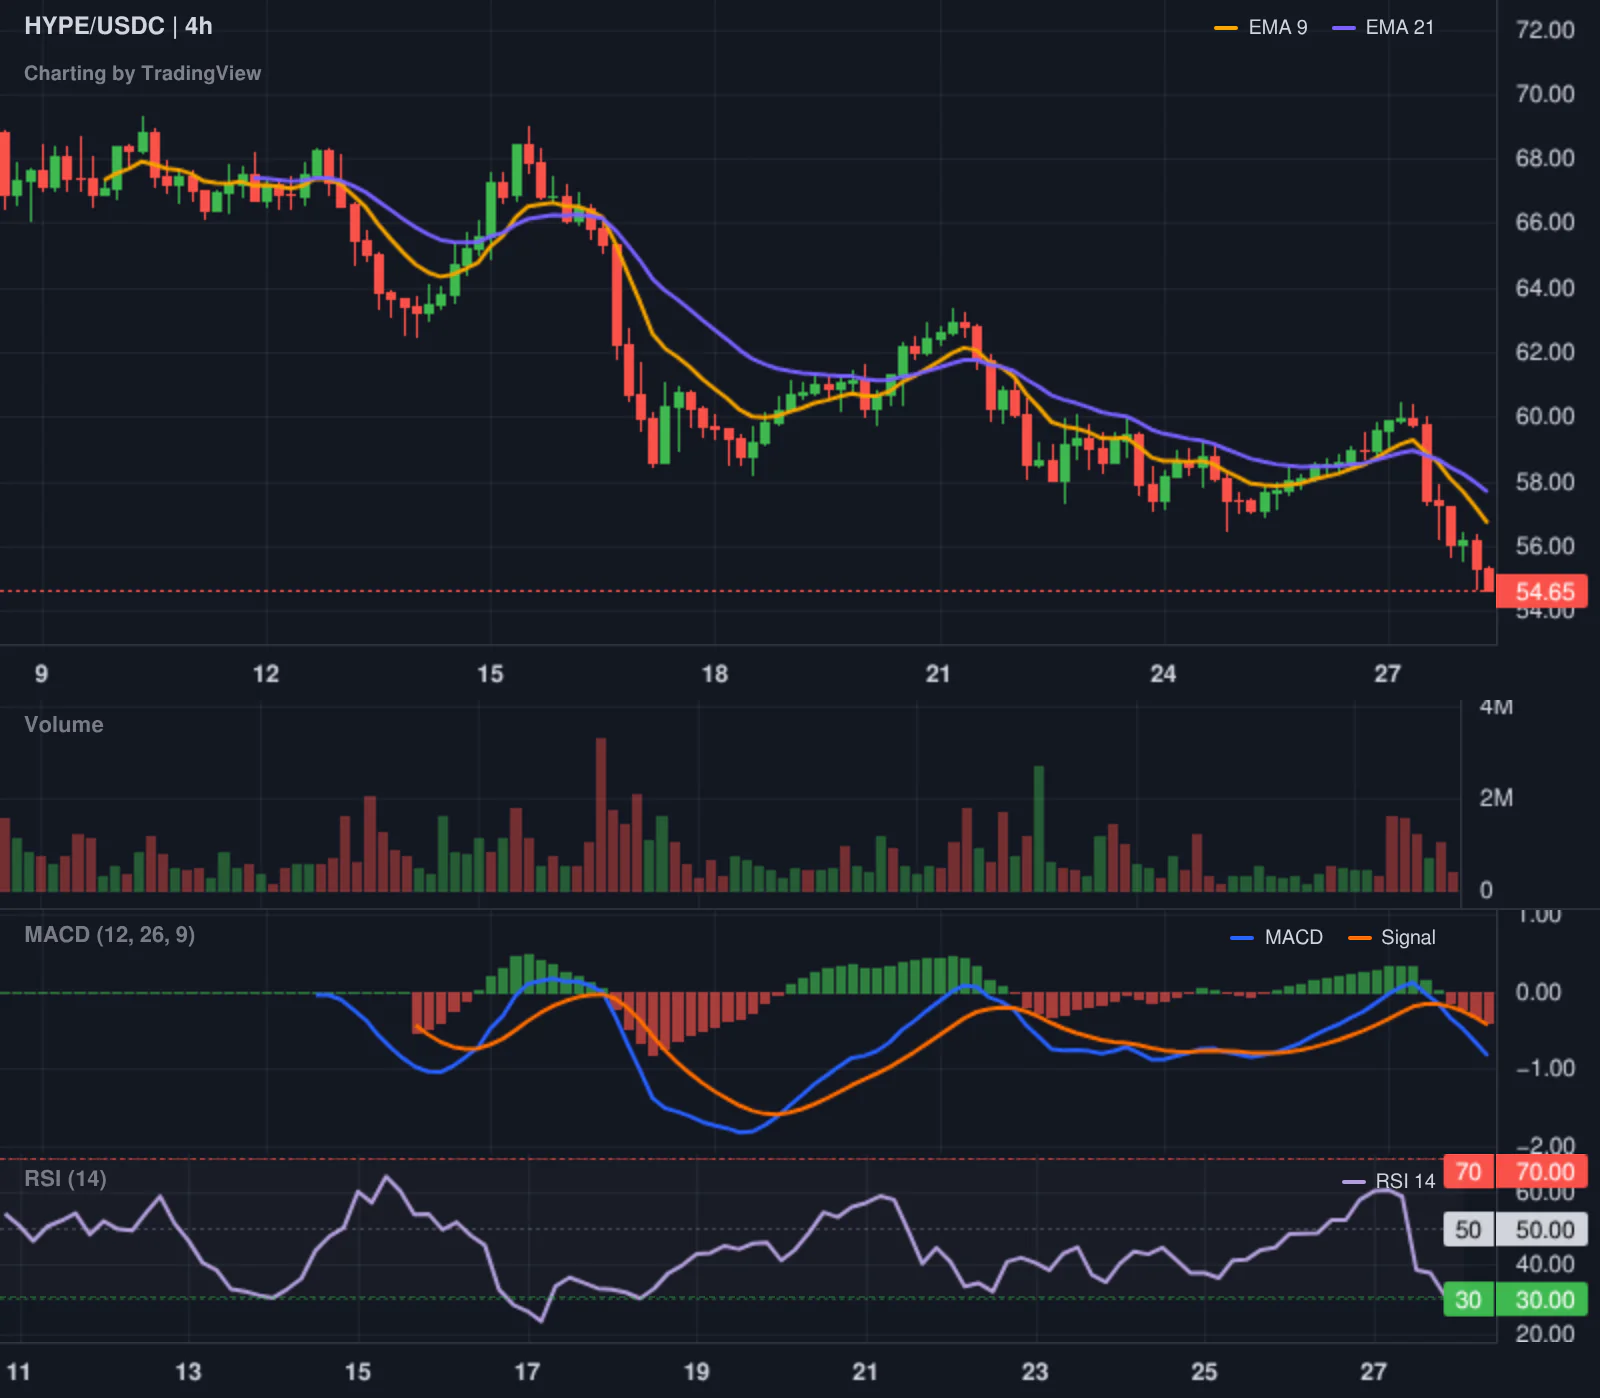
Hyperliquid SHORT HYPE leaderboard chart

Our tracker has flagged a significant move from @TudorCross, who boasts a 6136% 30-day ROI. This trader has opened a short position in HYPE at an entry price of $58.17, with a notional value of over $40,000. Given the trader's track record, this short aligns with the broader market weakness and the specific decline in Hyperliquid's price today.

Altcoin Spotlight

Hyperliquid (HYPE) is the standout loser of the day, crashing 9.23% to $54.73. This move is particularly interesting because the asset is being targeted by top-tier leaderboard traders. The volatility in HYPE is a microcosm of the wider market: high leverage and rapid price swings. When a top trader shorts an asset that is already sliding, it often suggests that the "bottom" is further away than the bulls think.

What to watch next

The immediate focus is the $63,000 level for Bitcoin. If this support holds, we can expect a relief rally toward $65,800 as the leveraged shorts get squeezed. If it fails, the market could see a deeper correction as the Fear and Greed Index slides further toward "Extreme Fear."

On the macro front, keep an eye on the U.S. chip stocks. If the selloff in Nvidia and Micron continues, the crypto market will likely follow suit regardless of any bullish technical setups. Finally, the federal court's decision on the CME versus CFTC lawsuit will be a major indicator of how regulated derivatives will actually function in the U.S. For now, the market is in a state of fragile equilibrium, waiting for either a geopolitical truce or a technical breakout.
Crypto Market Overview | Leveraged volume spikes amid fear index divergence | July 27, 2026
Sigrid Voss·

Crypto Market Overview | Leveraged volume spikes amid fear index divergence | July 27, 2026

Market overview

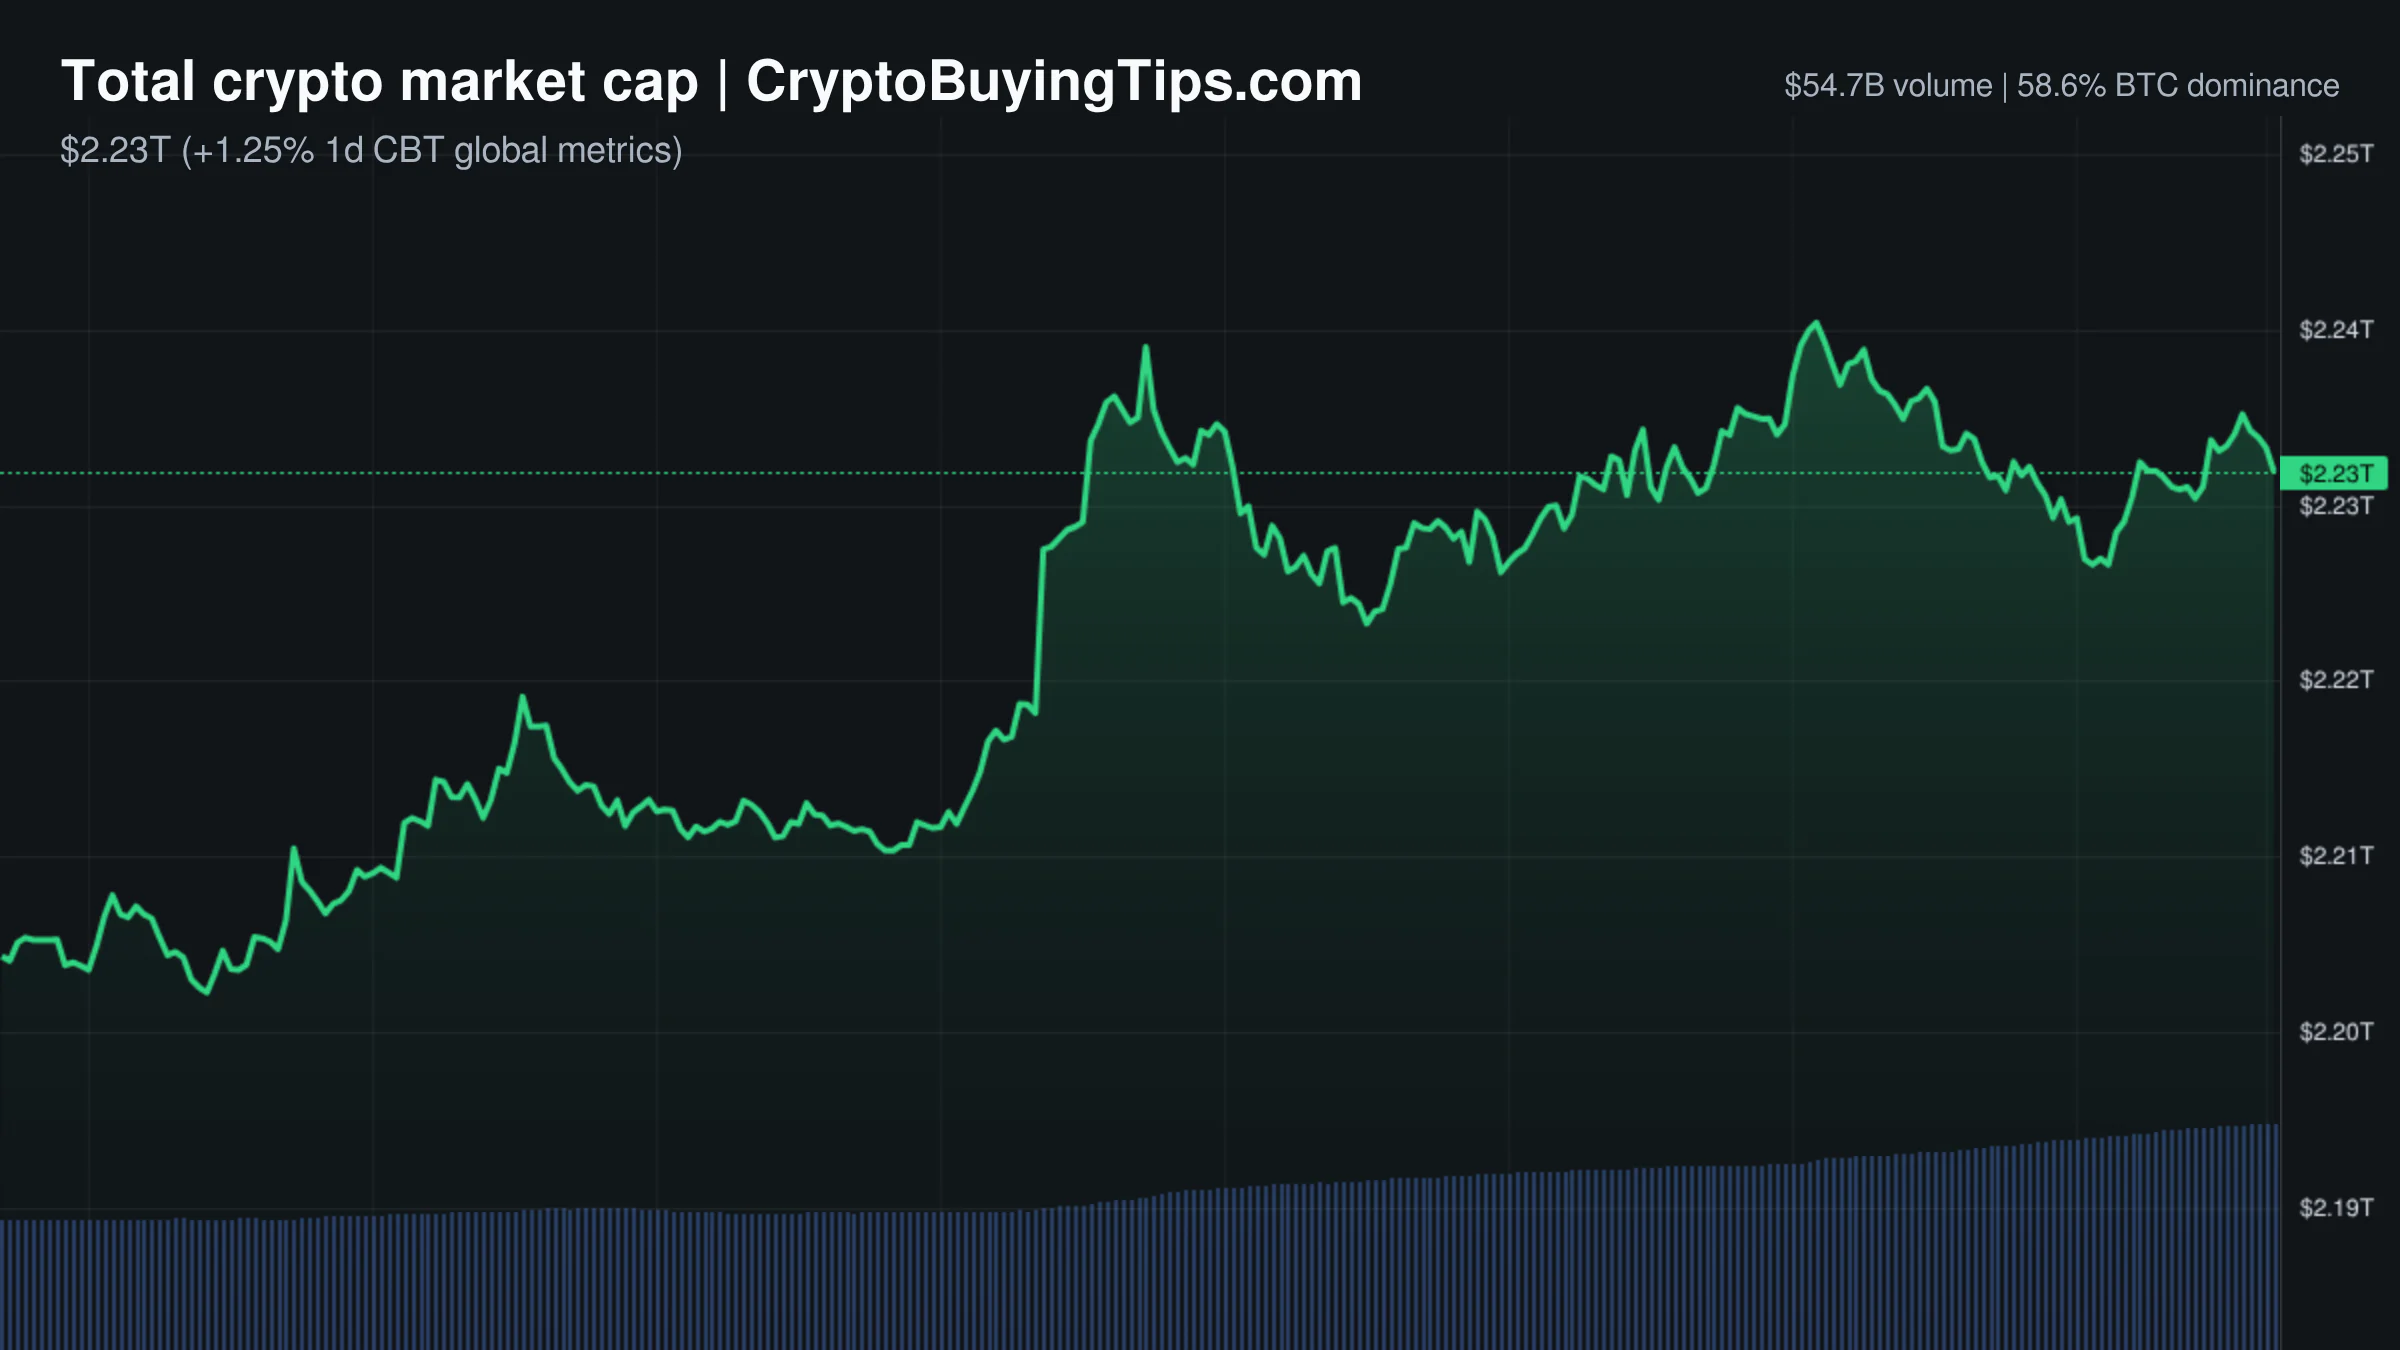
The crypto market is currently operating in a state of profound contradiction. Prices are drifting higher, with the total market cap sitting at $2.32T and a 24-hour gain of 1.36%, yet the Fear and Greed Index remains stubbornly in "Fear" at 39. This disconnect is not a glitch but a signal. We are seeing a classic divergence where price action is being driven by a massive surge in leveraged activity rather than a broad shift in spot conviction. Derivatives volume has spiked by 75.34% to $473.98B, completely dwarfing spot volume. When the crowd is terrified but the leverage is mounting, the market is usually positioning for a volatile move rather than a steady climb.

This leveraged push is mirrored in stablecoin activity, where 24-hour volume rose 51.14%. This suggests that capital is moving into position, but the "Fear" sentiment indicates that this money is not entering with a long-term "buy and hold" mentality. Instead, it looks like tactical positioning for short-term swings. Bitcoin dominance remains high at 56.44%, which tells us that despite the general price lift, capital is not yet rotating into altcoins. The Altcoin Season Index is at 27, firmly in Bitcoin season territory. Money is staying in the safest harbor while the rest of the market waits for a catalyst that doesn't involve a high-leverage gamble.

The macro backdrop adds to this tension. The S&P 500 is flat, while the NASDAQ has slipped 1.12%. This suggests a slight risk-off mood in tech, which usually drags on crypto. However, the crypto market is ignoring the NASDAQ's mood for now. This divergence often happens when institutional flows, such as the recent ETF activity, begin to decouple from the daily noise of the equity markets.

Bitcoin and Ethereum

Bitcoin is currently trading at $65,297.41, up 1.30% over the last 24 hours. The price action is cautious. While it has managed to hold above the $64,000 mark, the lack of aggressive spot buying means the current move is fragile. The dominance figure of 56.44% indicates that Bitcoin is still the primary vacuum for liquidity. We previously covered how BTC dominance data analysis often reflects capital consolidating during liquidity pauses, and today's data supports that read. The market is not yet convinced that a new bull leg has started; it is simply refusing to crash.

Ethereum is showing more relative strength today, trading at $1,966.37 with a 4.36% gain. This outperformance is likely linked to the institutional appetite we are seeing in the ETF space. Spot Ethereum ETFs recorded $104 million in weekly net inflows, extending a three-week streak. This is a meaningful contrast to the broader network state, where gas fees are extremely low at 0.1 Gwei. The lack of on-chain congestion suggests that the price rise is coming from the "wrapper" (ETFs) rather than actual utility on the network.

This creates a strange dynamic where Ethereum market share vanishes in terms of dominance (now at 10.23%), but the price is being propped up by institutional inflows. It is a corporate makeover in real time. The network is quiet, but the ETFs are busy.

Top crypto prices

Bitcoin is at $65,297.41, up 1.30%. Ethereum is at $1,966.37, up 4.36%. BNB is trading at $572.97, a modest increase of 0.42%. XRP is at $1.1, up 0.69%. Solana is at $76.53, gaining 1.88%. TRON has dipped slightly to $0.3306, down 0.43%. Hyperliquid is at $60.27, up 2.60%.

News driving today's market

Institutional adoption continues to move in a fragmented way. Russia's Sberbank is planning to launch crypto trading infrastructure, including a digital depository, by December. This is a significant move for a state-affiliated bank and suggests that even in sanctioned or restricted environments, the drive toward regulated digital asset rails is inevitable. Similarly, BNY Mellon's European subsidiary has joined the MiCA register. When the world's oldest custodian bank moves into the MiCA framework, it provides a structural floor for the market. These are the "slow and steady" wins that build long-term liquidity.

On the other hand, the regulatory hammer is still swinging. Thailand's SEC has filed a criminal complaint against Bitkub over a $47 million hack from 2021 that was allegedly hidden from regulators. This is a reminder that the "trust me" era of regional exchanges is over. The fallout from the fading hopes for the Clarity Act in the U.S. is also weighing on the mood. With BitMEX reportedly shutting down as the market consolidates into five major players, we are seeing a brutal thinning of the herd. The industry is moving toward an oligopoly where only the most compliant or the most massive survive.

We are also seeing a shift toward "agentic finance." Coinbase CEO Brian Armstrong is pushing the narrative that AI agents will drive the next wave of adoption, specifically highlighting the Base network and USDC. While this sounds like typical CEO optimism, the fact that Base has topped 100 million AI payments suggests there is actual data behind the hype. Meanwhile, real-world tokenization is moving beyond pilots. POSCO International and LG CNS are using the Injective network to tokenize commercial invoices. This is a practical use case that doesn't rely on speculation, which is a refreshing change of pace.

Social intelligence

The ETF data is the most actionable signal coming from social feeds. The three-week streak of net inflows for both Bitcoin and Ethereum ETFs suggests a steady institutional accumulation that is ignoring the "Fear" sentiment of retail traders. Bitcoin ETFs saw $33.79M in inflows, while Ethereum's $103.9M is far more impressive given its lower market cap. We are also seeing some interest in SOL and XRP ETFs, which posted inflows of $7.2M and $8.15M respectively.

Macro anxiety is centering on the July 29 FOMC meeting. Markets are pricing in a 36.3% chance of a rate hike. In a world where crypto is essentially a high-beta play on global liquidity, any hint of tighter money is a headwind. This anxiety was compounded by Singapore's central bank unexpectedly tightening monetary policy due to inflation and energy costs. When a major Asian hub tightens, it usually signals a shift in global risk appetite.

Finally, the BitMart wind-down is causing some localized stress. Withdrawals have slowed as wallets fell to around $69M, and the BMX token has crashed over 81% this week. This is a textbook example of how quickly a platform can collapse once the market decides it is no longer viable.

Trading ideas worth watching

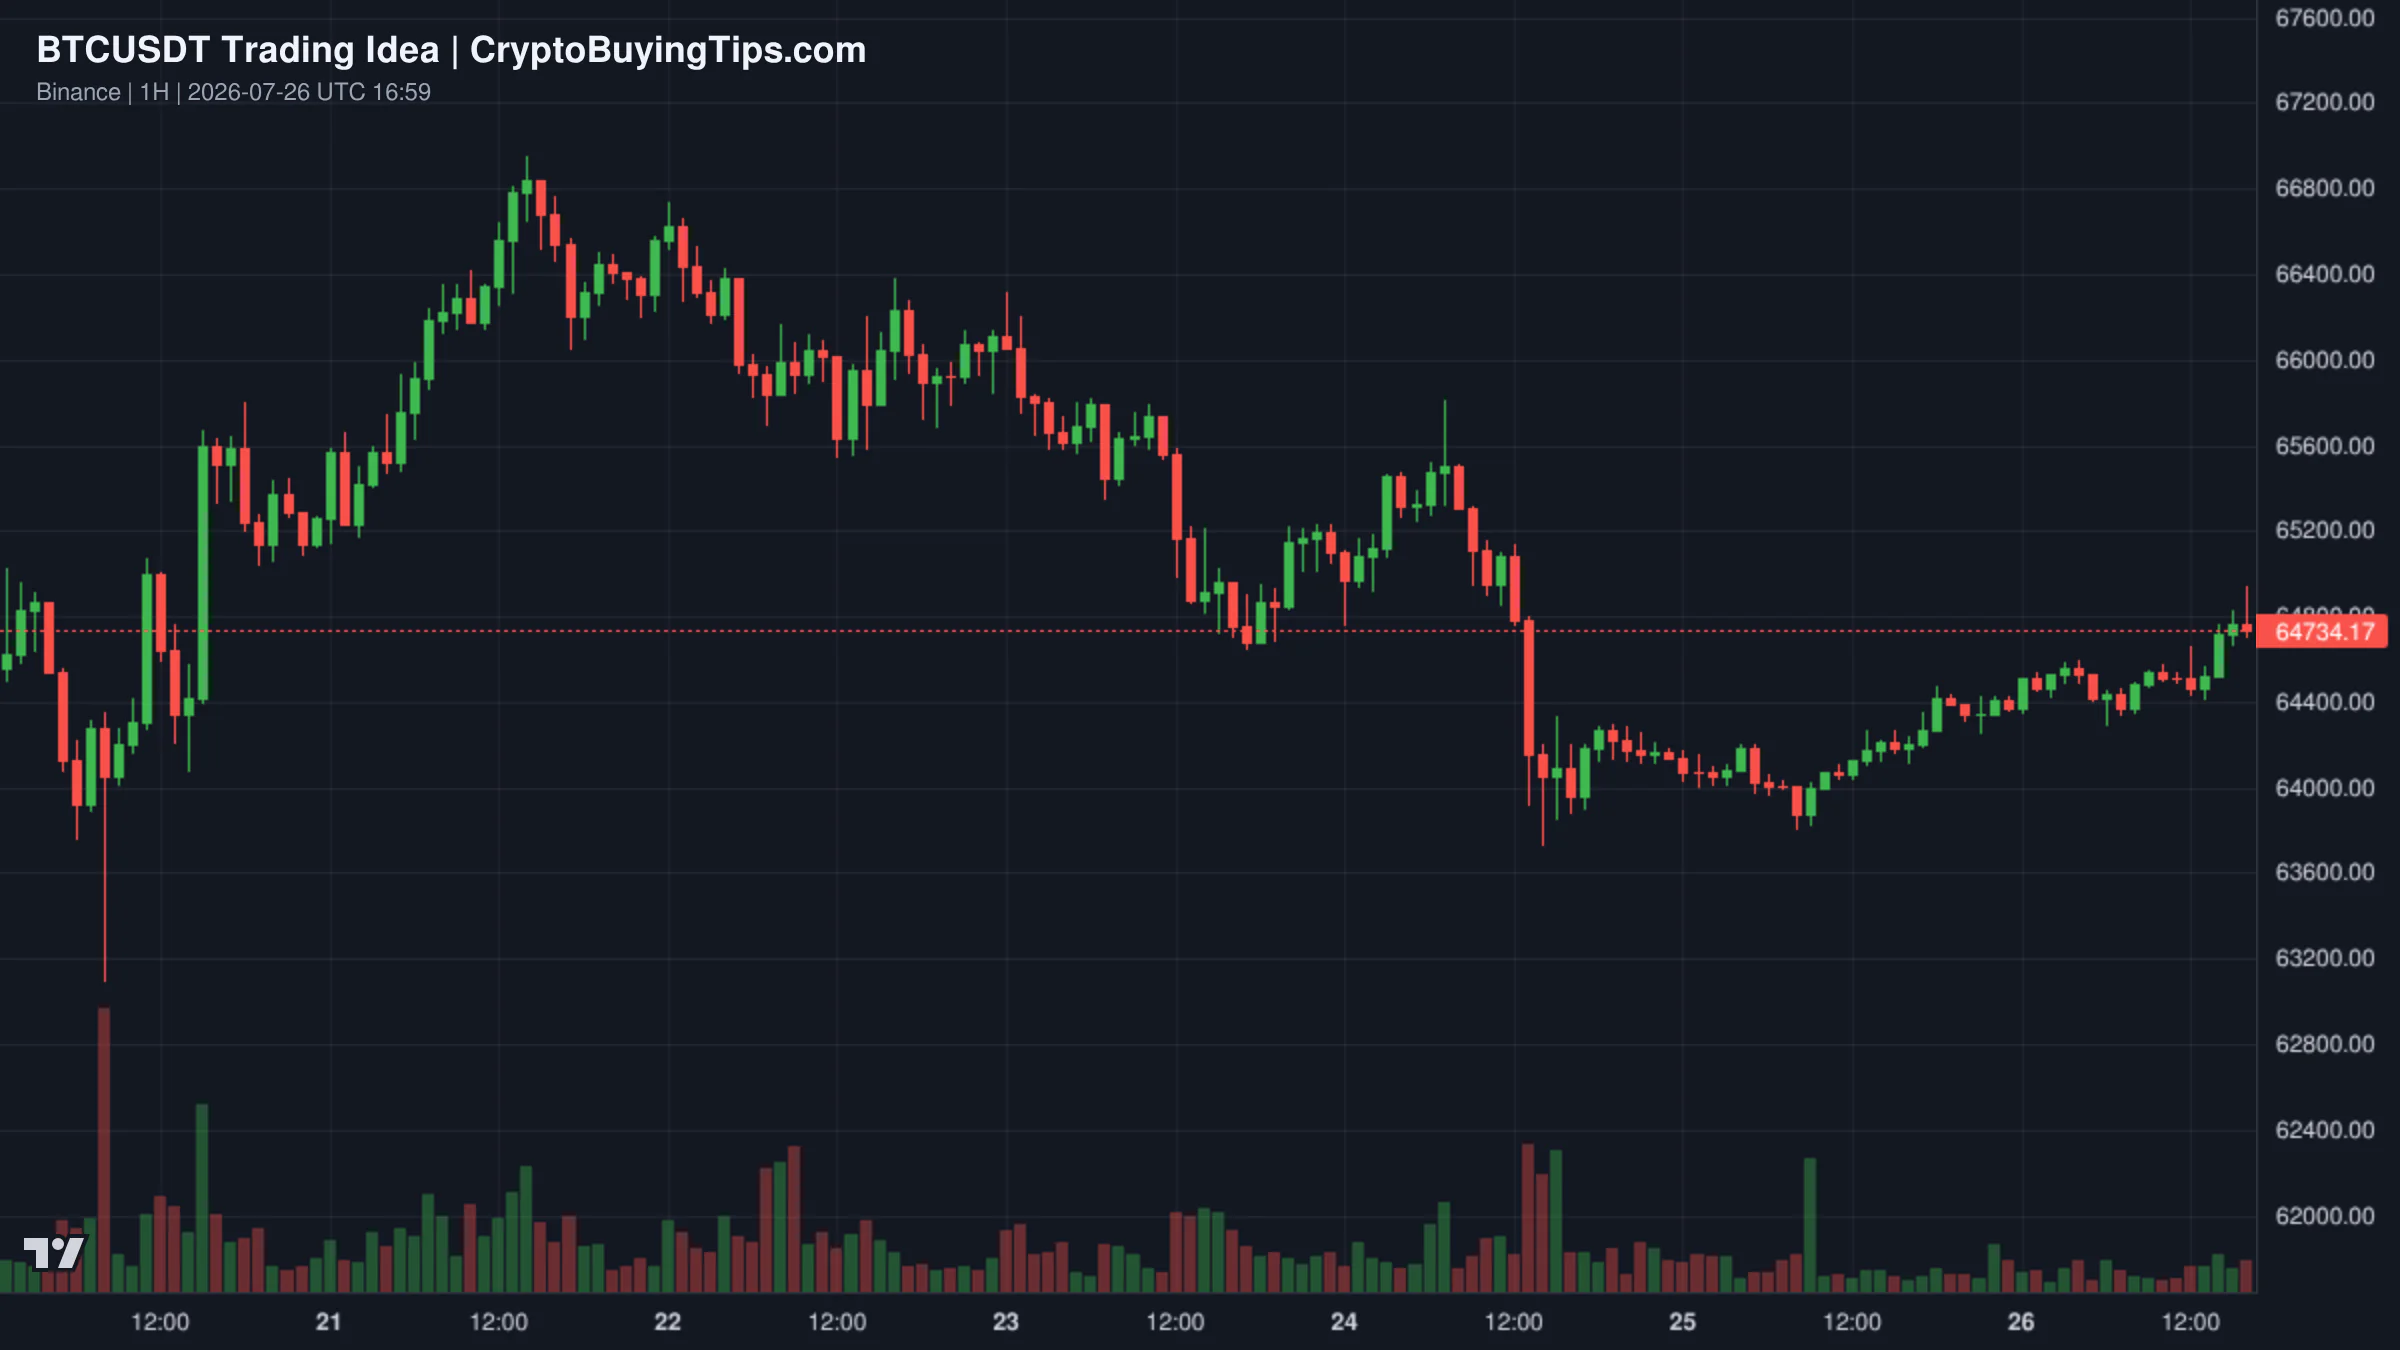
Bitcoin is currently fighting for control around the $64,300 level. According to a bullish setup on the 60-minute chart, if BTC holds this support zone, there is a clear path toward $65,750 and potentially $66,600. The recent bounce suggests that buyers are stepping in, but the move is not yet confirmed. A close below $64,300 would invalidate this short-term bullish structure and likely lead to a retest of lower liquidity.

Redrawn BTCUSDT 60 trading idea chart for BTCUSDT Outlook: Approaching Resistance ZoneRedrawn BTCUSDT 60 trading idea chart for BTC: If BTC holds above $64,300  Could Rise Further To  $66,600

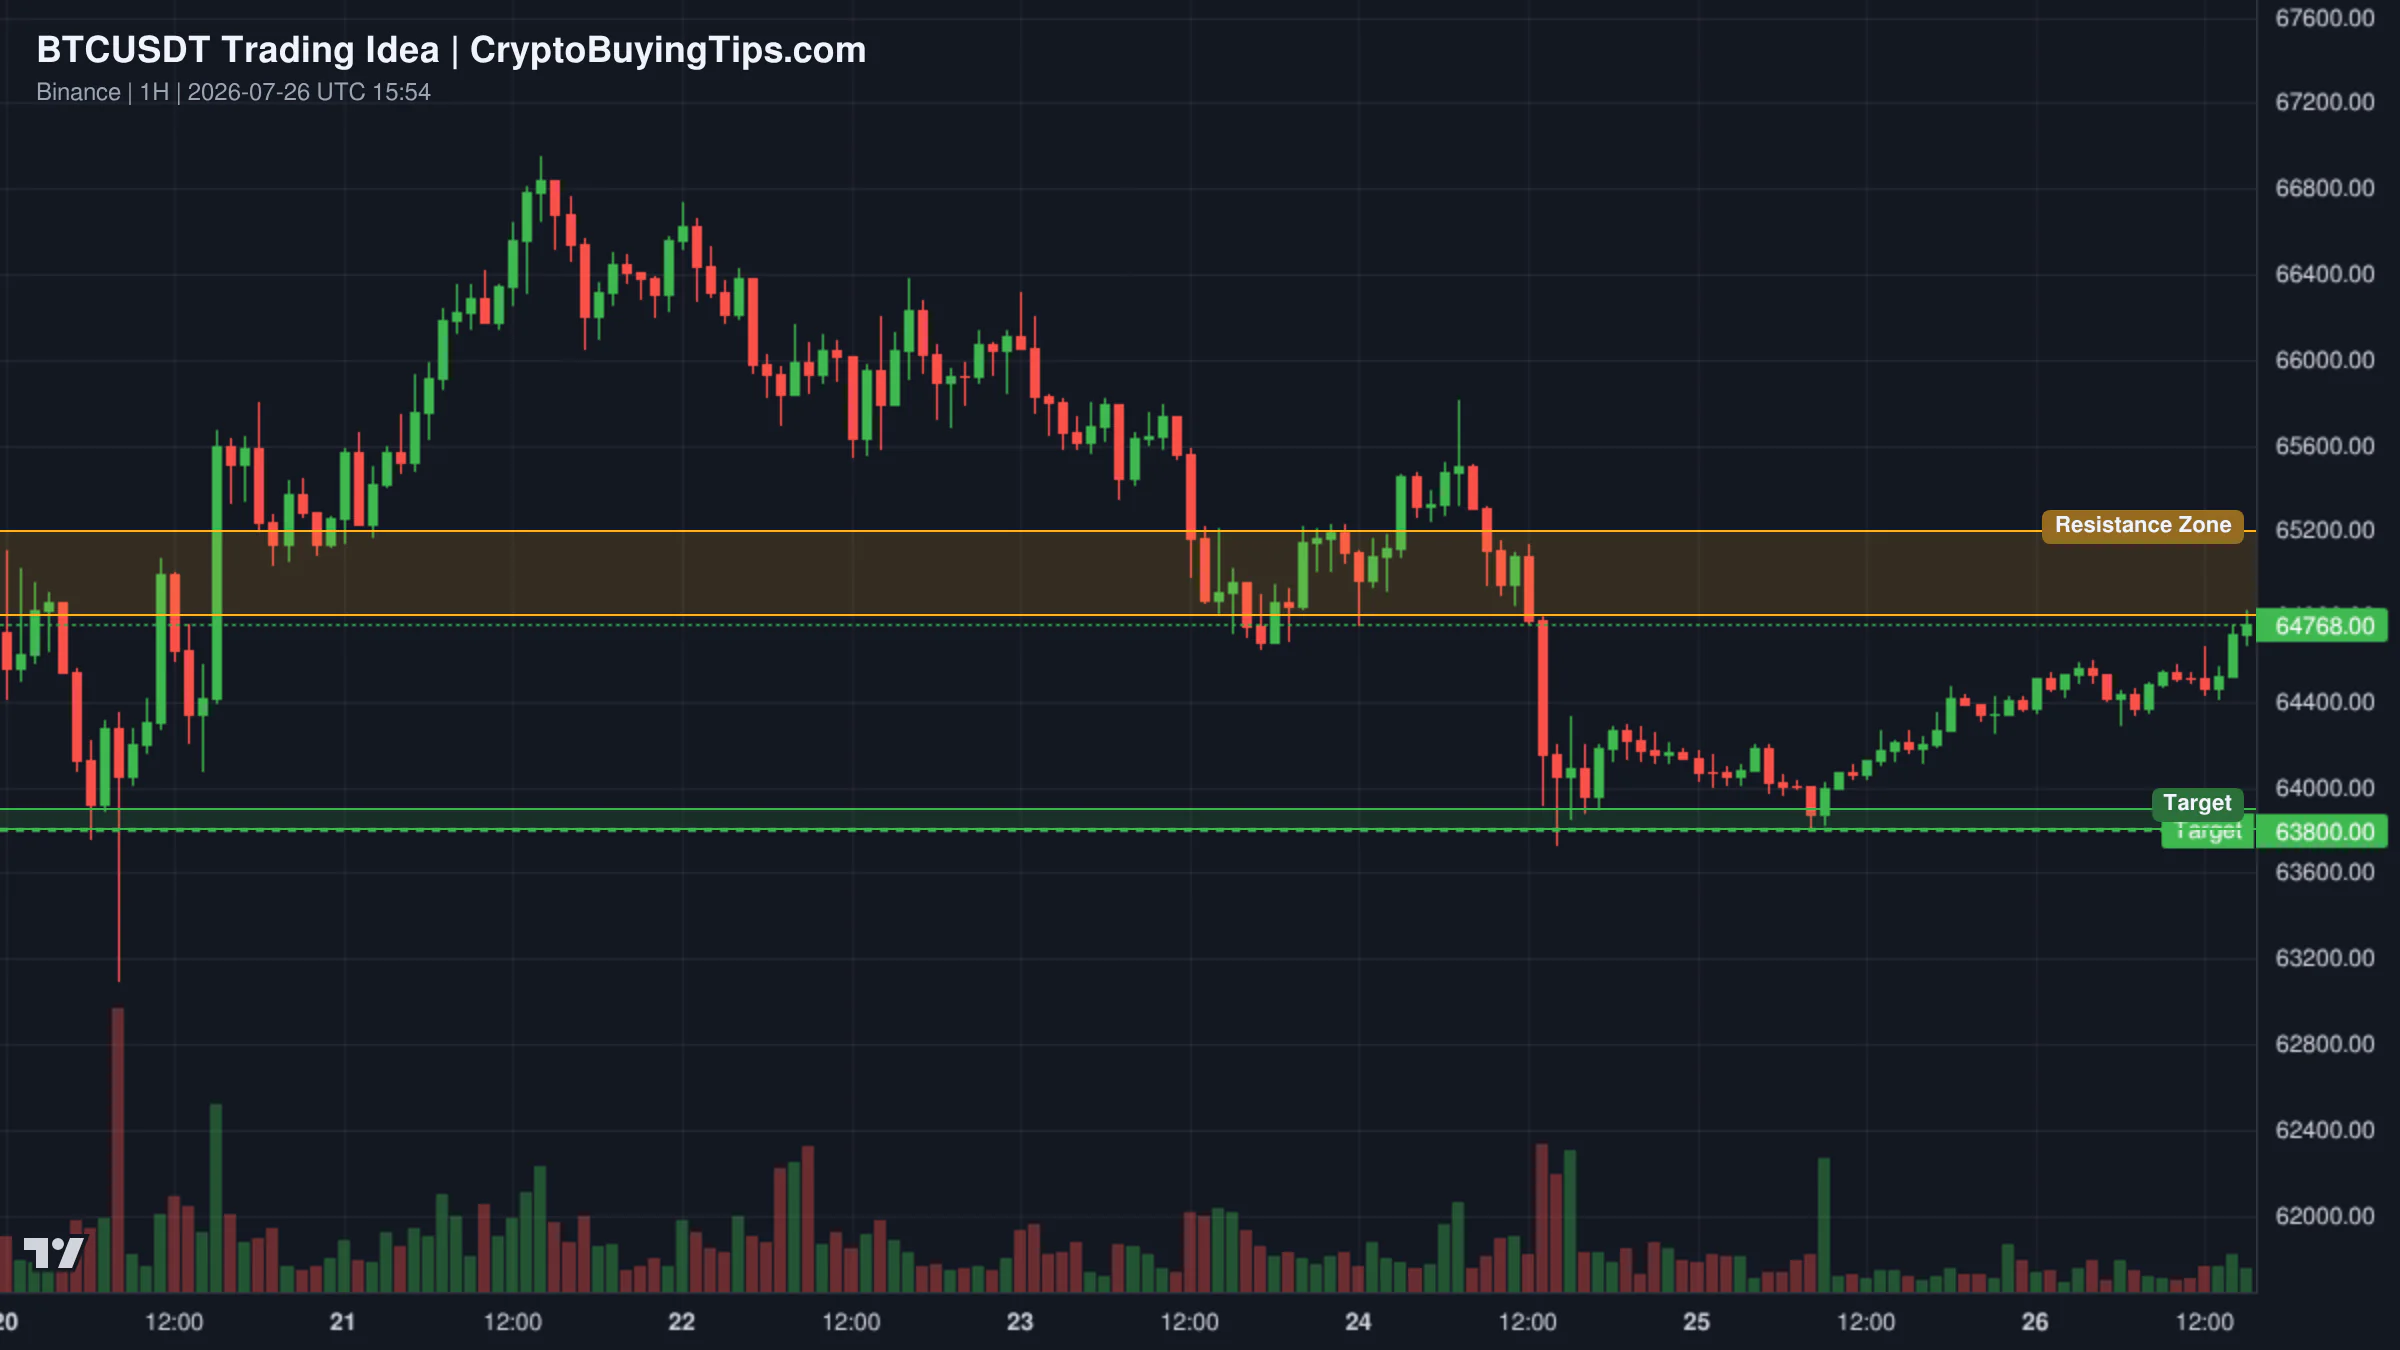
A more cautious read on BTCUSDT suggests we are hitting a wall. Price action has pushed into a major supply zone between $64,800 and $65,200, which aligns with a descending trendline. Having just completed a double bottom pattern with a target near $64,800, the momentum appears to be tapering off. If sellers step in with conviction at this resistance, we could see a move back down to the $63,800 liquidity pool.

For Ethereum, a 4-hour chart shows the asset coiling inside a massive ascending wedge. After testing the $1,960 resistance ceiling, ETH is experiencing a controlled pullback. The high-confluence demand zone sits between $1,910 and $1,925. A bounce from this wedge support would provide a low-risk entry for a move back toward $1,960. The risk here is a 4-hour close below $1,885, which would break the wedge and signal a deeper correction.

Smart Money Signals — Hyperliquid Leaderboard

Hyperliquid SHORT HYPE leaderboard chart

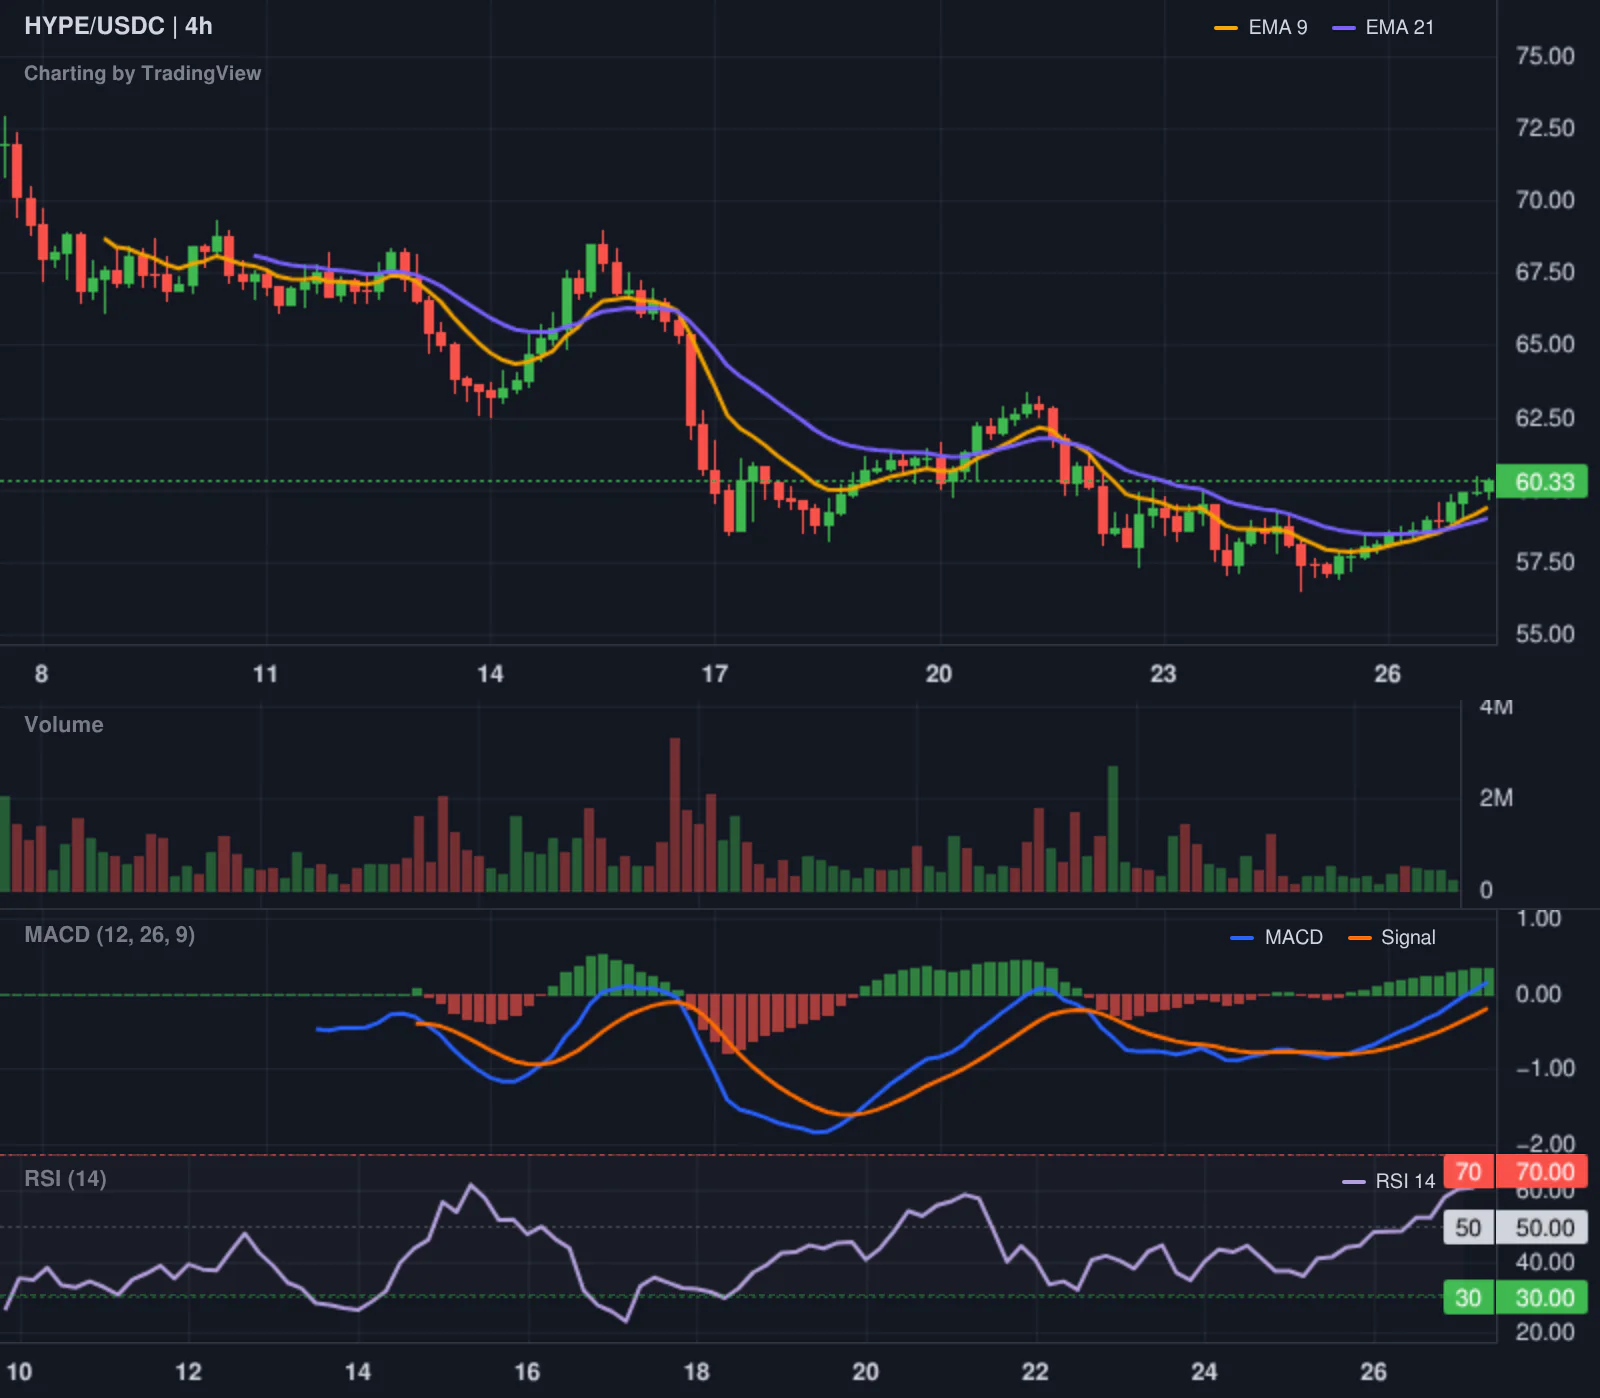
The Hyperliquid leaderboard provides a sharp contrast to the general bullish drift. Top trader @TudorCross, who carries a staggering 6136% 30-day ROI, has opened a short position in HYPE at an entry price of $58.17. The notional value of the trade is $40,676.54. While the asset is currently trading higher at $60.27, the fact that a high-conviction trader is fading the move suggests that the recent rally in HYPE may be overextended.

Altcoin Spotlight

Injective (INJ) deserves attention today, not because of a chart pattern, but because of its emerging role in corporate finance. The partnership with POSCO International and LG CNS to tokenize live commercial invoices is a legitimate utility play. Most altcoins promise to "change the world" with vague roadmaps, but moving actual corporate receivables onto a blockchain is a tangible win. If other South Korean giants follow suit, Injective could move from a speculative asset to a piece of critical financial infrastructure.

What to watch next

The focus for the next 48 hours is the July 29 FOMC meeting. With a 36.3% chance of a rate hike, the market is on edge. A hike, or even a hawkish tone from the Fed, could quickly flush out the excessive leverage we are currently seeing in the derivatives market.

We are also keeping an eye on the BitMart wind-down. If the withdrawal issues escalate, it could trigger a wider contagion of distrust among users of mid-tier exchanges. The gap between the "Fear" sentiment and the rising prices is a coiled spring. Whether that spring shoots upward or snaps downward depends entirely on whether the institutional ETF inflows can outweigh the retail panic and the Fed's next move.

Crypto Market Overview | Volume collapse masks marginal gains amid regulatory noise | July 26, 2026
Sigrid Voss·

Crypto Market Overview | Volume collapse masks marginal gains amid regulatory noise | July 26, 2026

Market overview

The market is currently presenting a curious contradiction. Prices are ticking slightly higher, but the actual activity behind those moves has effectively gone on holiday. Total market capitalization sits at $2.29T, representing a modest 0.84% increase, yet the volume data is grim. 24h volume has fallen to $36.4B, with derivatives volume cratering by over 42% and stablecoin activity dropping by 36%. This is not a healthy rally; it is a low-conviction drift.

The sentiment gap is equally wide. The Fear and Greed Index is firmly in "Fear" at 36, while the price action remains marginally positive. Usually, this suggests a bottom is forming, but the collapse in trading volume across spot and derivatives suggests that traders are simply stepping aside. We see a market that is pricing in slight gains while the participants are too terrified to actually commit capital.

Bitcoin dominance remains high at 58.67%, while Ethereum dominance lingers at 10.31%. The Altcoin Season Index is neutral at roughly 60, meaning capital is not rotating aggressively into smaller assets. Instead, the market is in a state of paralysis. This mirrors a trend we previously noted in our BTC dominance data analysis, where rising dominance looks less like aggressive buying and more like a general liquidity pause.

Bitcoin and Ethereum

Bitcoin is trading at $64,467.22, up 0.79% over the last 24 hours. The price is holding, but the momentum is absent. The lack of volume suggests that the current level is a result of a lack of sellers rather than a surge of buyers. With the S&P 500 flat and the NASDAQ down 1.12%, the broader risk-on appetite is muted.

Ethereum has outperformed Bitcoin in percentage terms, rising 1.56% to $1,884.19. However, the on-chain data tells a different story. Gas fees are exceptionally low at 0.05 Gwei. This indicates that while the price is rising, the network is practically empty. It is a ghost town on-chain. This disconnect supports our previous read that Ethereum market share vanishes even as the narrative focuses on institutional polish.

Top crypto prices

Beyond the majors, the market shows a few pockets of strength. BNB is up 0.99% at $570.56, and XRP has gained 0.96% to reach $1.09. Solana is showing more relative strength, climbing 1.66% to $75.09.

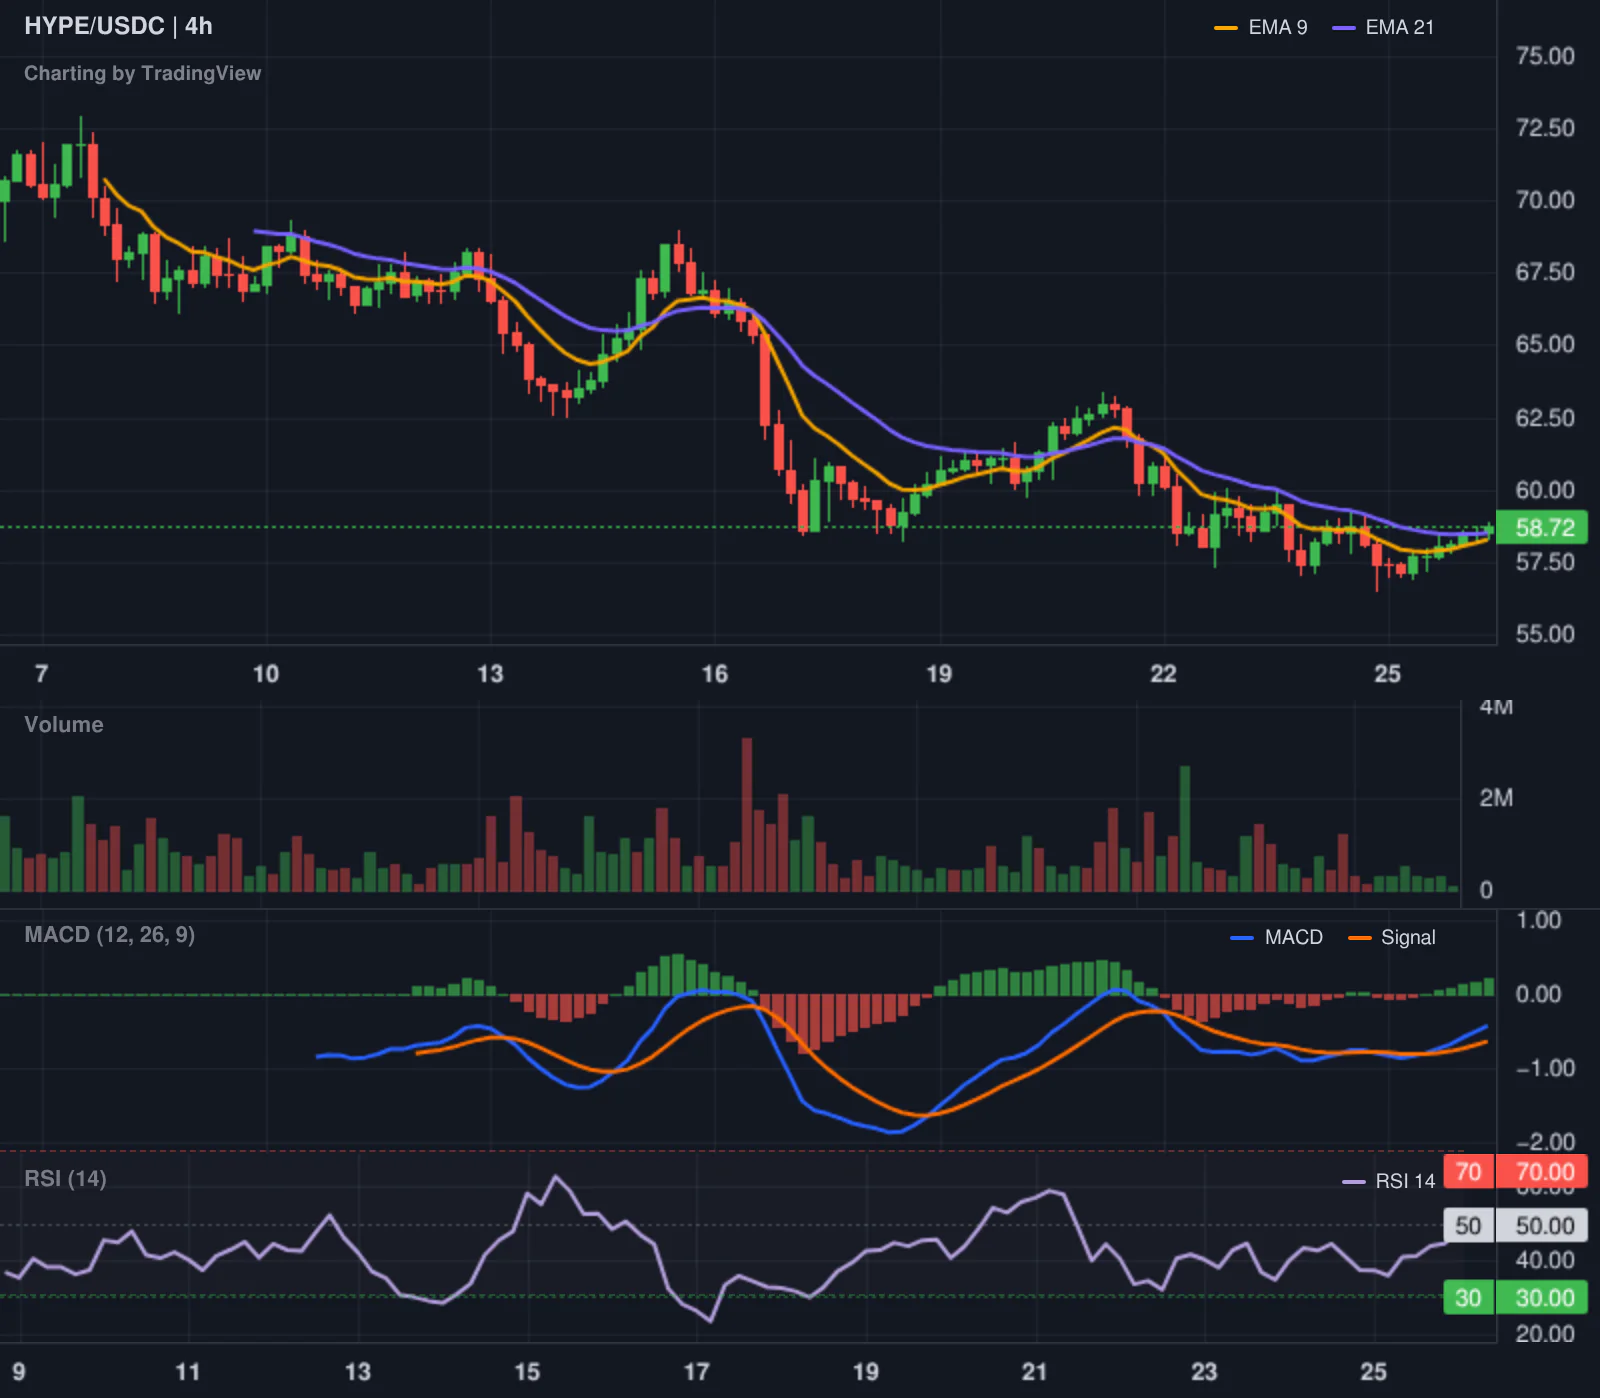
Hyperliquid is one of the notable gainers, rising 2.10% to $58.72. TRON remains steady, up 0.80% at $0.3320. The general trend is a slow, synchronized climb that lacks the volatility usually associated with a genuine trend reversal.

News driving today's market

The regulatory environment is a mix of institutional legitimacy and targeted aggression. On the bullish side, Fidelity is pushing for the Senate to pass the CLARITY Act, and a Bitcoin advocacy group is joining the US State Department’s digital freedom program. These moves suggest that the US government is increasingly treating Bitcoin as a strategic asset rather than a nuisance. Similarly, Sberbank's plan to build crypto trading infrastructure by December shows that even in fractured geopolitical climates, the demand for digital asset rails is persistent.

However, the "AI Kill Switch Act" introduced by US lawmakers creates a significant overhang for AI-linked tokens. The idea that the government could shut down a model if it breaches a sandbox introduces a level of regulatory risk that the market hasn't fully priced in. We see this as a potential drag on any AI-driven recovery.

On the risk side, the EU has added HTX to its Russia sanctions list, barring transactions from August 23. This is a reminder that centralized exchanges remain a systemic point of failure. Combined with the report of North Korean authorities arresting their own bank hackers who used crypto for laundering, the narrative of "regulatory cleanup" is intensifying. While this is good for long-term legitimacy, it often creates short-term volatility as illicit flows are squeezed.

Social intelligence

The social feed is focused on the operational realities of the industry. Data from the Cambridge Centre for Alternative Finance indicates that hydropower has overtaken natural gas as the primary energy source for Bitcoin mining. This shift toward lower-carbon energy is a quiet win for the network's ESG narrative, even if the total electricity consumption has risen.

Operational paranoia is also on display. Binance's internal "Red Team" is running monthly phishing tests on employees, with repeat failures potentially leading to dismissal. It is a blunt approach to security, but in an industry where a single leaked key can end a company, the ruthlessness is understandable.

Macro sentiment is slightly buoyed by reports that Iran has paused retaliatory strikes after the US did the same. This reduces the immediate risk of a geopolitical shock. Meanwhile, Bloomberg notes that the European stock rally is heavily concentrated in a few AI chip stocks. This concentration suggests that the "risk-on" mood is very narrow, which explains why the crypto market is struggling to find a broad bid.

Trading ideas worth watching

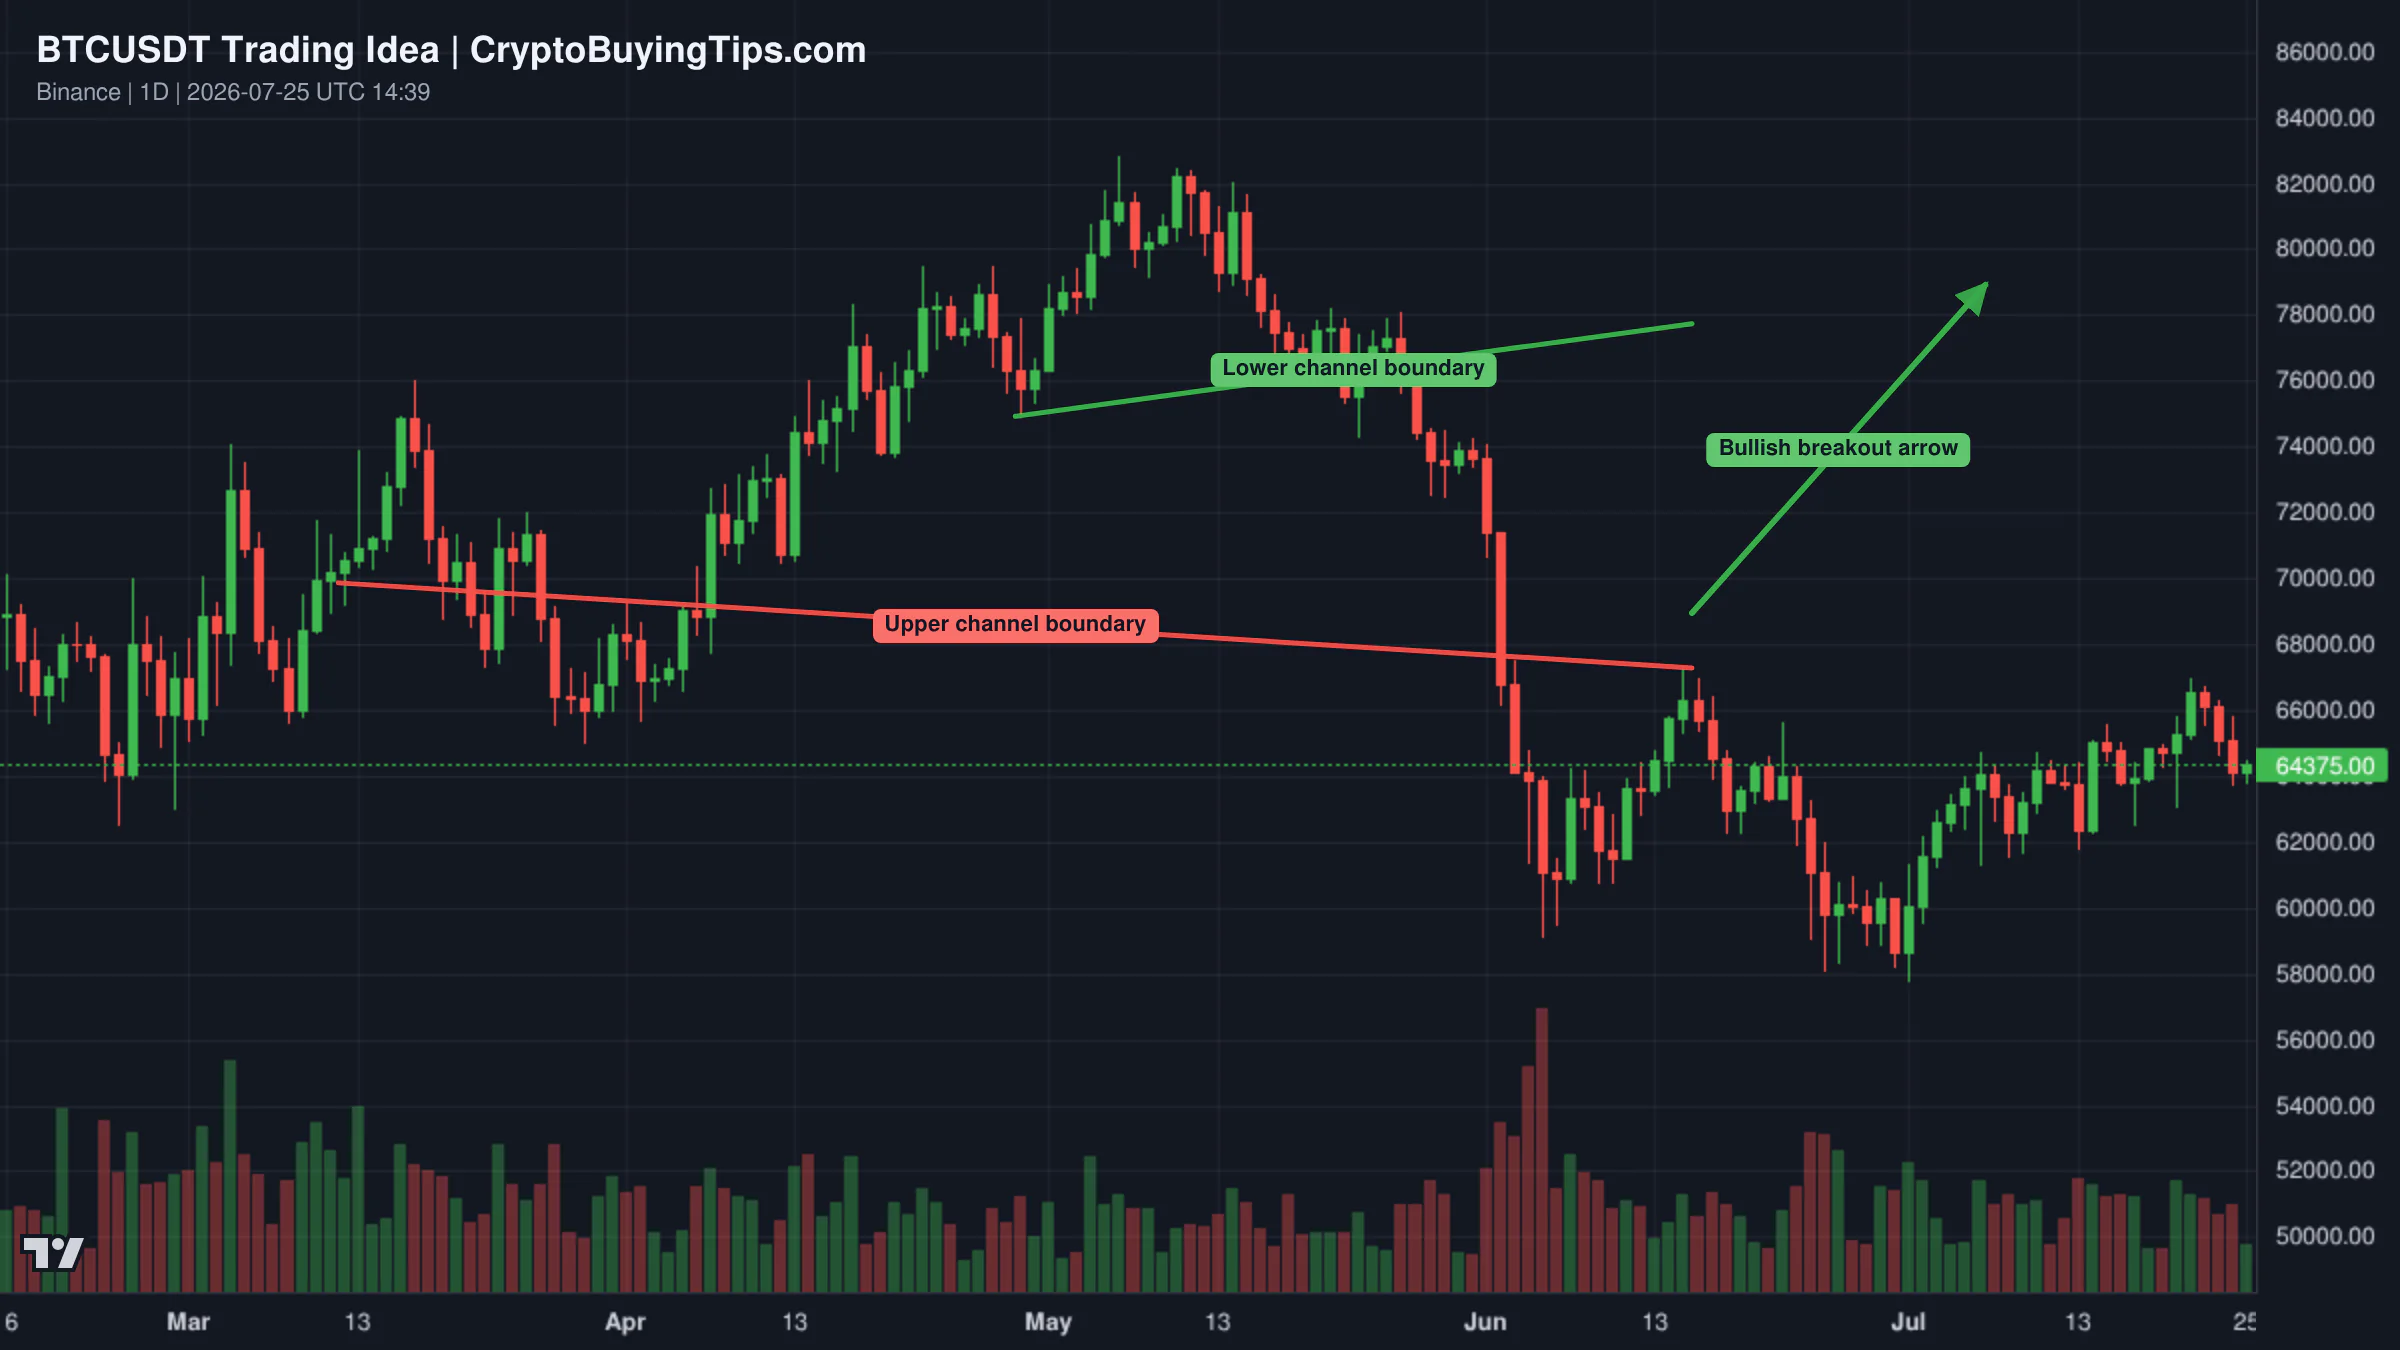
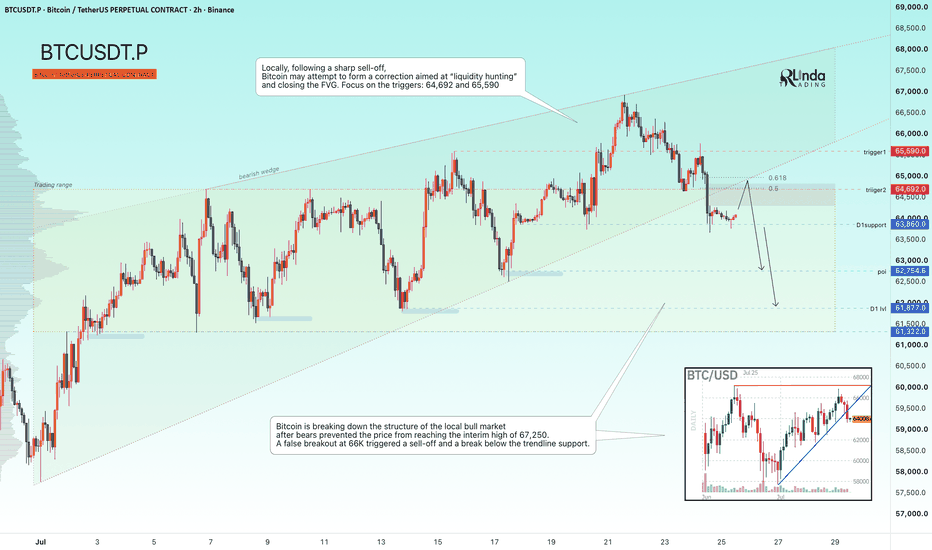
There are two conflicting views on Bitcoin right now. One analyst, RLinda, sees this as a countertrend correction. The read is that the broader bearish distribution phase is still in control and this bounce is merely a liquidity sweep. The key resistance levels are 64,692 and 65,590. If the market fails to break these, we expect another leg lower toward 63,860 or even 61,322. This is a cautious approach that prioritizes the higher-timeframe trend over the current marginal gain.

Redrawn BTCUSDT 1D trading idea chart for Bitcoin path to 80K$ is now clear only after a breakout else 50KTrading idea chart: BTCUSDT.P - BITCOIN - A countertrend correction before a decline

Conversely, MMBTtrader is tracking an inverse head and shoulders pattern. This is a more optimistic setup, but it requires a specific trigger. The neckline resistance sits near 67K. If Bitcoin can break and hold above 67K with significant volume, the path toward 80K opens up. Until that break happens, the pattern is just a formation, and further dips toward the right shoulder support are expected.

Smart Money Signals — Hyperliquid Leaderboard

Hyperliquid SHORT HYPE leaderboard chart

Our tracker has flagged a significant move by @TudorCross, who boasts an all-time ROI of over 6,000%. This trader has opened a short position in HYPE at an entry price of $58.17, with a notional value of approximately $40,676.

This is a direct bet against the recent strength of Hyperliquid. Given the trader's track record, this signal suggests that the current price level is viewed as overextended. It is a high-confidence play that contradicts the general market drift.

Altcoin Spotlight

Hyperliquid deserves attention today not just because of its price action, but because of the conflict between its momentum and smart money positioning. While the asset is up 2.10% and ranks in the top ten, the short from a top leaderboard trader suggests a looming correction. It is a classic battle between the trend and the "smart" money.

What to watch next

The coming days will be a test of whether the current price stability is a foundation or a facade. The collapse in volume is the most worrying metric. When prices rise while volume disappears, it usually means the market is waiting for a catalyst that hasn't arrived yet.

We are watching the 67K level for Bitcoin as the definitive line between a bear market rally and a new bullish phase. On the regulatory front, the "AI Kill Switch" narrative could quickly turn from a news item into a price driver if lawmakers move toward a final vote. If the volume does not return, the current marginal gains are likely irrelevant.