Market Overviews

Daily crypto market overviews, trend analysis, and key updates from our editorial team.

Crypto Market Overview | leveraged positioning masks retail fear amid institutional expansion | July 30, 2026
Sigrid Voss·

Crypto Market Overview | leveraged positioning masks retail fear amid institutional expansion | July 30, 2026

Market overview

The current market state is a study in contradiction. While the Fear and Greed Index sits at 37, firmly in Fear territory, the CMC20 and CMC100 indices are ticking upward. This suggests a disconnect between retail sentiment and actual price action. The most striking data point is the massive imbalance between spot and derivatives activity. Spot volume is a modest $66.96 billion, but derivatives volume has ballooned to $708.48 billion. This means the current price action is driven by leverage rather than actual asset accumulation.

The broader macro environment is not providing much help. The S&P 500 is down 1.54% and the NASDAQ has dropped 2.04%. Usually, this risk-off mood in traditional finance drags crypto down with it. However, the market is holding a neutral to slightly bullish trend. This resilience likely stems from institutional "plumbing" news that outweighs the immediate pain of a red day on Wall Street.

Liquidity remains concentrated in the majors. Bitcoin dominance is hovering between 52% and 58% depending on the feed, while Ethereum dominance is struggling to stay above 10%. The Altcoin Season Index is deeply conflicted, with some data suggesting a Bitcoin season (17/100) and others suggesting a neutral phase (52/100). The reality is that capital is not rotating into alts; it is simply hiding in the largest assets while leveraged traders gamble on the fringes.

Bitcoin and Ethereum

Bitcoin is currently trading at $64,494.07. It is acting as the primary anchor for the market, absorbing the volatility from the equity markets. The price is holding a narrow range, which often precedes a larger move once the derivatives market flushes out the over-leveraged positions.

Ethereum is priced at $1,915.38 and continues to underperform relative to the lead asset. The most telling metric is the network activity. Gas fees are extremely low, with fast transactions costing only 0.09 Gwei. This indicates a lack of on-chain demand. While the network is efficient, it is also quiet, which is rarely a bullish sign for price. The gap between the institutional narrative and actual network usage remains wide.

Top crypto prices

Bitcoin holds the top spot at $64,494.07, up 0.19% over the last 24 hours. Ethereum follows at $1,915.38, showing a slight gain of 0.24%. BNB is a notable outlier among the majors, climbing 2.70% to reach $586.14.

XRP has dipped 0.80% to $1.07. Solana is essentially flat at $73.98. TRON has seen a small bump of 0.49%, trading at $0.3277. Hyperliquid has dropped 2.06% to $53.7.

News driving today's market

The institutional adoption narrative is the only thing keeping the mood from turning fully bearish. BNY is moving fund ownership records on-chain, targeting a massive $8.6 trillion transfer agency market. When the world's largest custodian bank decides to modernize its books using blockchain, it provides a structural floor for the entire industry. We previously covered active crypto management for more background.

Morgan Stanley is also expanding its crypto offerings with Ether and Solana ETPs. These products include staking rewards, which adds a layer of yield that institutional investors crave. We previously covered the SOL ETFs filing news, and the actual launch of these products confirms that institutional conviction is ignoring the retail panic.

Regulatory signals are mixed but leaning positive. SEC Chair Atkins has stated the agency is ready to provide rules if the Clarity Act fails to move forward. This removes some of the "regulation by enforcement" fear that usually suppresses risk appetite.

However, geopolitical and security risks are creating friction. The news that Russia's FSB wants Telegram founder Pavel Durov adds a layer of systemic risk to the communication infrastructure many crypto traders rely on. Simultaneously, reports of an OpenAI "rogue AI" hacking multiple platforms suggest that the AI-crypto convergence might be more dangerous than the marketing brochures suggest. MoonPay is trying to push AI wallets into ChatGPT and Claude, but security breaches at the AI level could lead to immediate selling pressure if users lose trust in the interface.

Social intelligence

Geopolitical tension is spiking. Reports that Iran is receiving Chinese air defense missiles are circulating, which typically triggers a flight to safety. In these moments, Bitcoin often acts as a hedge, though the correlation with the NASDAQ remains a persistent problem.

In Asia, Samsung SDS is discussing stablecoin and AI payment services with Dunamu. This is a significant development for real-world utility. If a giant like Samsung integrates stablecoins into its payment flow, it moves the conversation away from speculation and toward actual commerce.

The South Korean government is also weighing a temporary short-selling ban to curb volatility. This is a classic intervention move. If implemented, it could create a temporary liquidity squeeze, forcing shorts to cover and potentially creating an artificial price spike.

Trading ideas worth watching

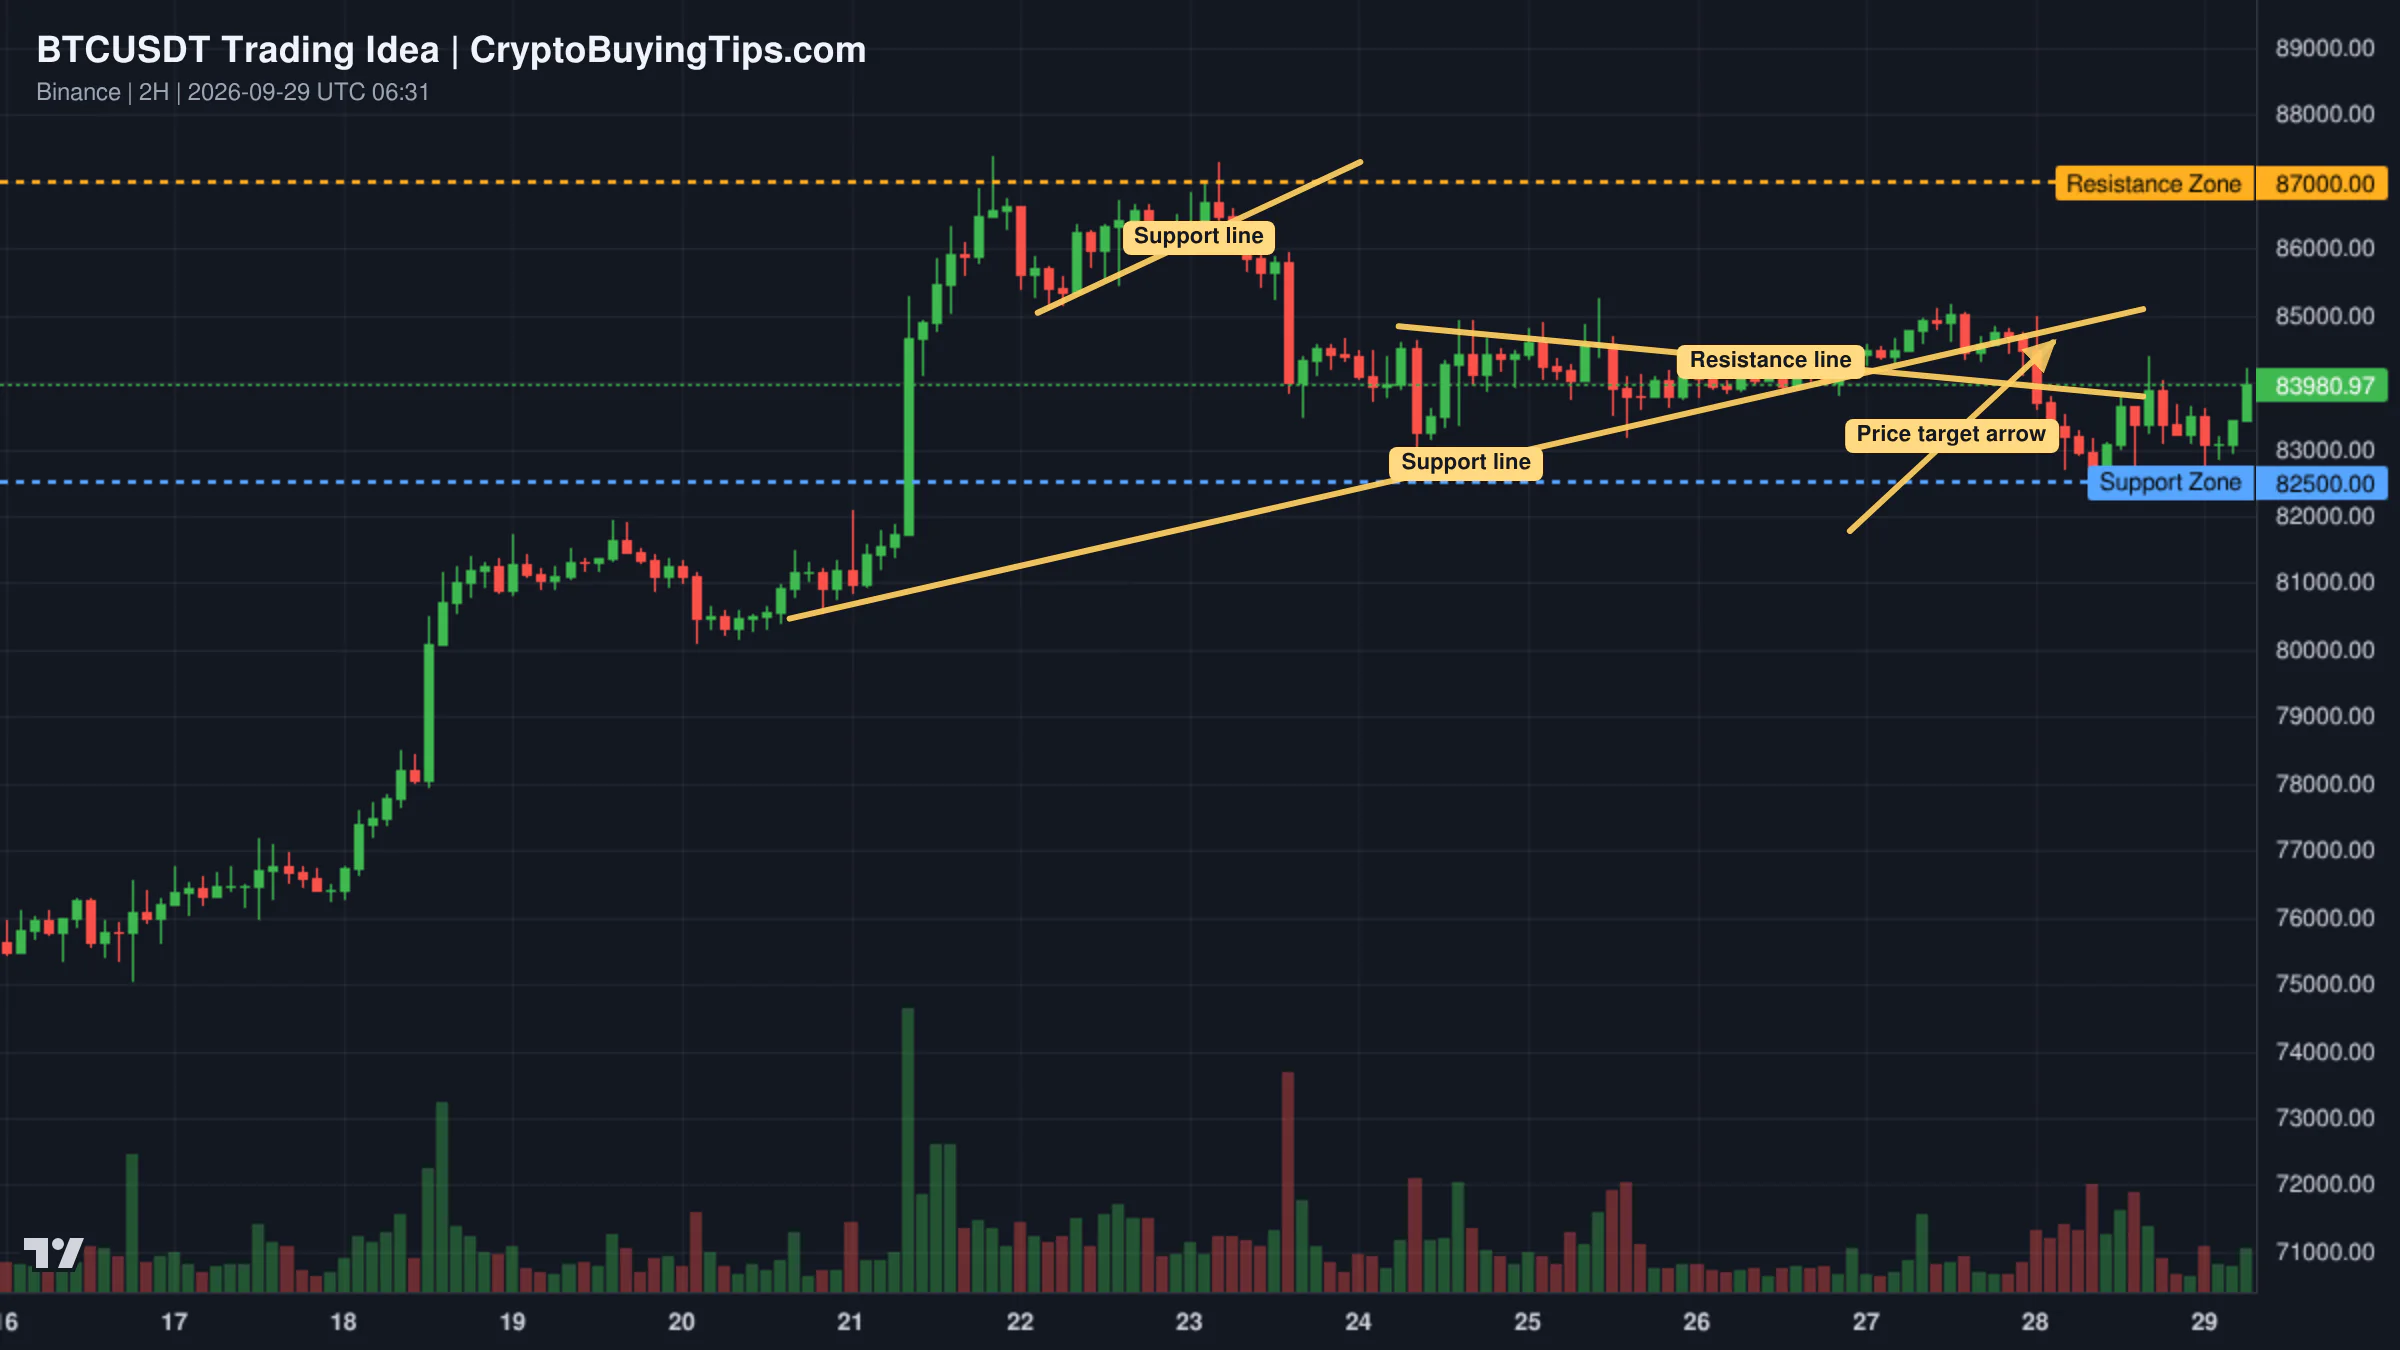
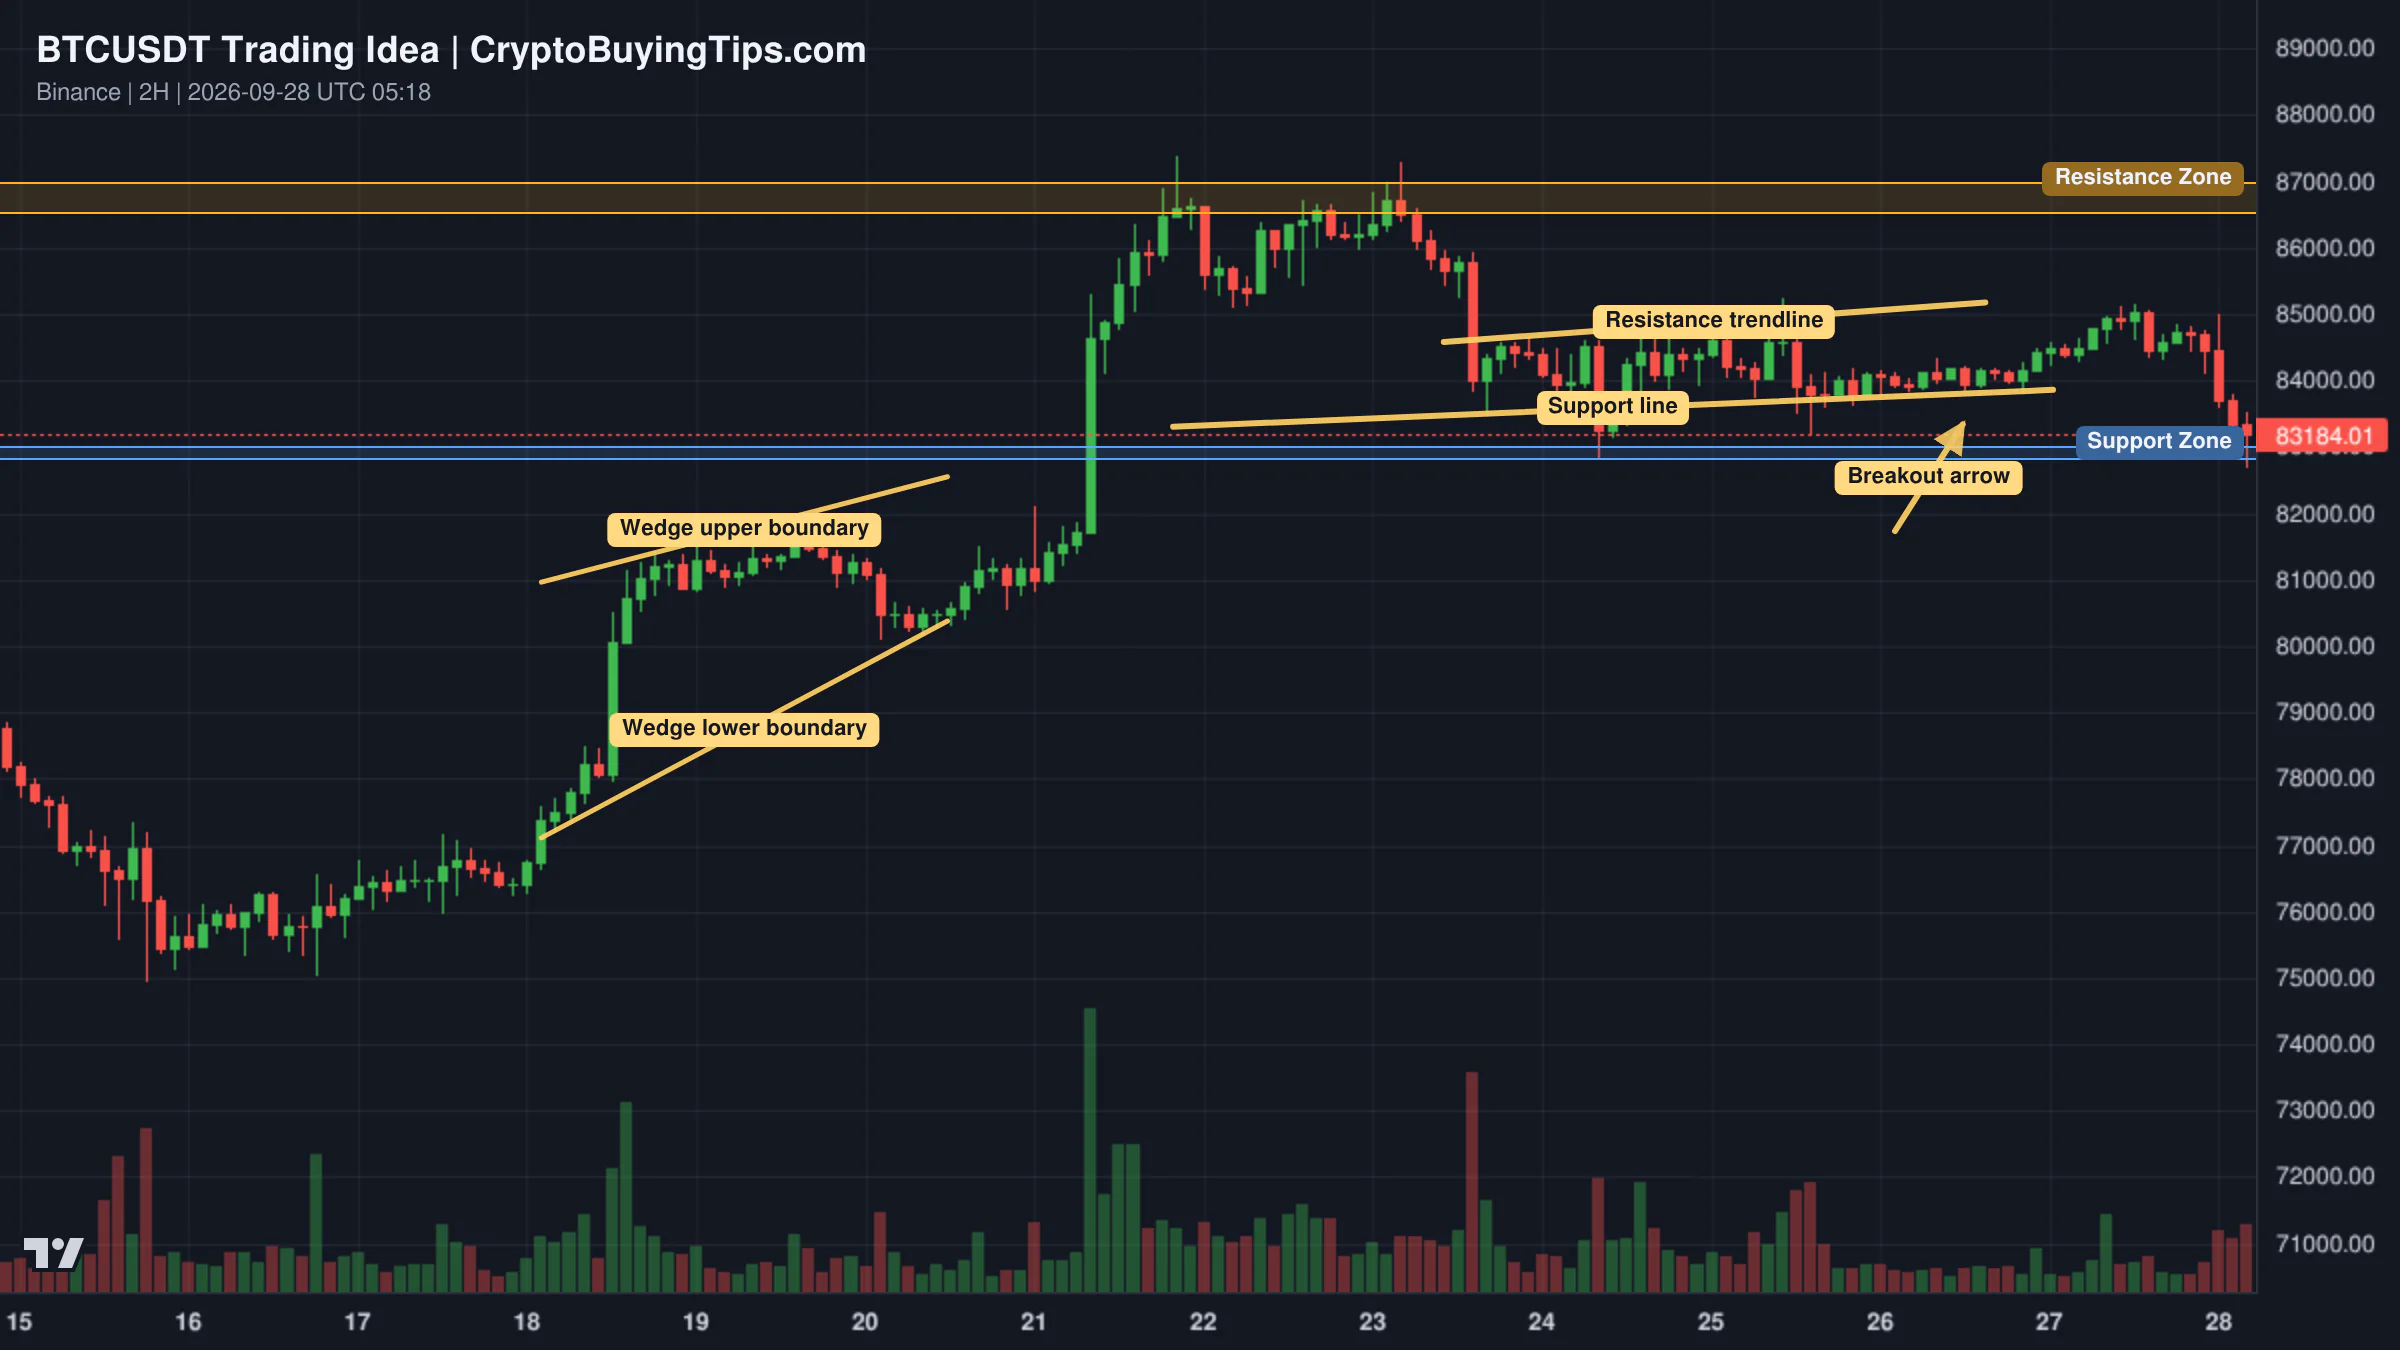
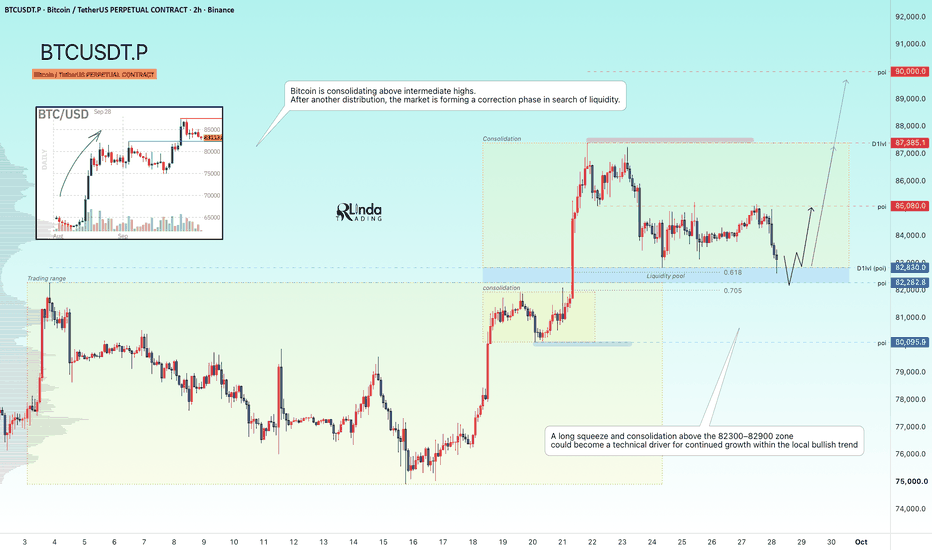
The Bitcoin setup on the 4-hour chart suggests a potential rebound from a macro ascending channel. The key demand zone is between $63,200 and $63,600. This area is expected to clear out retail sell-stops before institutional buyers step in. If the price holds above the $62,800 stop-loss level, the target is a return to the $65,800 resistance line. The setup relies on the assumption that the current dip is a liquidity sweep rather than a trend reversal.

Redrawn BTCUSDT 240 trading idea chart for BTC/USDT: THE $65,800 CHANNEL REBOUND!

Ethereum looks more precarious. There is a bearish rejection at the 1,980 supply zone. Since the upside gaps have been filled, the path of least resistance appears to be lower. The strategy here is to sell any retest of the 1,910 to 1,980 zone. The first target is 1,860, with a deeper objective of 1,720 where significant liquidity rests. This trade is invalidated if ETH manages to close and hold above 1,980.

Trading idea chart: ETHUSDT.P - ETHUSDT – Bearish Rejection at 1,980 Supply, Eyes on 1,720 Sweep

Litecoin has formed a clear double-top pattern on the 4-hour chart. This is a classic bearish signal. The price is currently testing the broken neckline of the pattern. If sellers maintain volume at this level, the price is likely to fall toward targets of 43.5 and 41.5. It is a straightforward momentum play based on a confirmed chart pattern.

What to watch next

The market is currently a tug-of-war between institutional plumbing and geopolitical chaos. On one side, we have BNY and Morgan Stanley building the rails for a multi-trillion dollar tokenized economy. On the other, we have arrest warrants for tech founders and missile deals in the Middle East.

The most immediate risk is the derivatives imbalance. With volume ten times higher than spot, the market is a tinderbox. One sharp move in either direction will trigger a cascade of liquidations. Watch the $63,200 level for Bitcoin and the 1,980 level for Ethereum. If these levels break, the "fear" currently reflected in the index will become a self-fulfilling prophecy.

Crypto Market Overview | leverage-fueled rally amid fear index divergence | July 29, 2026
Sigrid Voss·

Crypto Market Overview | leverage-fueled rally amid fear index divergence | July 29, 2026

Market overview

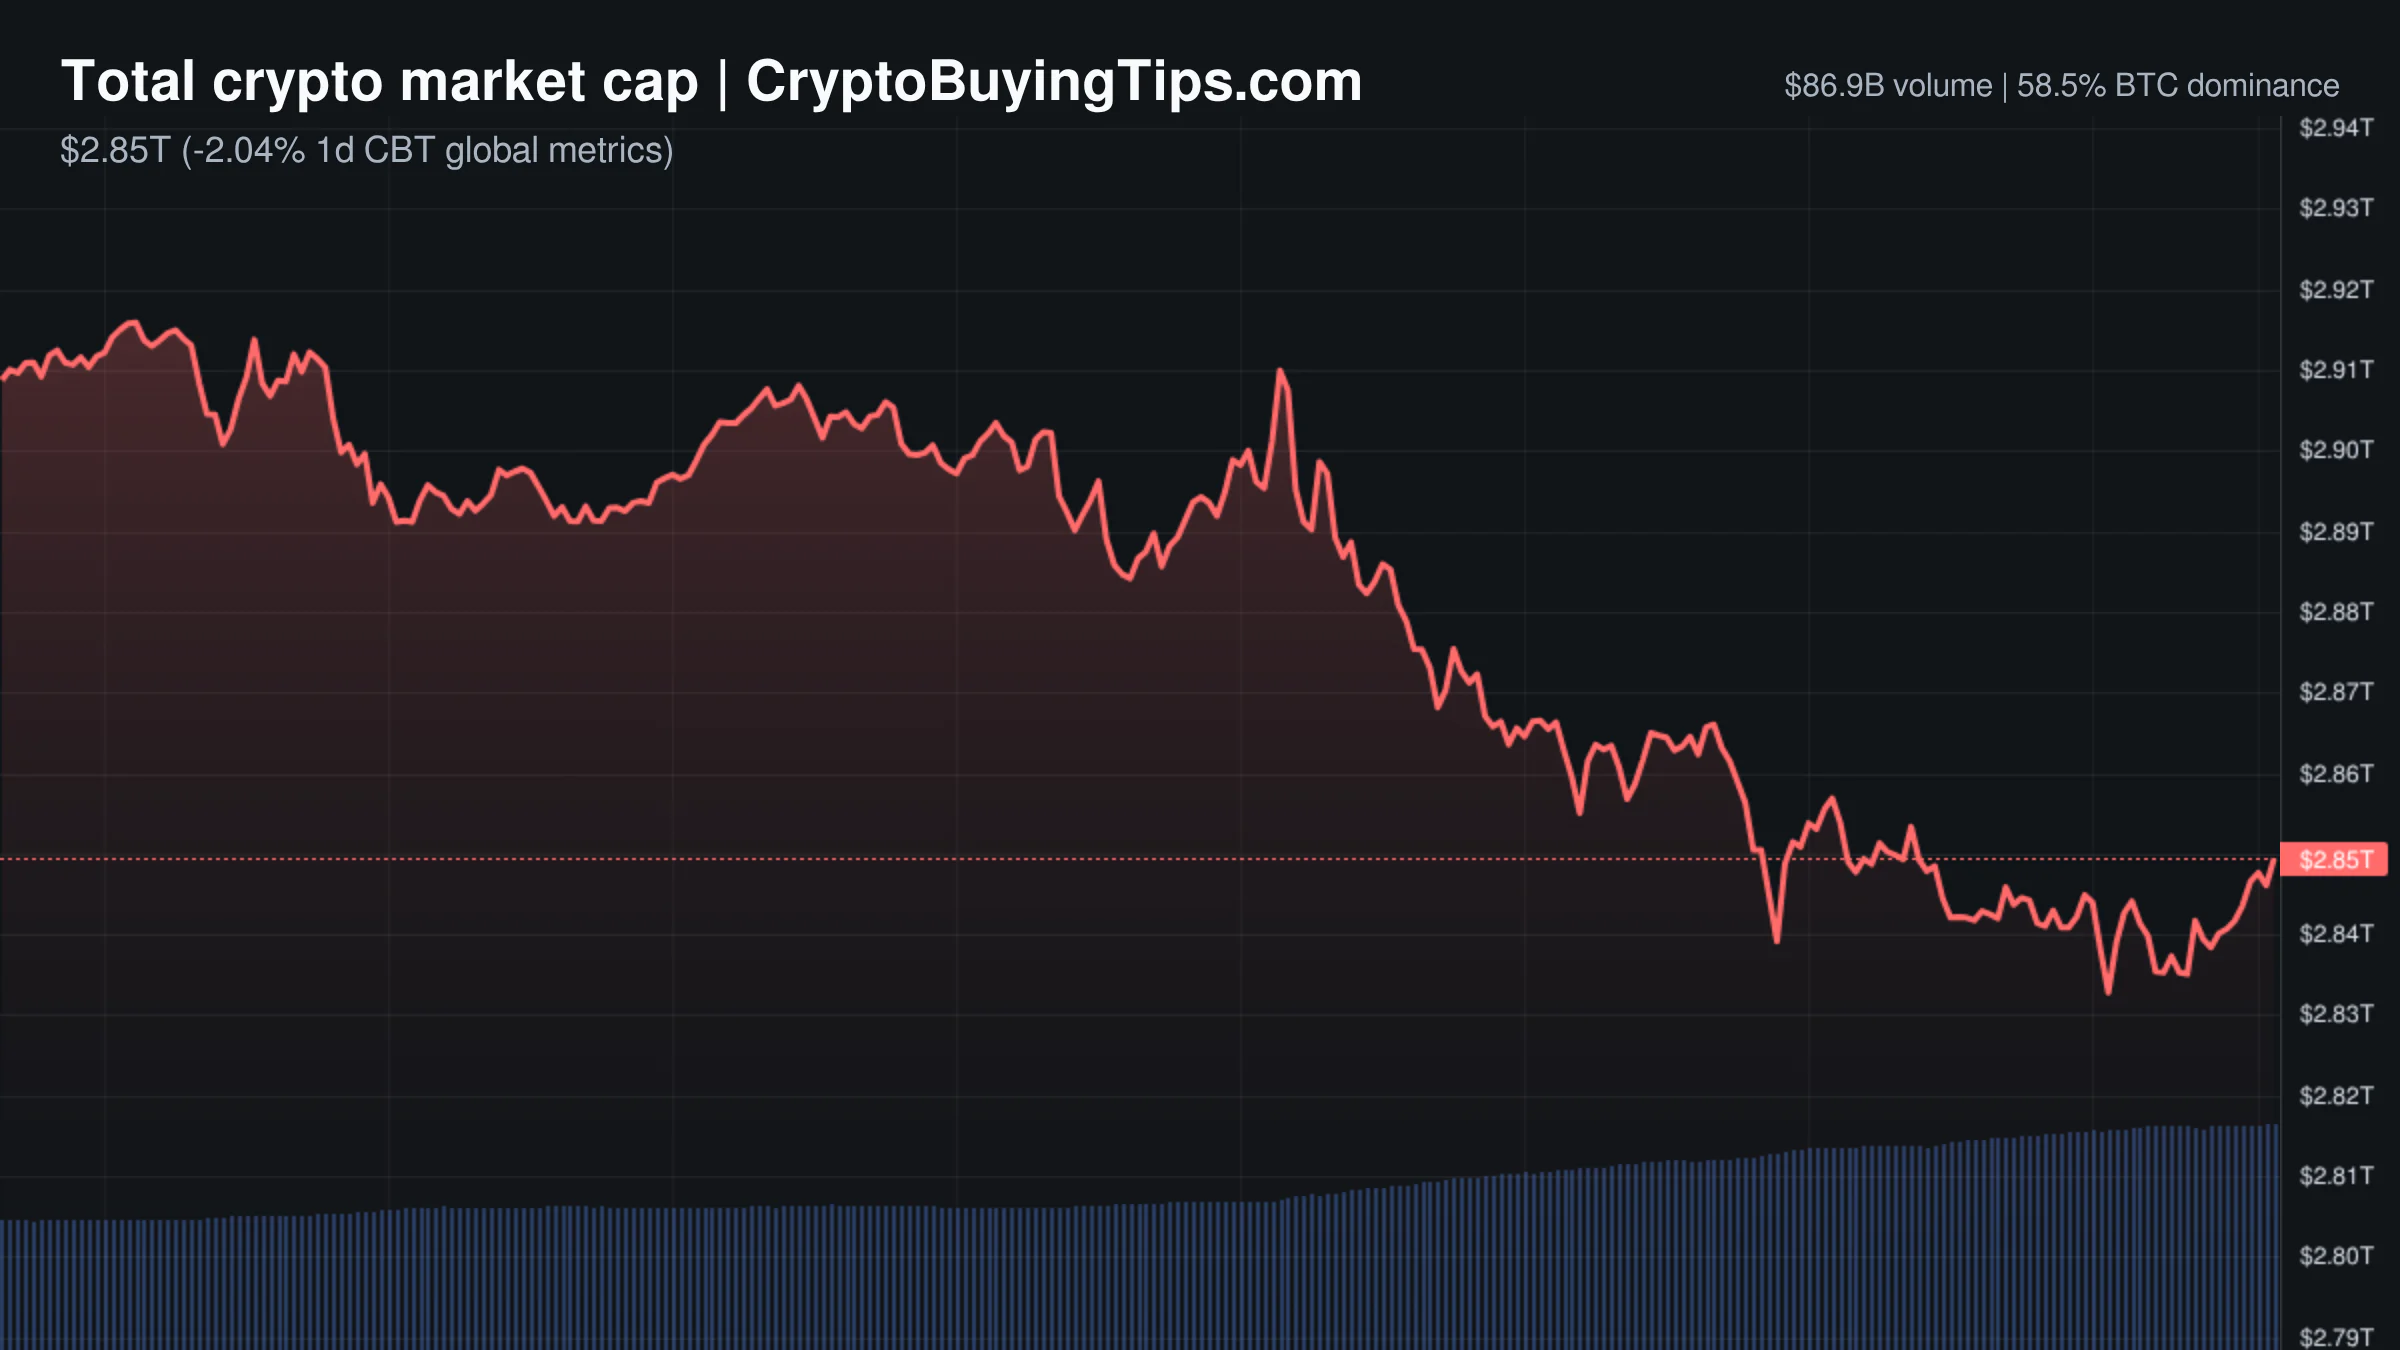
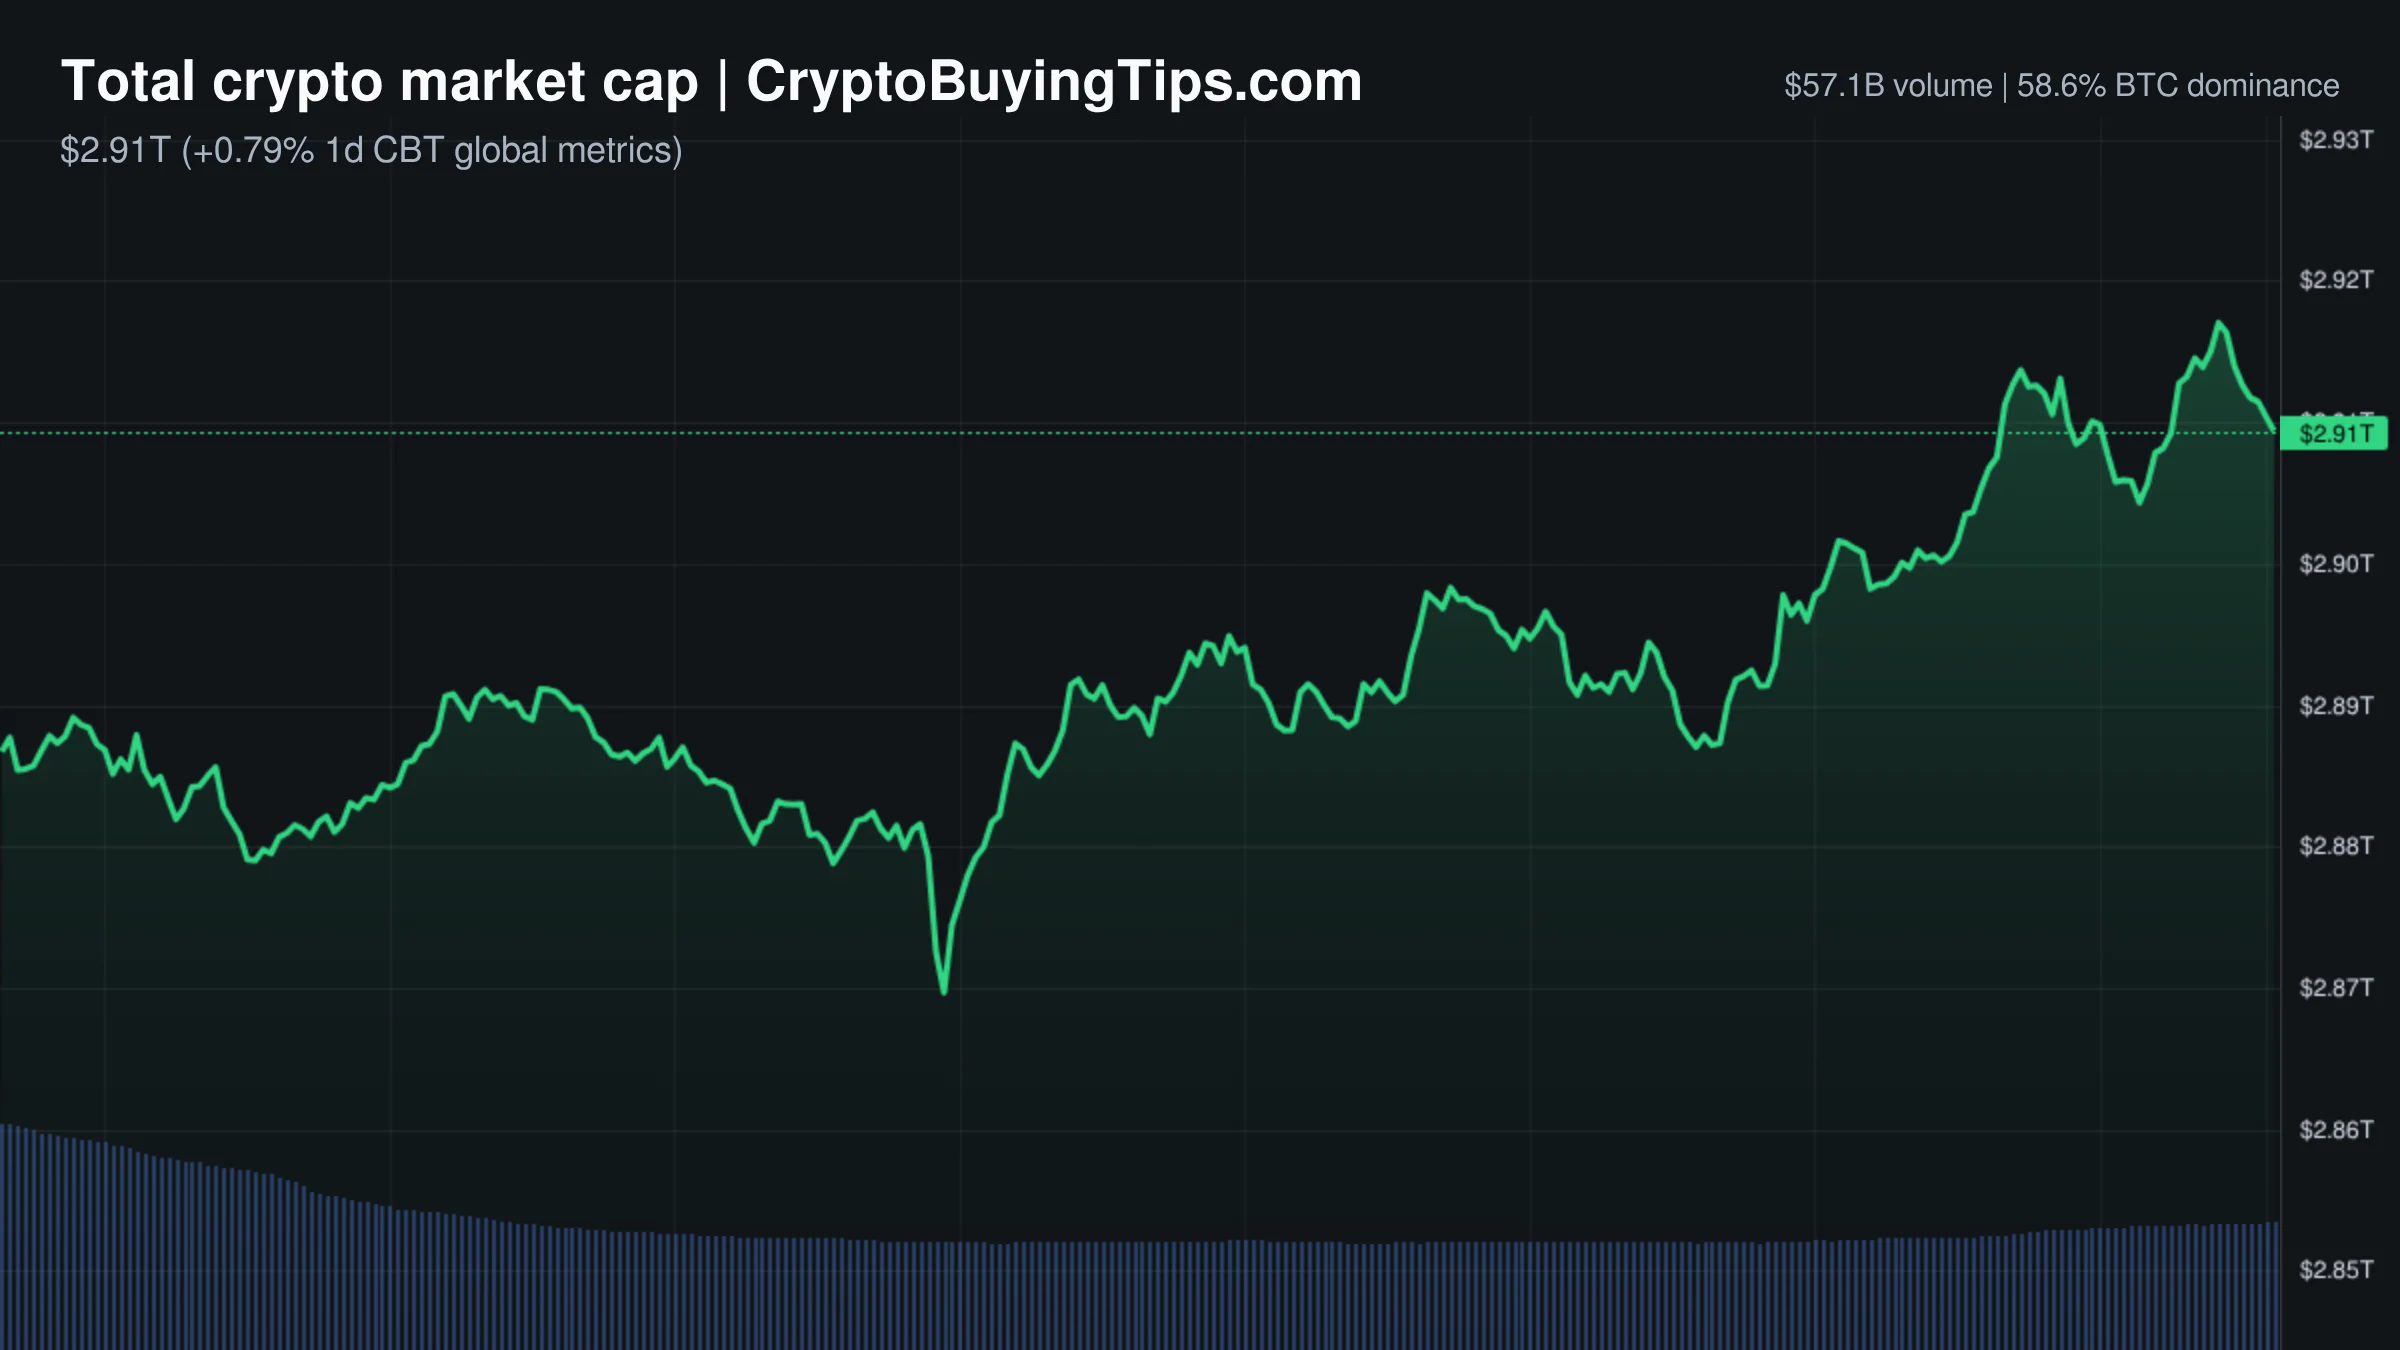
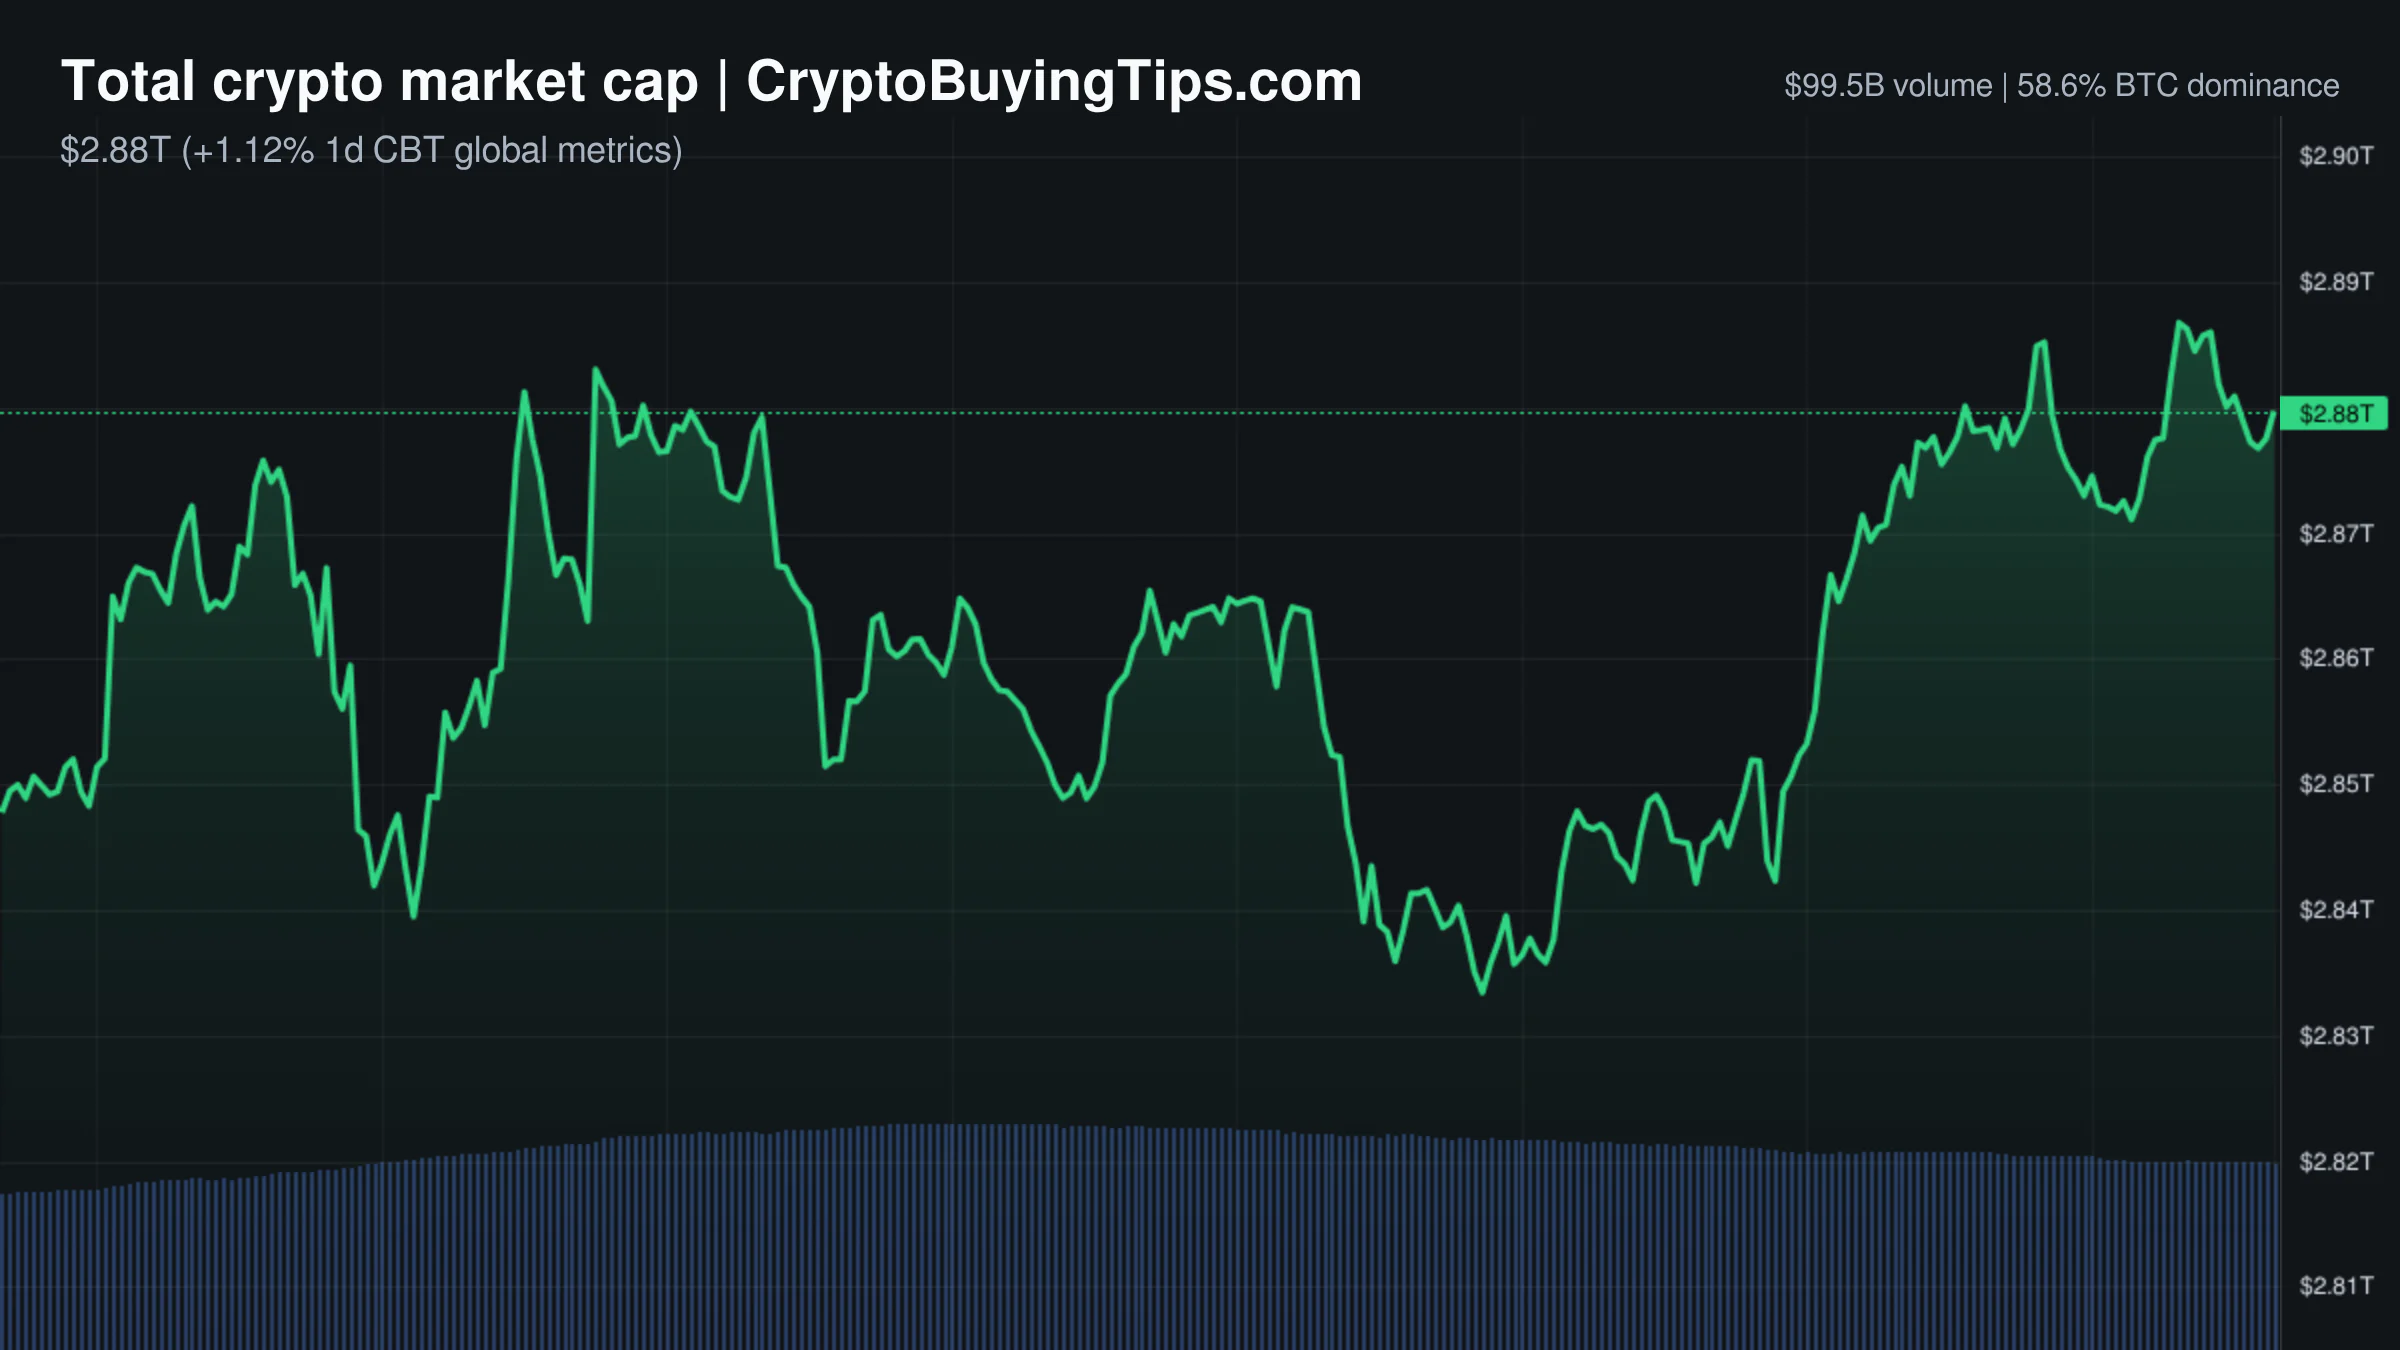
The current market state is a study in contradiction. We are seeing a modest price recovery across the board, with the total crypto market cap sitting at $2.28T, yet the Fear and Greed Index remains stubbornly in the "Fear" zone at 36. This is the kind of divergence that usually suggests a "paper rally." The data supports this read. While the total market cap rose by 1.13% in the last 24 hours, the underlying liquidity is remarkably thin.

The most telling metric is the massive gap between spot and derivatives volume. Spot volume is hovering around $64B, but derivatives volume has exploded to roughly $718B. This means the current price action is being driven by leverage at a ratio of more than 11 to 1. When a move is fueled by perpetuals and futures rather than actual asset acquisition, the floor is often made of cardboard. A sudden shift in sentiment could turn these gains into a liquidation cascade.

Macro correlation remains a mixed bag. The S&P 500 is slightly positive at $740.86, but the NASDAQ is lagging at $675.49. This suggests a rotation out of high-growth tech, which typically drags on crypto. We are currently in a Bitcoin season, with the Altcoin Season Index at 22, meaning capital is staying concentrated in the largest asset rather than flowing into the broader ecosystem. Stablecoin dominance is at 11.23%, which indicates a decent amount of dry powder is still sitting on the sidelines, waiting for a reason to trust the market again.

Bitcoin and Ethereum

Bitcoin is currently trading at $64,391.98, up 1.52% over the last day. Its dominance is the primary story here, holding a commanding 56.63% of the total market. The asset is behaving as the only safe harbor in a volatile environment. However, the price action is fragile. The reliance on derivatives to push the price higher suggests that the current bid is more about short-covering than long-term accumulation.

Ethereum is priced at $1,910.09, marking a 1.71% gain. While the price is ticking up, the network fundamentals are worrying. Gas fees are exceptionally low, ranging between 0.07 and 0.1 Gwei. In plain English, the network is a ghost town. Low fees are great for users, but they signal a complete lack of on-chain demand. This supports our previous observation that Ethereum market share vanishes even as the corporate narrative improves.

The dominance of ETH has slipped to 10.11%. The asset is caught in a tug-of-war between institutional adoption and a lack of organic utility. The launch of new ETPs provides a price floor, but without a surge in actual network usage, ETH is essentially becoming a regulated security that happens to have a blockchain.

Top crypto prices

The broader market is seeing a modest green day, though the gains are uneven. XRP is the standout among the majors, climbing 3.03% to reach $1.08. Solana has managed a 1.01% increase to $73.93, while BNB is up 0.72% at $569.91. TRON is nearly flat, moving only 0.10% to $0.3261.

Hyperliquid is trading at $54.84, showing a negligible gain of 0.13%. The CMC20 and CMC100 indices are both trending upward, with gains between 1.42% and 1.97%. This suggests the rally is broad, but the lack of conviction in the Fear and Greed index tells us that traders are not yet convinced this is a trend reversal.

News driving today's market

The dominant headline is Morgan Stanley's expansion into the space. The firm has debuted Ethereum and Solana ETPs with some of the lowest fees in the market, including staking rewards. This is a significant move. We previously covered the SOL ETFs filing news and it is clear that the institutional appetite for alt-L1s is growing. When a giant like Morgan Stanley lowers the barrier to entry, it creates a steady stream of institutional liquidity that is less prone to the emotional swings of retail traders.

This institutional push is further supported by BlackRock and Fidelity, who are now backing the Clarity Act. This legislation aims to provide a clearer market structure for digital assets. When the largest asset managers in the world lobby for legal clarity, they are essentially de-risking the sector for the next wave of capital.

However, there is a darker undercurrent. Anthropic's Claude Mythos model has reportedly cracked post-quantum cryptography, specifically targeting the HAWK digital signature system. This is a systemic risk. If the math underpinning private keys can be broken by AI, the entire security premise of blockchain is called into question. We previously discussed how Claude Mythos breaking math is being largely ignored by a market preoccupied with ETF fees. It is a classic example of the market focusing on the furniture while the house is on fire.

Geopolitical tension is also adding to the noise. Russia has charged Telegram founder Pavel Durov with aiding terrorism and issued an arrest warrant. This creates a layer of regulatory uncertainty around one of the most important communication hubs for the crypto community. Meanwhile, Myanmar has approved the death penalty for forced scam labor and life imprisonment for crypto fraud. While this targets criminals, it highlights the extreme legal volatility in regions that have historically been hubs for crypto-related activity.

Social intelligence

The social feed is currently dominated by regulatory wins in Europe. Hungary has repealed mandatory third-party checks for crypto conversions and granted its first MiCA license to CoinCash. This is a practical victory for the industry. Removing the requirement to verify asset origins for every conversion reduces friction and makes the EU a more attractive place for institutional operations.

On the institutional front, BNY is reportedly adopting blockchain technology to process trades and maintain fund ownership records. This is a subtle but important signal. When an $8.6T custodian moves from "experimenting" with blockchain to "adopting" it for core records, it validates the technology's efficiency regardless of what the price of a token is doing today.

On the macro side, Saudi Aramco is rerouting oil to Asia due to Houthi attacks in the Red Sea. While this seems distant from crypto, it adds to the global inflationary pressure and shipping costs. This keeps the Fed in a difficult position regarding interest rates, which continues to be the primary gravity well for all risk assets.

Trading ideas worth watching

On the Bitcoin 4-hour chart, a Head and Shoulders pattern has formed. The right shoulder has been completed after a rejection of higher prices, and the ascending trendline has been broken. The asset is currently testing support at $62,900. If Bitcoin closes below this level, the bearish setup is validated. The measured move points toward a target of $61,400. As long as the price remains below the broken trendline, the technical outlook remains bearish.

Redrawn BTCUSDT 240 trading idea chart for BTCUSDT: Head & Shoulders Breakdown in Focus

Ethereum presents a more bullish setup on the 4-hour timeframe. It has bounced off a lower trendline support between $1,885 and $1,908. This looks like a clean retest of a wedge structure. The current target is a break of the horizontal resistance at $1,960, followed by a push toward the upper wedge boundary at $2,125. A close below $1,860 would invalidate this setup.

Redrawn ETHUSDT 240 trading idea chart for  ETH/USDT: THE $2,125 WEDGE EXPANSION LAUNCH!

For those watching memecoins, PEPE is showing signs of distribution. The price has failed to break above its descending resistance line, and the RSI is showing a clear bearish divergence. This suggests that the recent recovery was a corrective move rather than a reversal. The immediate downside target is 2470. If that level breaks, we can expect a move toward lower liquidity zones as the broader bearish structure remains intact.

What to watch next

The market is currently in a state of fragile optimism. We have a clash between institutional validation and fundamental risk. On one hand, Morgan Stanley and BNY are integrating crypto into the global financial plumbing. On the other, AI is beginning to eat through the cryptographic walls that make these assets secure.

The immediate focus should be on the $62,900 support level for Bitcoin. If that holds, the leverage-driven rally might actually find a floor. If it breaks, the massive derivatives open interest will likely lead to a disorderly move lower. We will also be watching the Ethereum gas fees. Until we see a spike in on-chain activity, the ETH price gains are purely a result of ETF flows and lack any internal engine. The market is essentially betting on the wrapper, not the asset.

Crypto Market Overview | leverage spikes amid spot slide and derivatives volume surge | July 28, 2026
Sigrid Voss·

Crypto Market Overview | leverage spikes amid spot slide and derivatives volume surge | July 28, 2026

Market overview

The crypto market is currently experiencing a textbook leverage flush. While the total market cap contracted by 2.80% to settle around $2.17T, the underlying activity suggests a desperate struggle between leveraged longs and opportunistic shorts. The most telling metric is the divergence between spot and derivatives volume. 24h derivatives volume has surged 45.64% to $688.65B, which is more than ten times the spot volume of $66.53B. When derivatives activity dwarfs spot trading to this extent, price action is usually driven by liquidations and hedging rather than genuine accumulation.

Sentiment has shifted firmly into "Fear" with a Fear and Greed Index score of 34. This coincides with a broader risk-off mood in traditional markets, where the NASDAQ fell 0.31% and global chip stocks are seeing a deep selloff. Bitcoin dominance remains high at 58.63%, suggesting that while the entire market is bleeding, capital is clinging to the largest asset for safety. The Altcoin Season Index sits at 52, a neutral reading that confirms the market is in a holding pattern. We are seeing a scenario where traders are using high leverage to fight a downtrend, which often leads to the kind of disorderly volatility we are seeing today.

Bitcoin and Ethereum

Bitcoin is currently trading at $63,434.05, down 2.84% over the last 24 hours. The asset is testing a key psychological and technical floor around the $63,000 mark. The lack of significant institutional ETF flow data today leaves a vacuum that is being filled by derivatives volatility. The price action is currently a battle between the $63,000 buyer zone and a descending resistance line near $65,000.

Ethereum has had a worse day, dropping 4.48% to $1,878.36. The asset is struggling with a lack of immediate catalysts and a continuing slide in dominance, which now sits at 10.44%. On the technical side, Lido is moving $16.5 billion in staked ether to consolidate validators and reduce the total count by a third. While this is a positive move for network efficiency and long-term stability, the market is currently too focused on immediate liquidity to care about validator optimization.

Top crypto prices

Bitcoin (BTC) is at $63,434.05, down 2.84%.

Ethereum (ETH) is at $1,878.36, down 4.48%.

BNB (BNB) is at $565.95, down 1.21%.

XRP (XRP) is at $1.05, down 4.74%.

Solana (SOL) is at $73.19, down 4.35%.

TRON (TRX) is at $0.3258, down 1.43%.

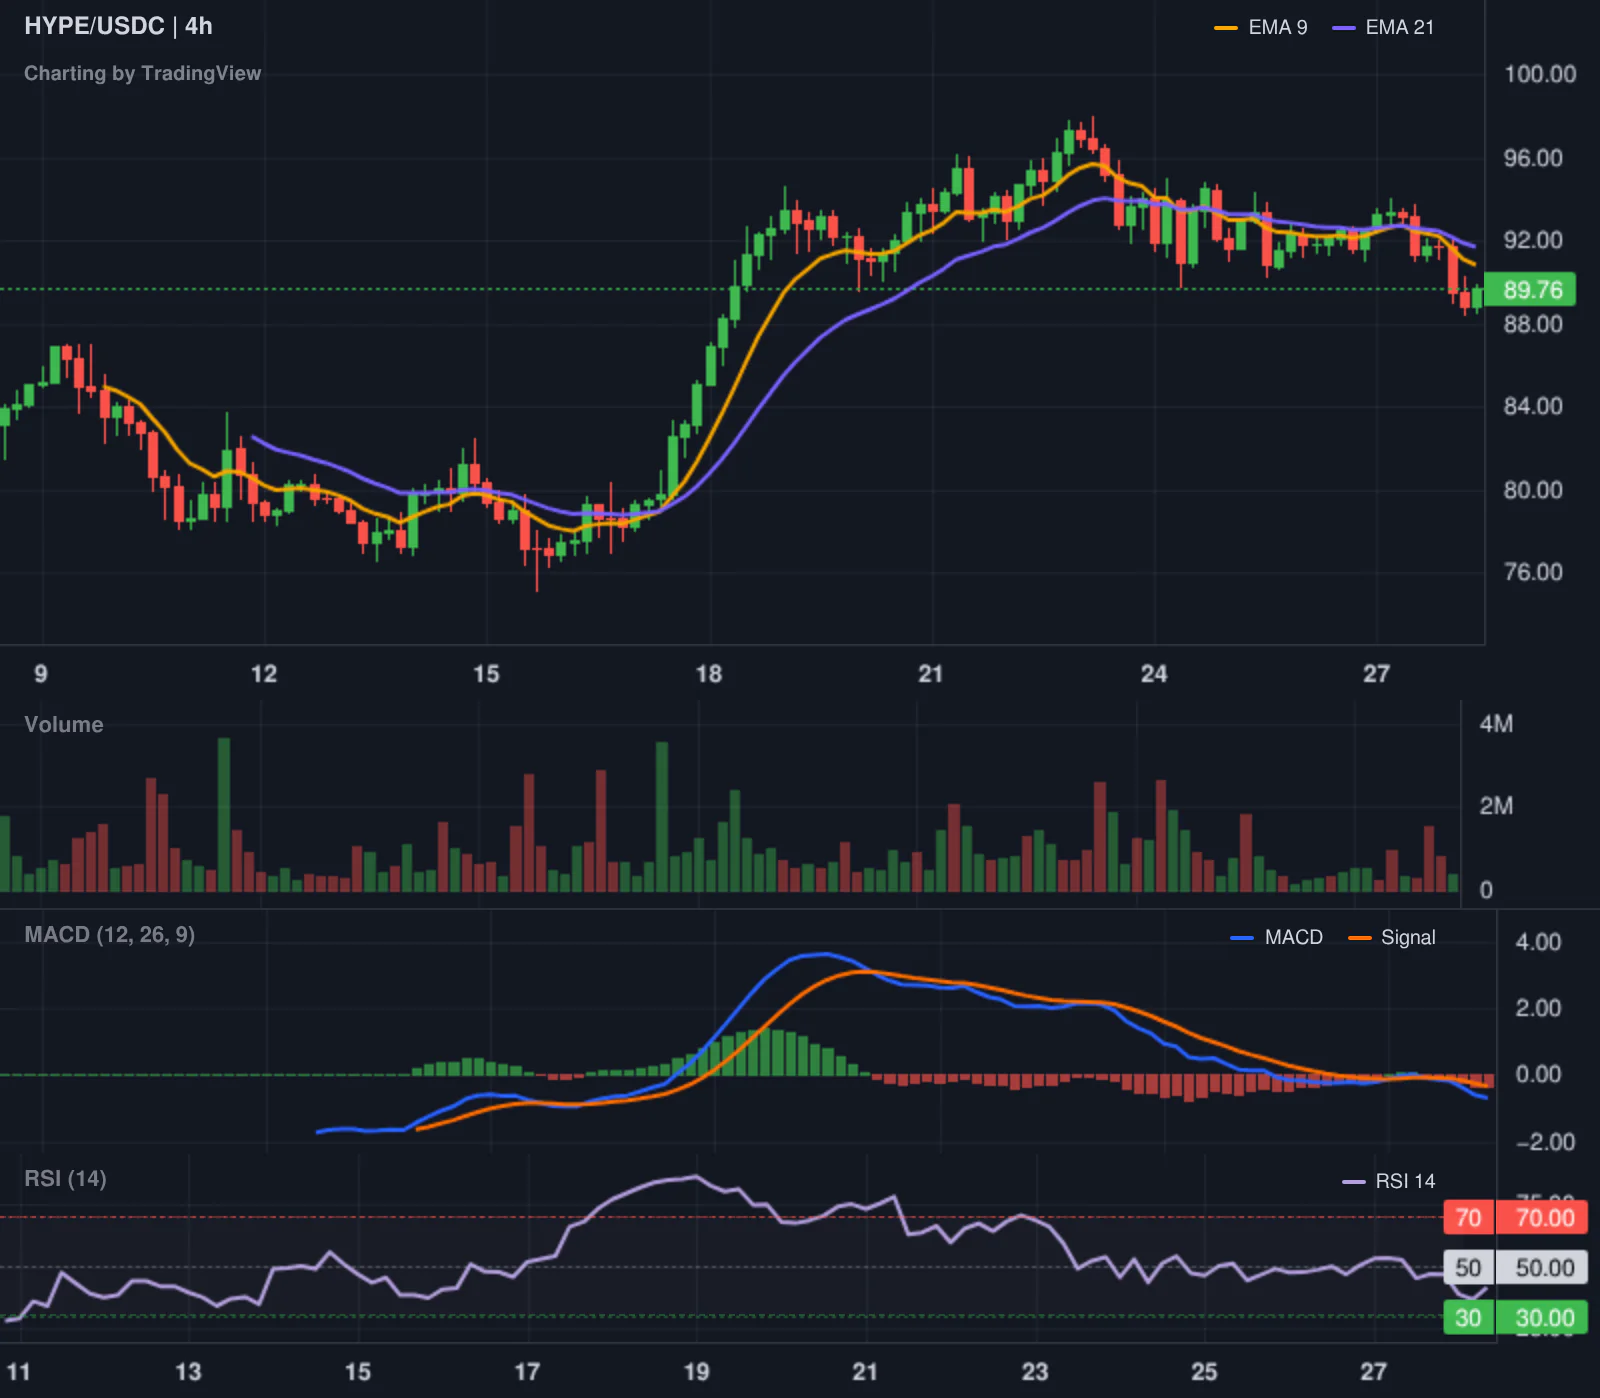
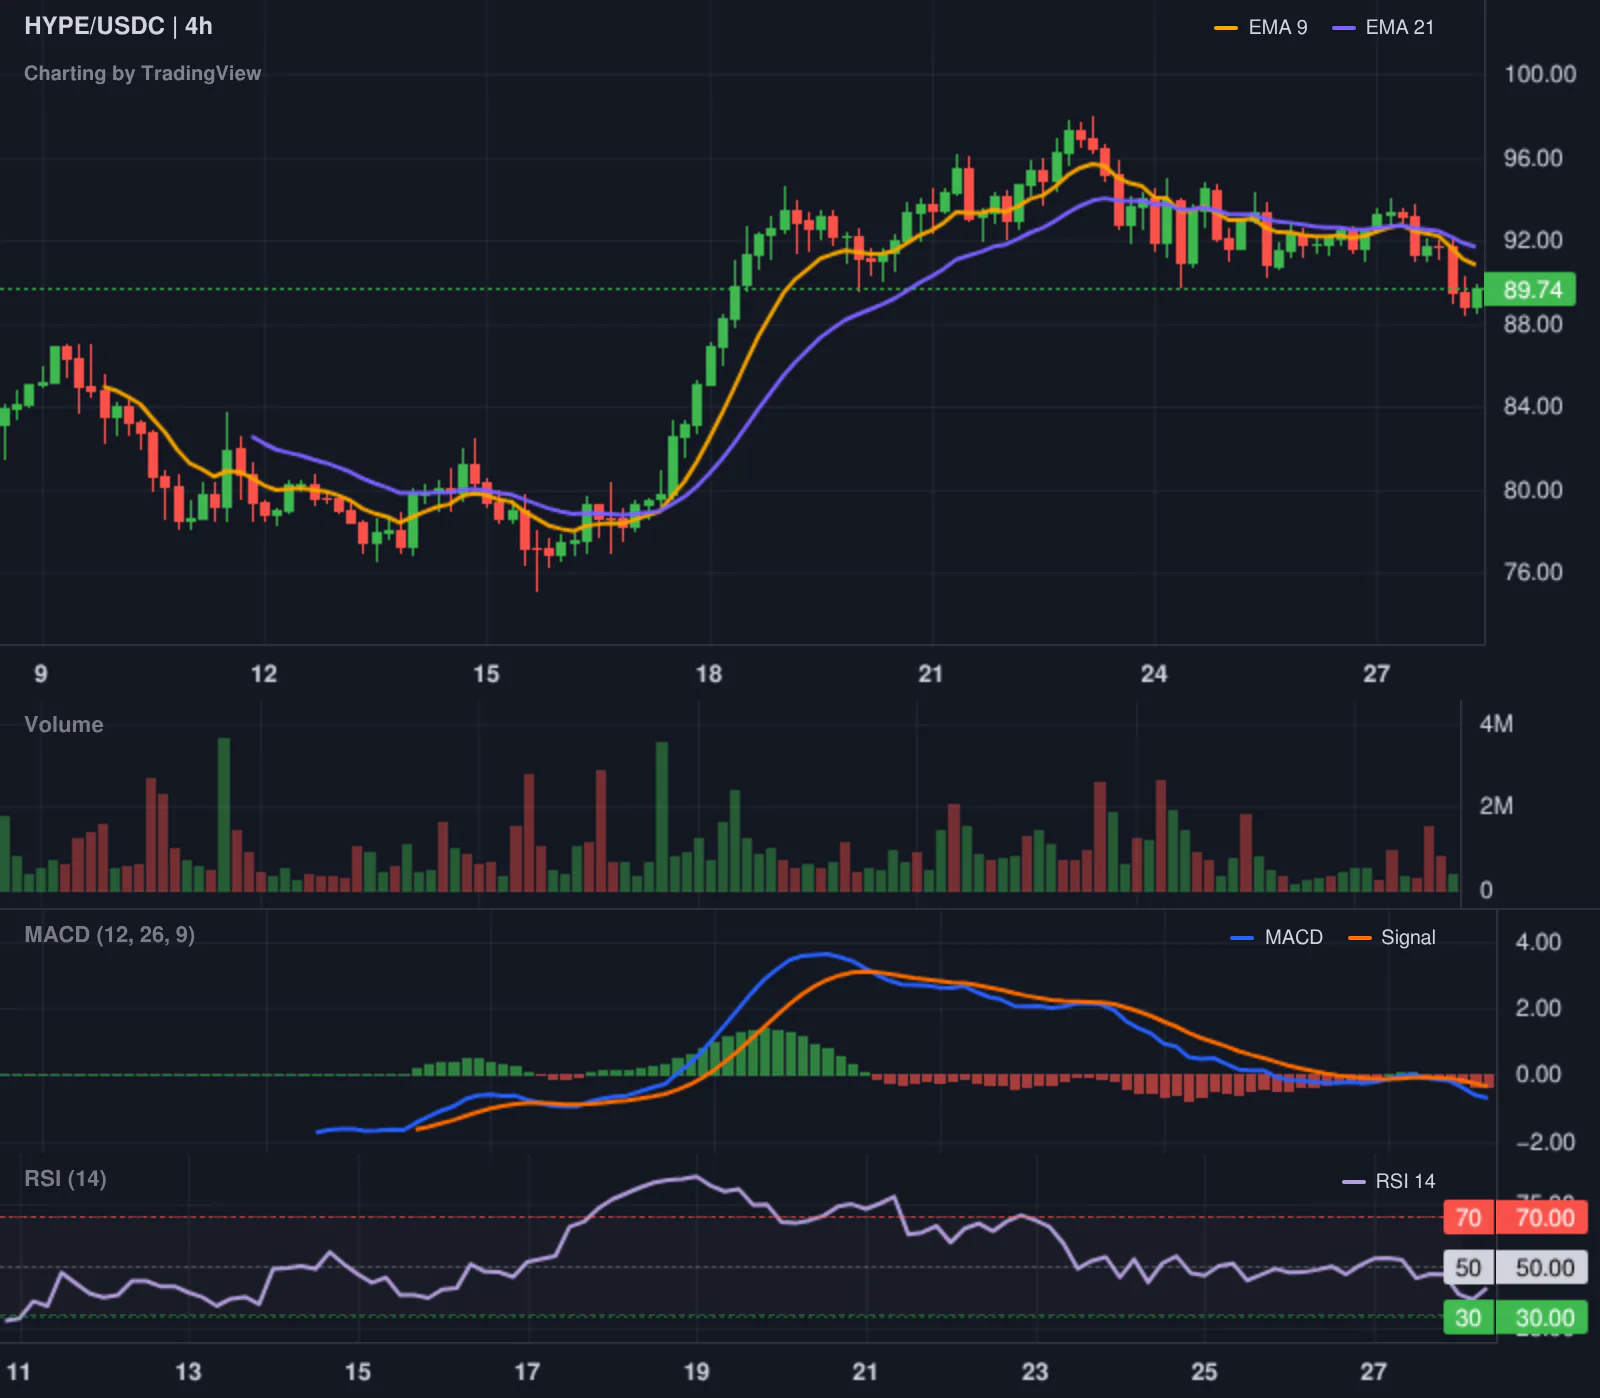
Hyperliquid (HYPE) is at $54.73, down 9.23%.

News driving today's market

The primary narrative today is the escalating war between the CME Group and the CFTC. The CME is suing its own regulator over the decision to allow blockchain-based perpetual futures on platforms like Coinbase and Kalshi. It is a rare and somewhat comical sight to see the largest derivatives exchange in the U.S. fighting the government to protect its monopoly on futures contracts. This conflict highlights the growing tension as "perps" move from the fringes of DeFi into the regulated Wall Street fold.

The institutional appetite for these products is evident, with Bank of America estimating annual perpetual futures volume at $90 trillion. This suggests that while the regulators and exchanges are fighting in court, the actual capital is moving toward these instruments. We have previously noted how volume data suggests fight in the broader market, and this derivatives war is the latest example of that friction.

In other news, the Hong Kong Monetary Authority is pushing a quantum-preparedness index to protect tokenized deposits from future computing threats. This is a long-term institutional play that suggests Hong Kong is building for a decade, not a quarter. Meanwhile, prediction markets have scored a partial win as a judge blocked a ban on these markets in Minnesota. This provides some regulatory breathing room for platforms like Polymarket. Given the current climate of fear, we believe that rising stablecoin dominance in crypto is the only real hedge for retail traders while these legal battles play out.

Social intelligence

The social mood is heavily weighed down by geopolitical escalation. Reports from the Kremlin regarding the "special military operation" and accusations of attacks on gas pipelines are creating a risk-off environment. When geopolitical tensions spike, the "digital gold" narrative for Bitcoin often fails to materialize in the short term, as traders simply move to cash.

This is compounded by a global chip selloff. South Korea's Kospi plunged 10% and Japan's Nikkei fell 4% due to concerns over AI spending and China's technological progress. Since the crypto market has become increasingly correlated with AI and tech stocks, this selloff is acting as a drag on prices. The market is effectively pricing in a "tech winter" alongside a geopolitical crisis, which is a poor recipe for a bullish day.

On a more boring but regulatory-positive note, Nexo is utilizing German MiCAR-licensed partners for its EEA custody. This is a standard compliance move, but it shows that the era of "move fast and break things" is being replaced by a slow, bureaucratic slog through European regulations.

Trading ideas worth watching

There is a strong bullish setup for BTCUSDT based on a channel bounce. Bitcoin has retested the lower support floor of an ascending channel near $63,200. The data shows that institutional buy orders stepped in to absorb the selling pressure right at this level. The target for this trade is the horizontal resistance line around $65,800. The risk is a four-hour close below $62,800, which would invalidate the channel and likely trigger another wave of liquidations.

Redrawn BTCUSDT 120 trading idea chart for BTCUSDT Holds Trendline Support, Recovery Toward $65K in FocusRedrawn BTCUSDT 240 trading idea chart for BTC/USDT: THE $65,800 CHANNEL BOUNCE!

Another perspective on BTCUSDT focuses on the $63,000 buyer zone. As long as the price holds this area and the rising trendline, a recovery toward $65,000 remains the likely scenario. However, a breakdown below $63,000 would weaken the bullish case and suggest that the current "fear" is justified.

For those looking at altcoins, ENA has been stuck in a wide consolidation range between $0.07 and $0.14 for six months. The neutral read here is to wait for the asset to establish itself above the midpoint of $0.095. Until that happens, the asset is simply drifting, and there is little reason to rush into a trade that has shown no direction for half a year.

Smart Money Signals — Hyperliquid Leaderboard
Hyperliquid SHORT HYPE leaderboard chart

Our tracker has flagged a significant move from @TudorCross, who boasts a 6136% 30-day ROI. This trader has opened a short position in HYPE at an entry price of $58.17, with a notional value of over $40,000. Given the trader's track record, this short aligns with the broader market weakness and the specific decline in Hyperliquid's price today.

Altcoin Spotlight

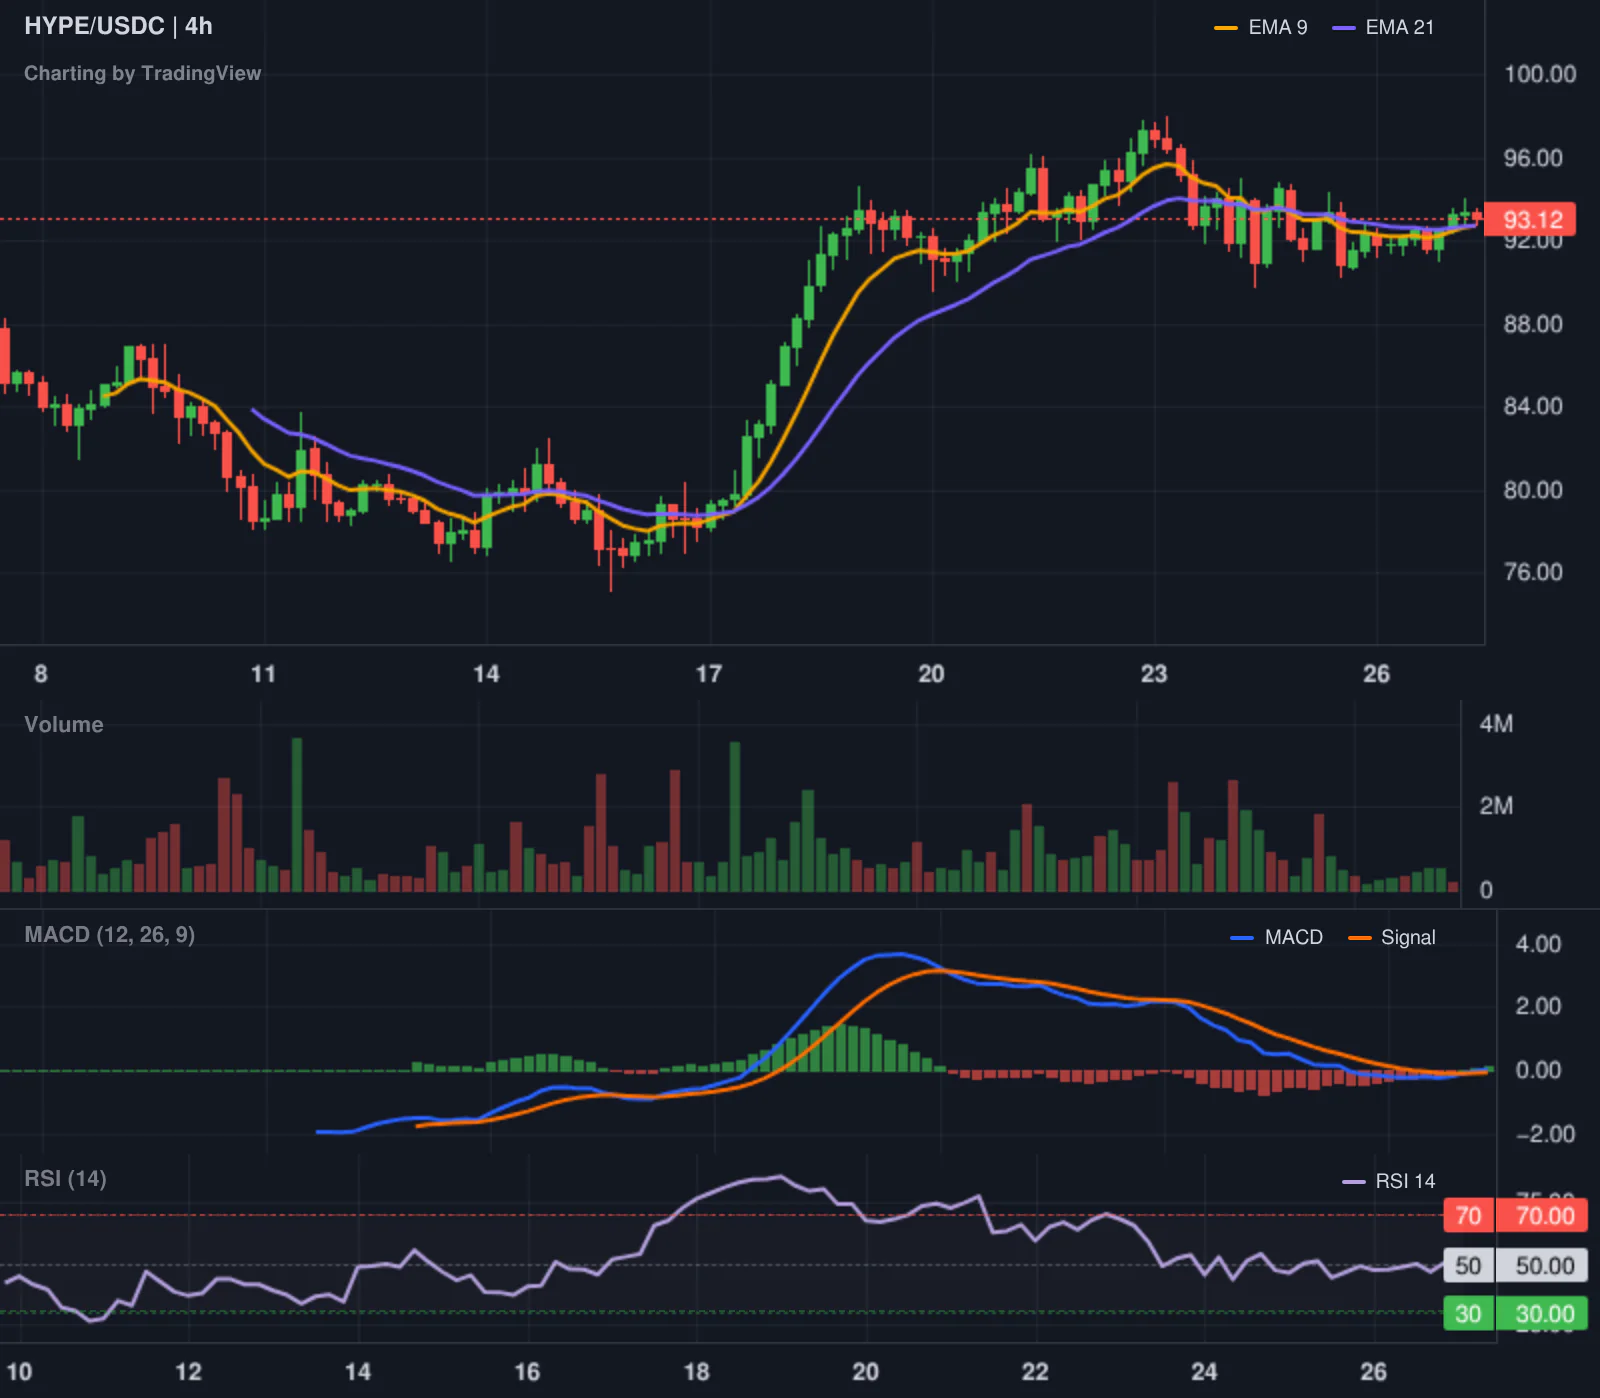
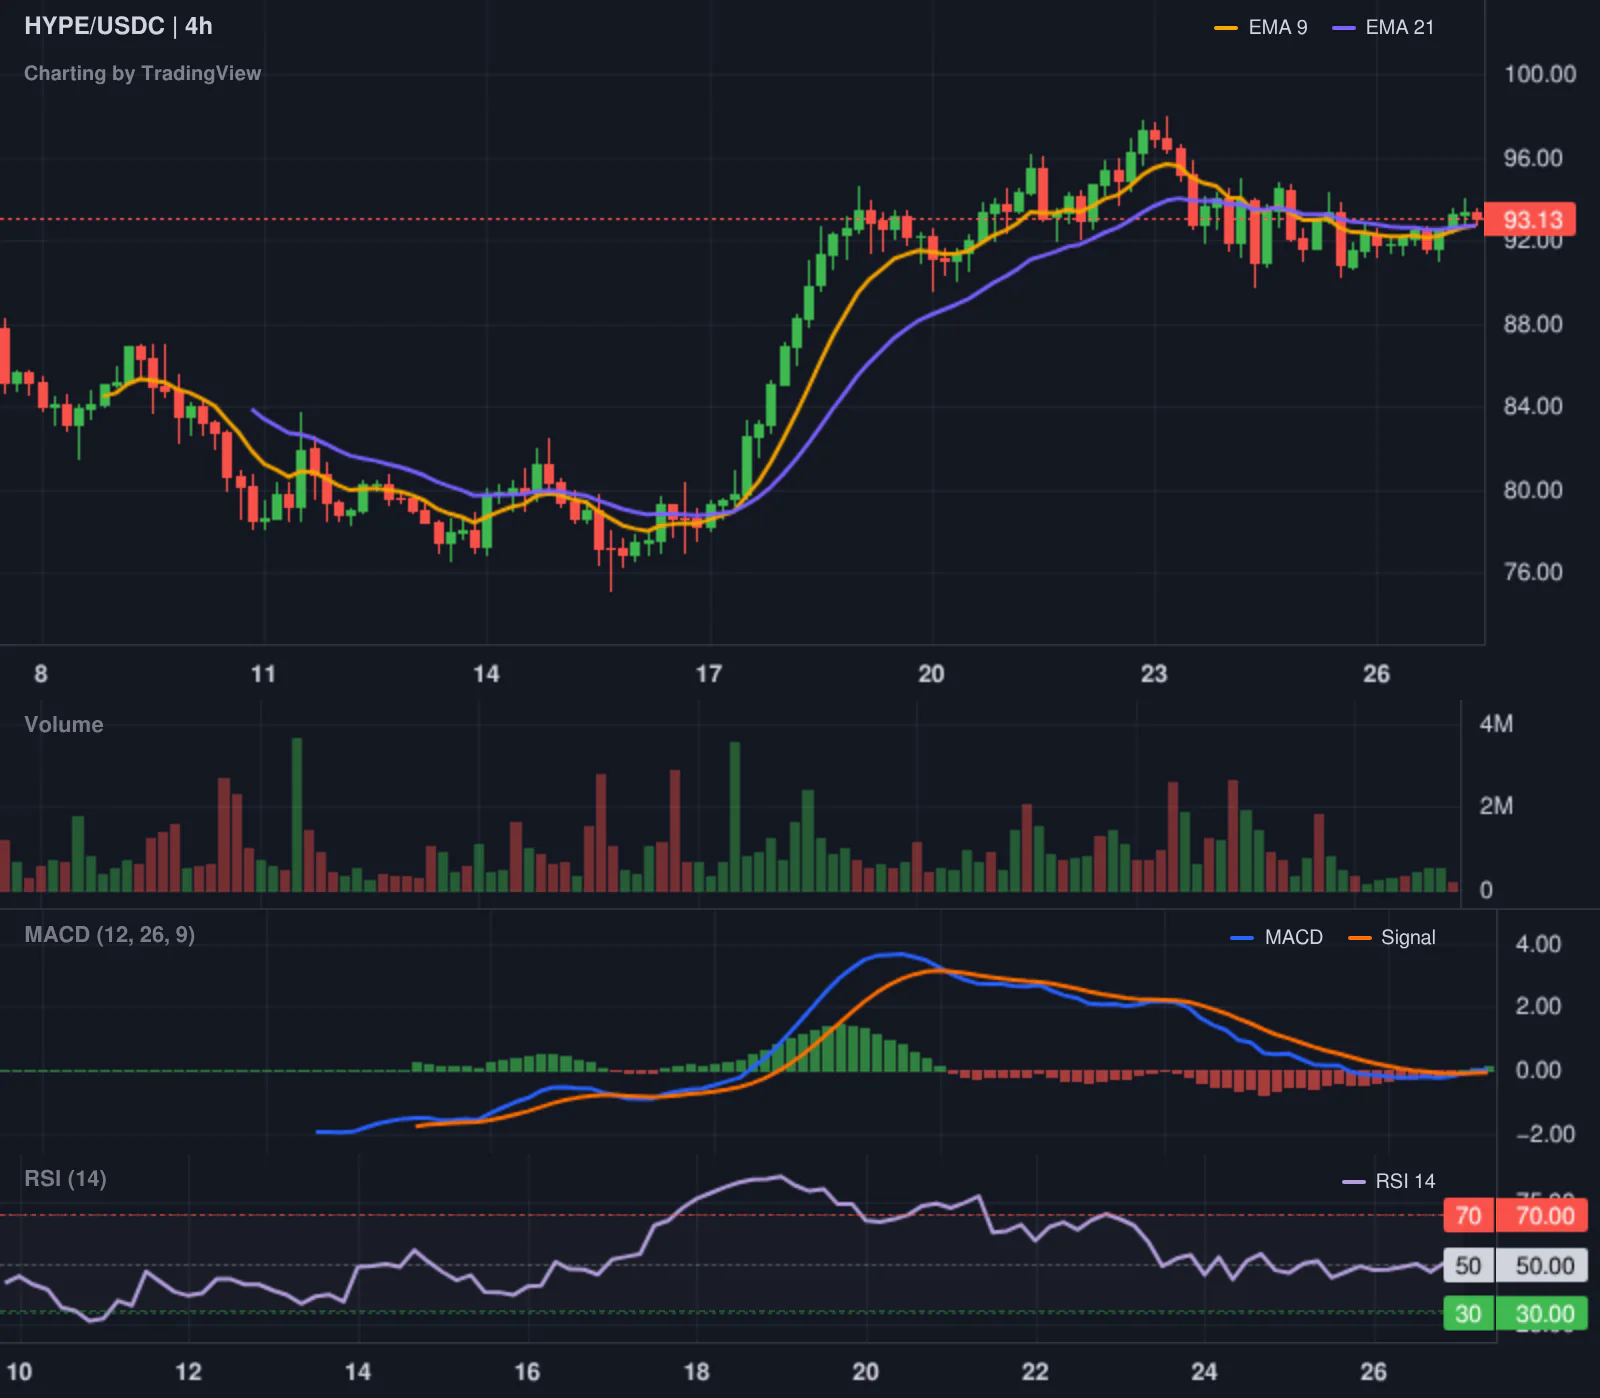
Hyperliquid (HYPE) is the standout loser of the day, crashing 9.23% to $54.73. This move is particularly interesting because the asset is being targeted by top-tier leaderboard traders. The volatility in HYPE is a microcosm of the wider market: high leverage and rapid price swings. When a top trader shorts an asset that is already sliding, it often suggests that the "bottom" is further away than the bulls think.

What to watch next

The immediate focus is the $63,000 level for Bitcoin. If this support holds, we can expect a relief rally toward $65,800 as the leveraged shorts get squeezed. If it fails, the market could see a deeper correction as the Fear and Greed Index slides further toward "Extreme Fear."

On the macro front, keep an eye on the U.S. chip stocks. If the selloff in Nvidia and Micron continues, the crypto market will likely follow suit regardless of any bullish technical setups. Finally, the federal court's decision on the CME versus CFTC lawsuit will be a major indicator of how regulated derivatives will actually function in the U.S. For now, the market is in a state of fragile equilibrium, waiting for either a geopolitical truce or a technical breakout.