
Crypto Market Overview | extreme fear amid massive derivatives volume divergence from spot activity | June 26, 2026
Crypto Market Overview | extreme fear amid massive derivatives volume divergence from spot activity | June 26, 2026
Market overview
The market is currently operating in a state of profound contradiction. The Fear and Greed Index has plummeted to 15, a level of extreme fear that usually suggests the end of the world is imminent. Yet, while the spot market remains cautious, the derivatives market is practically screaming. Total derivatives volume has hit $1.08 trillion, which is roughly ten times the spot volume of $105.88 billion. This gap suggests that the current price action is not being driven by people buying and holding assets, but by traders betting on the volatility of the panic.
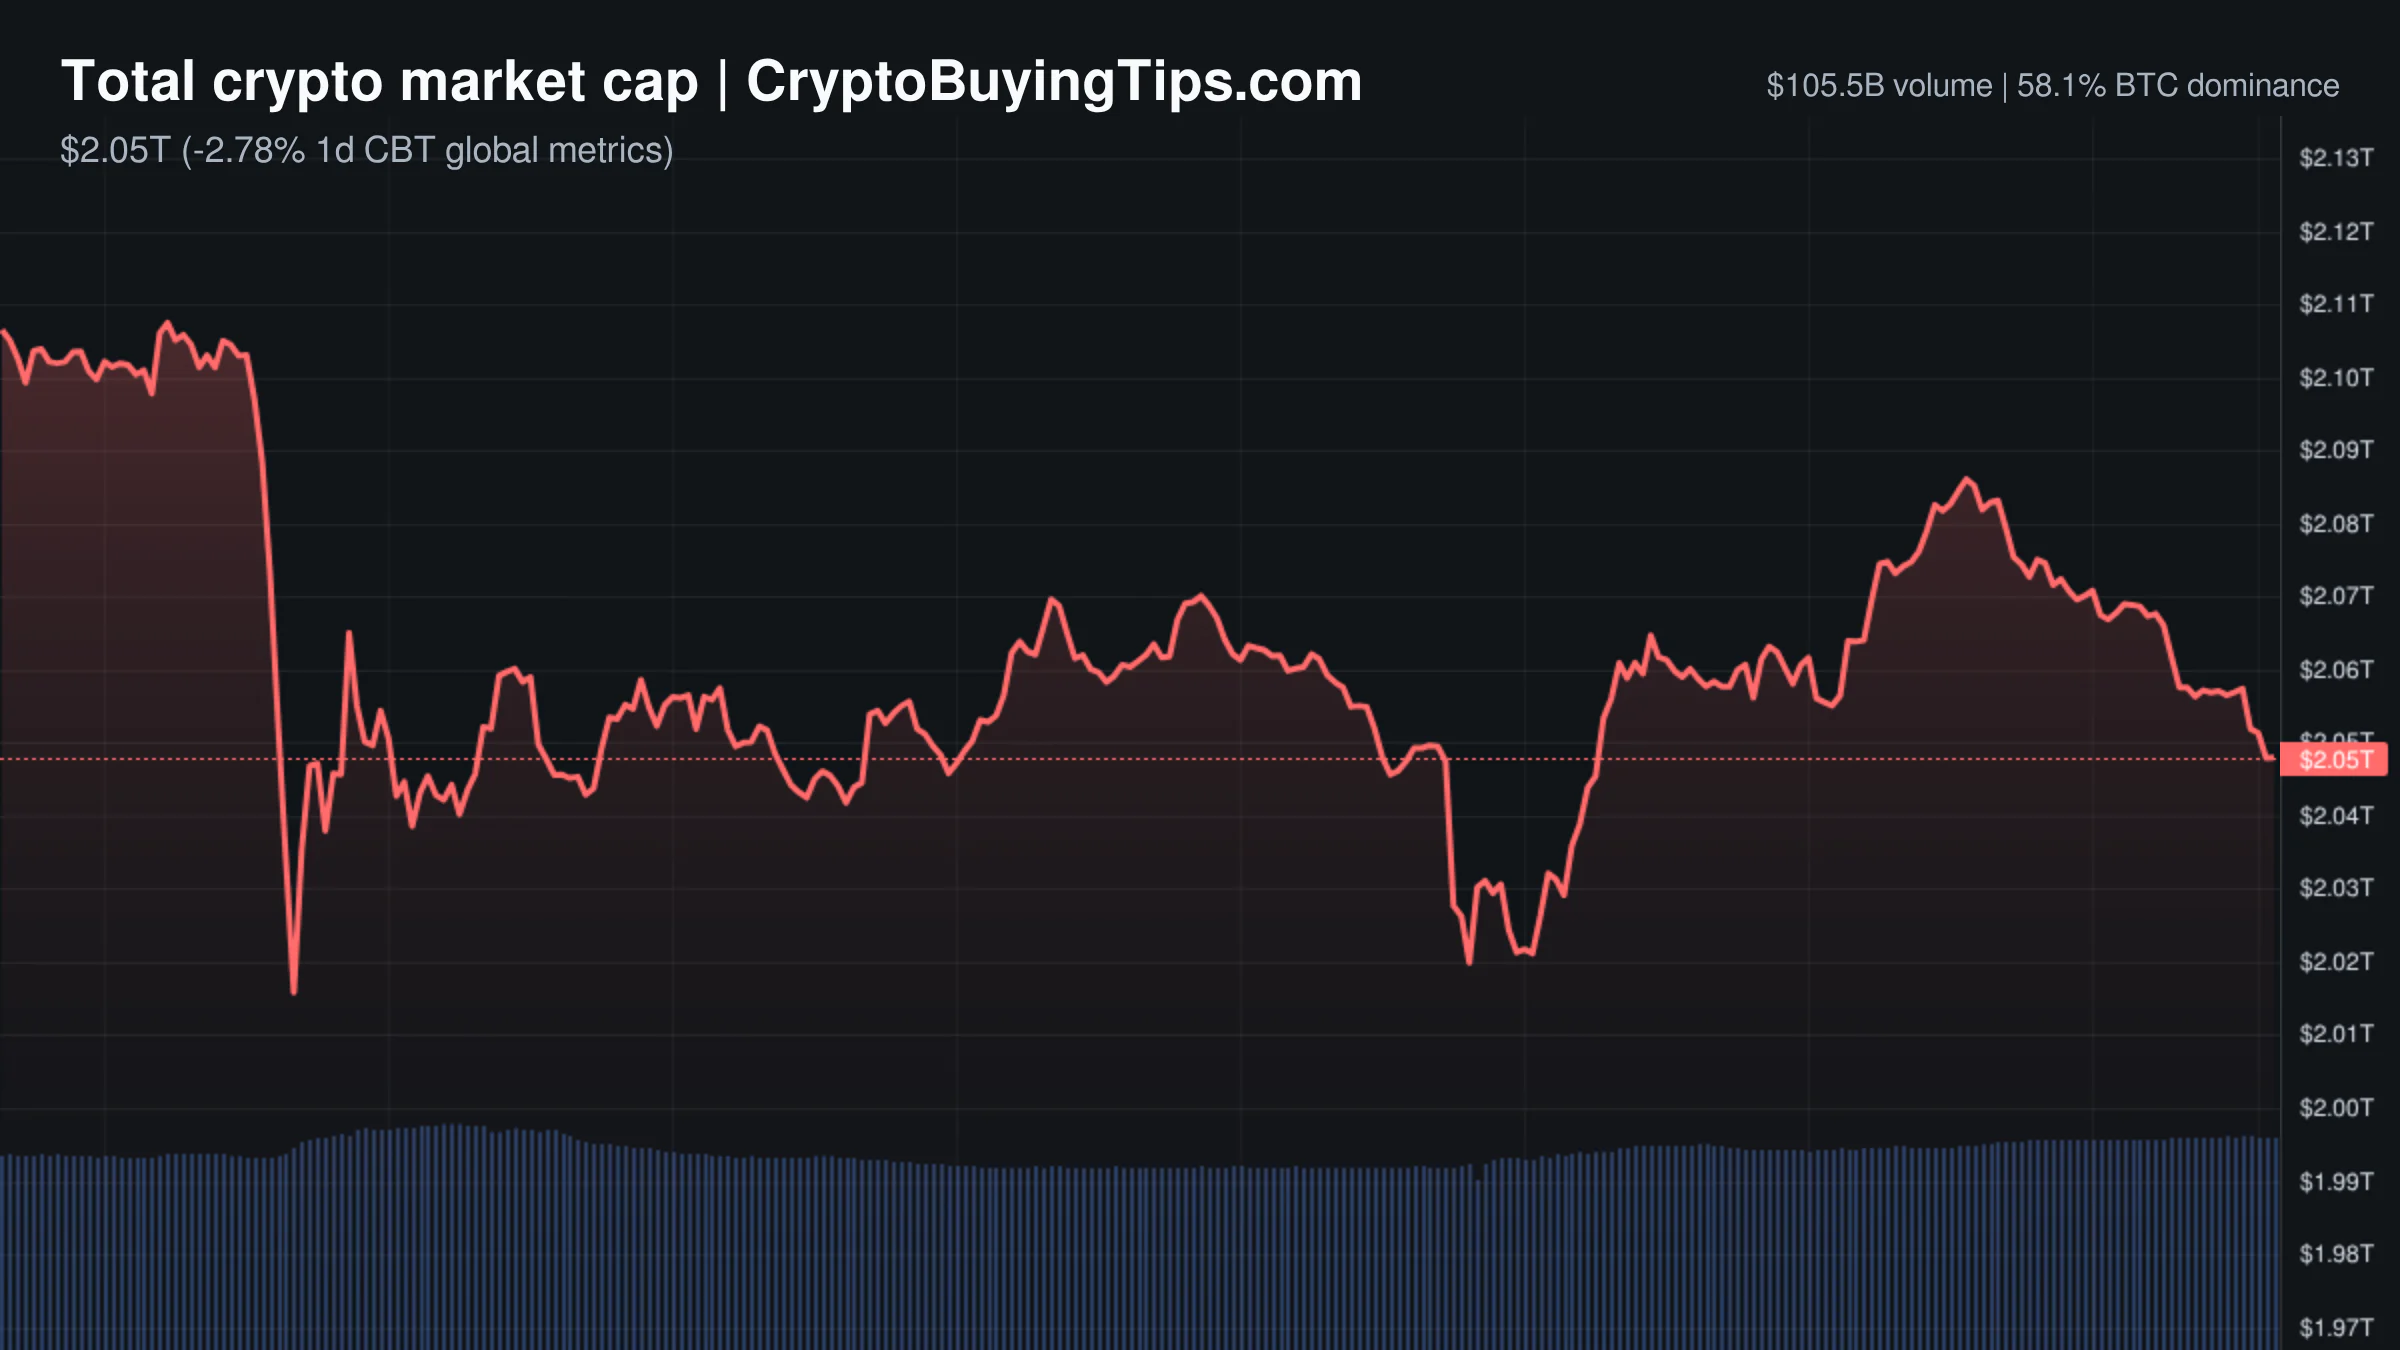
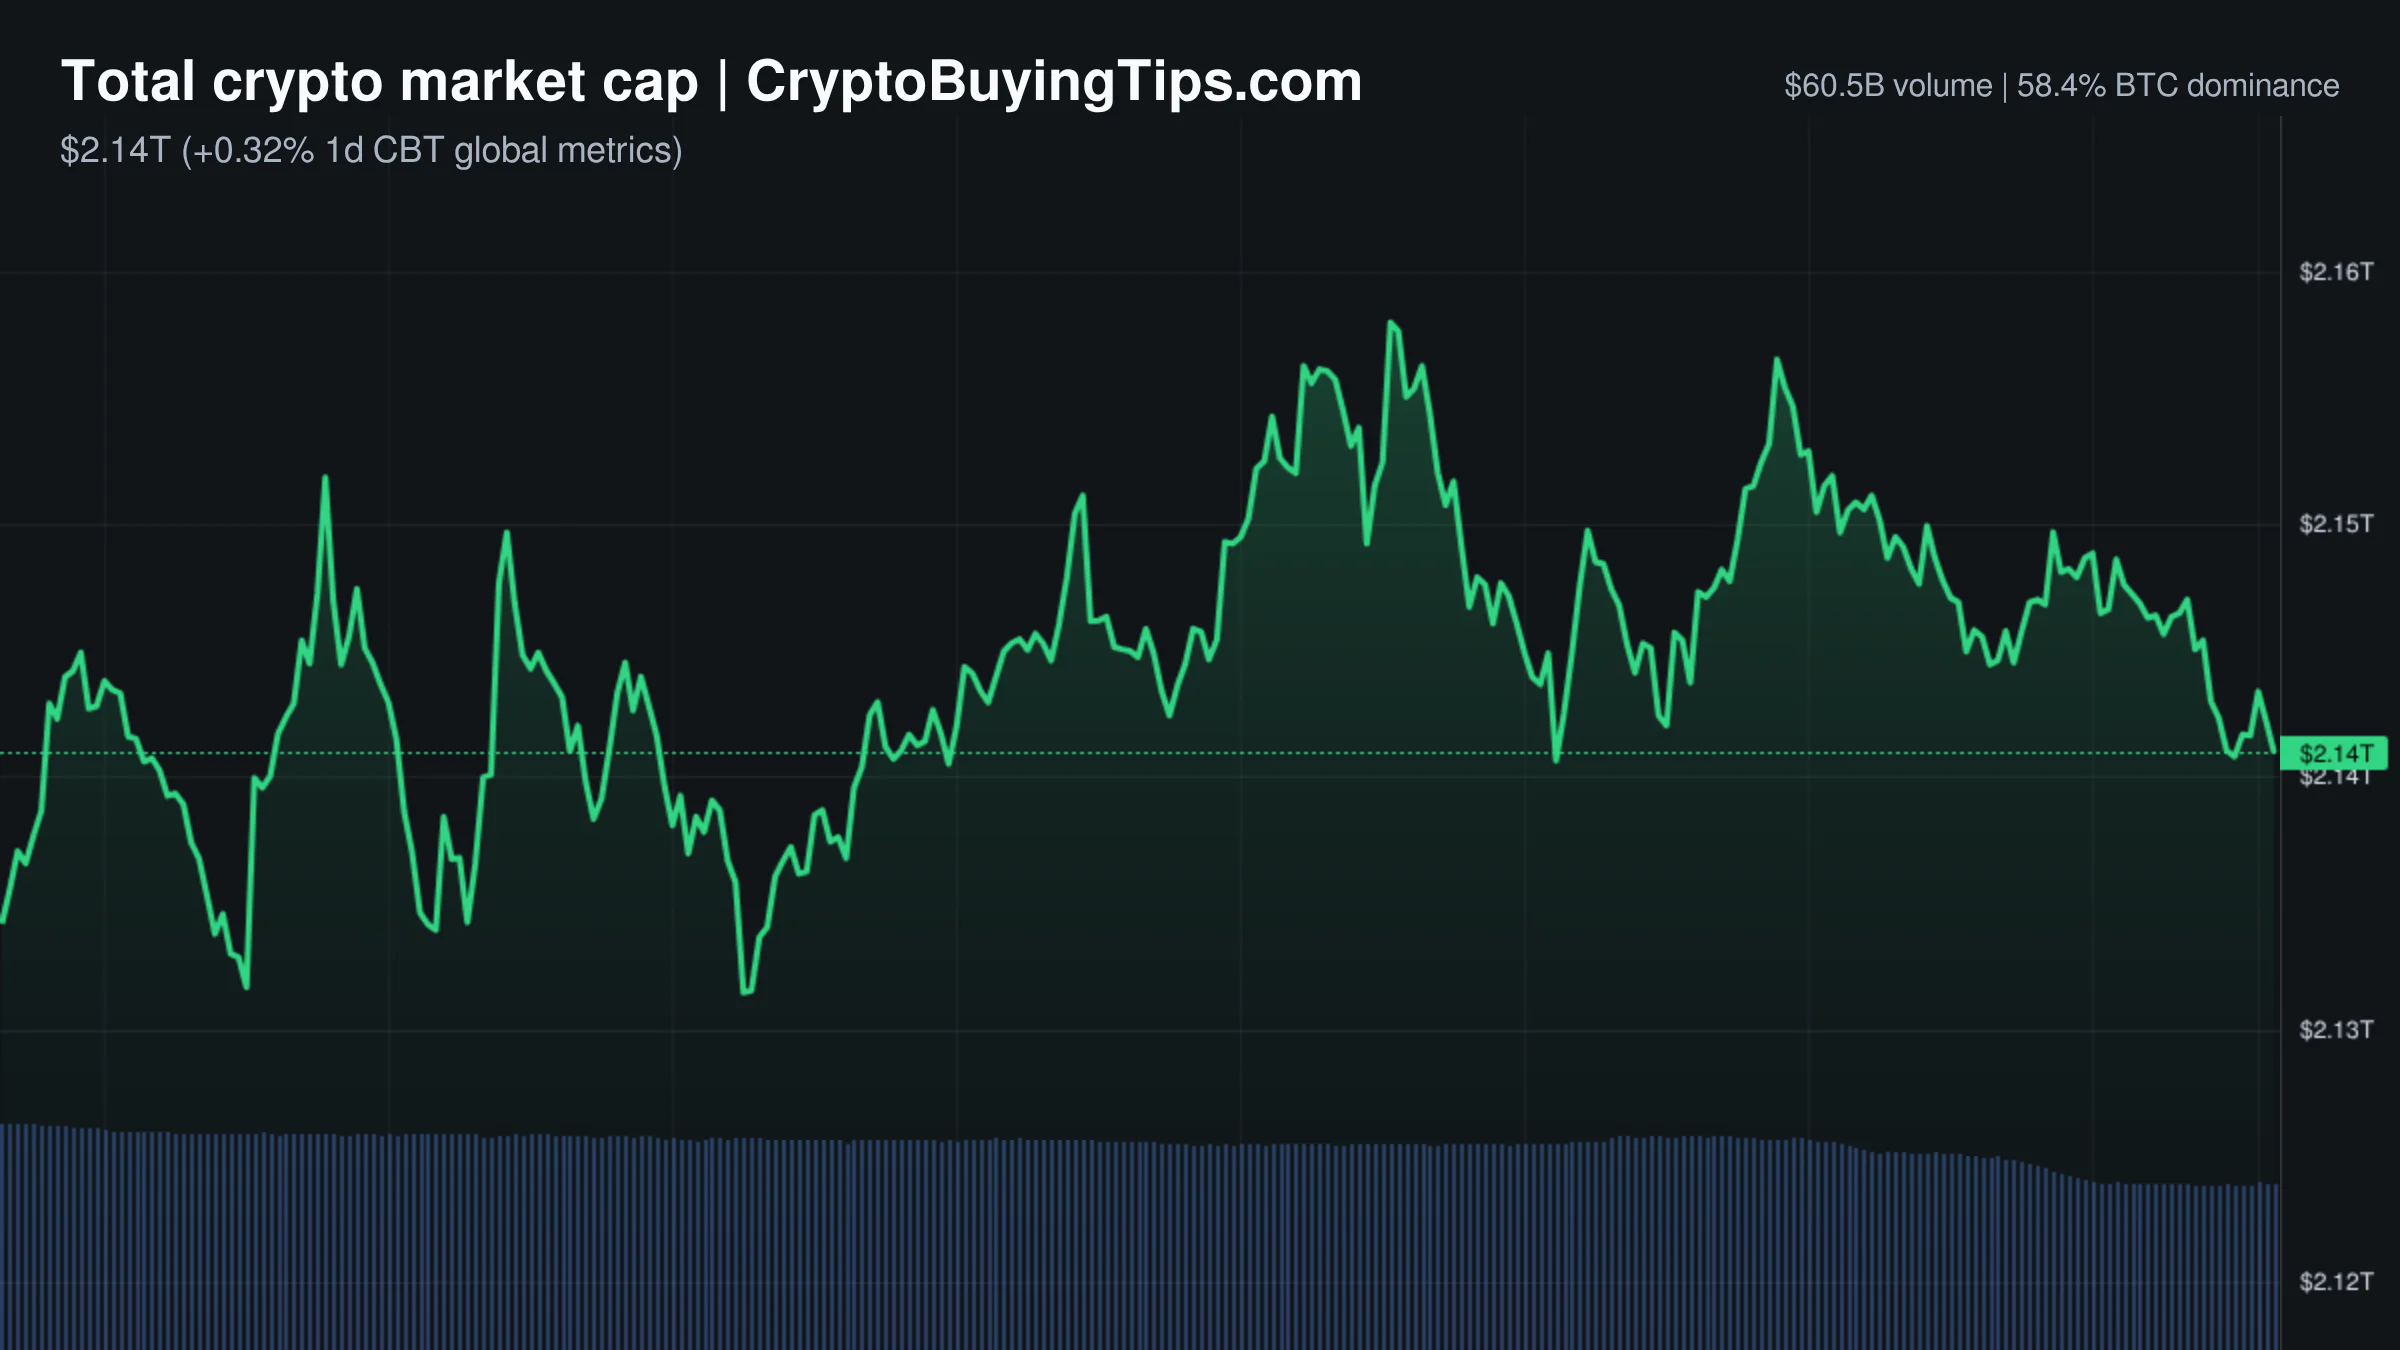
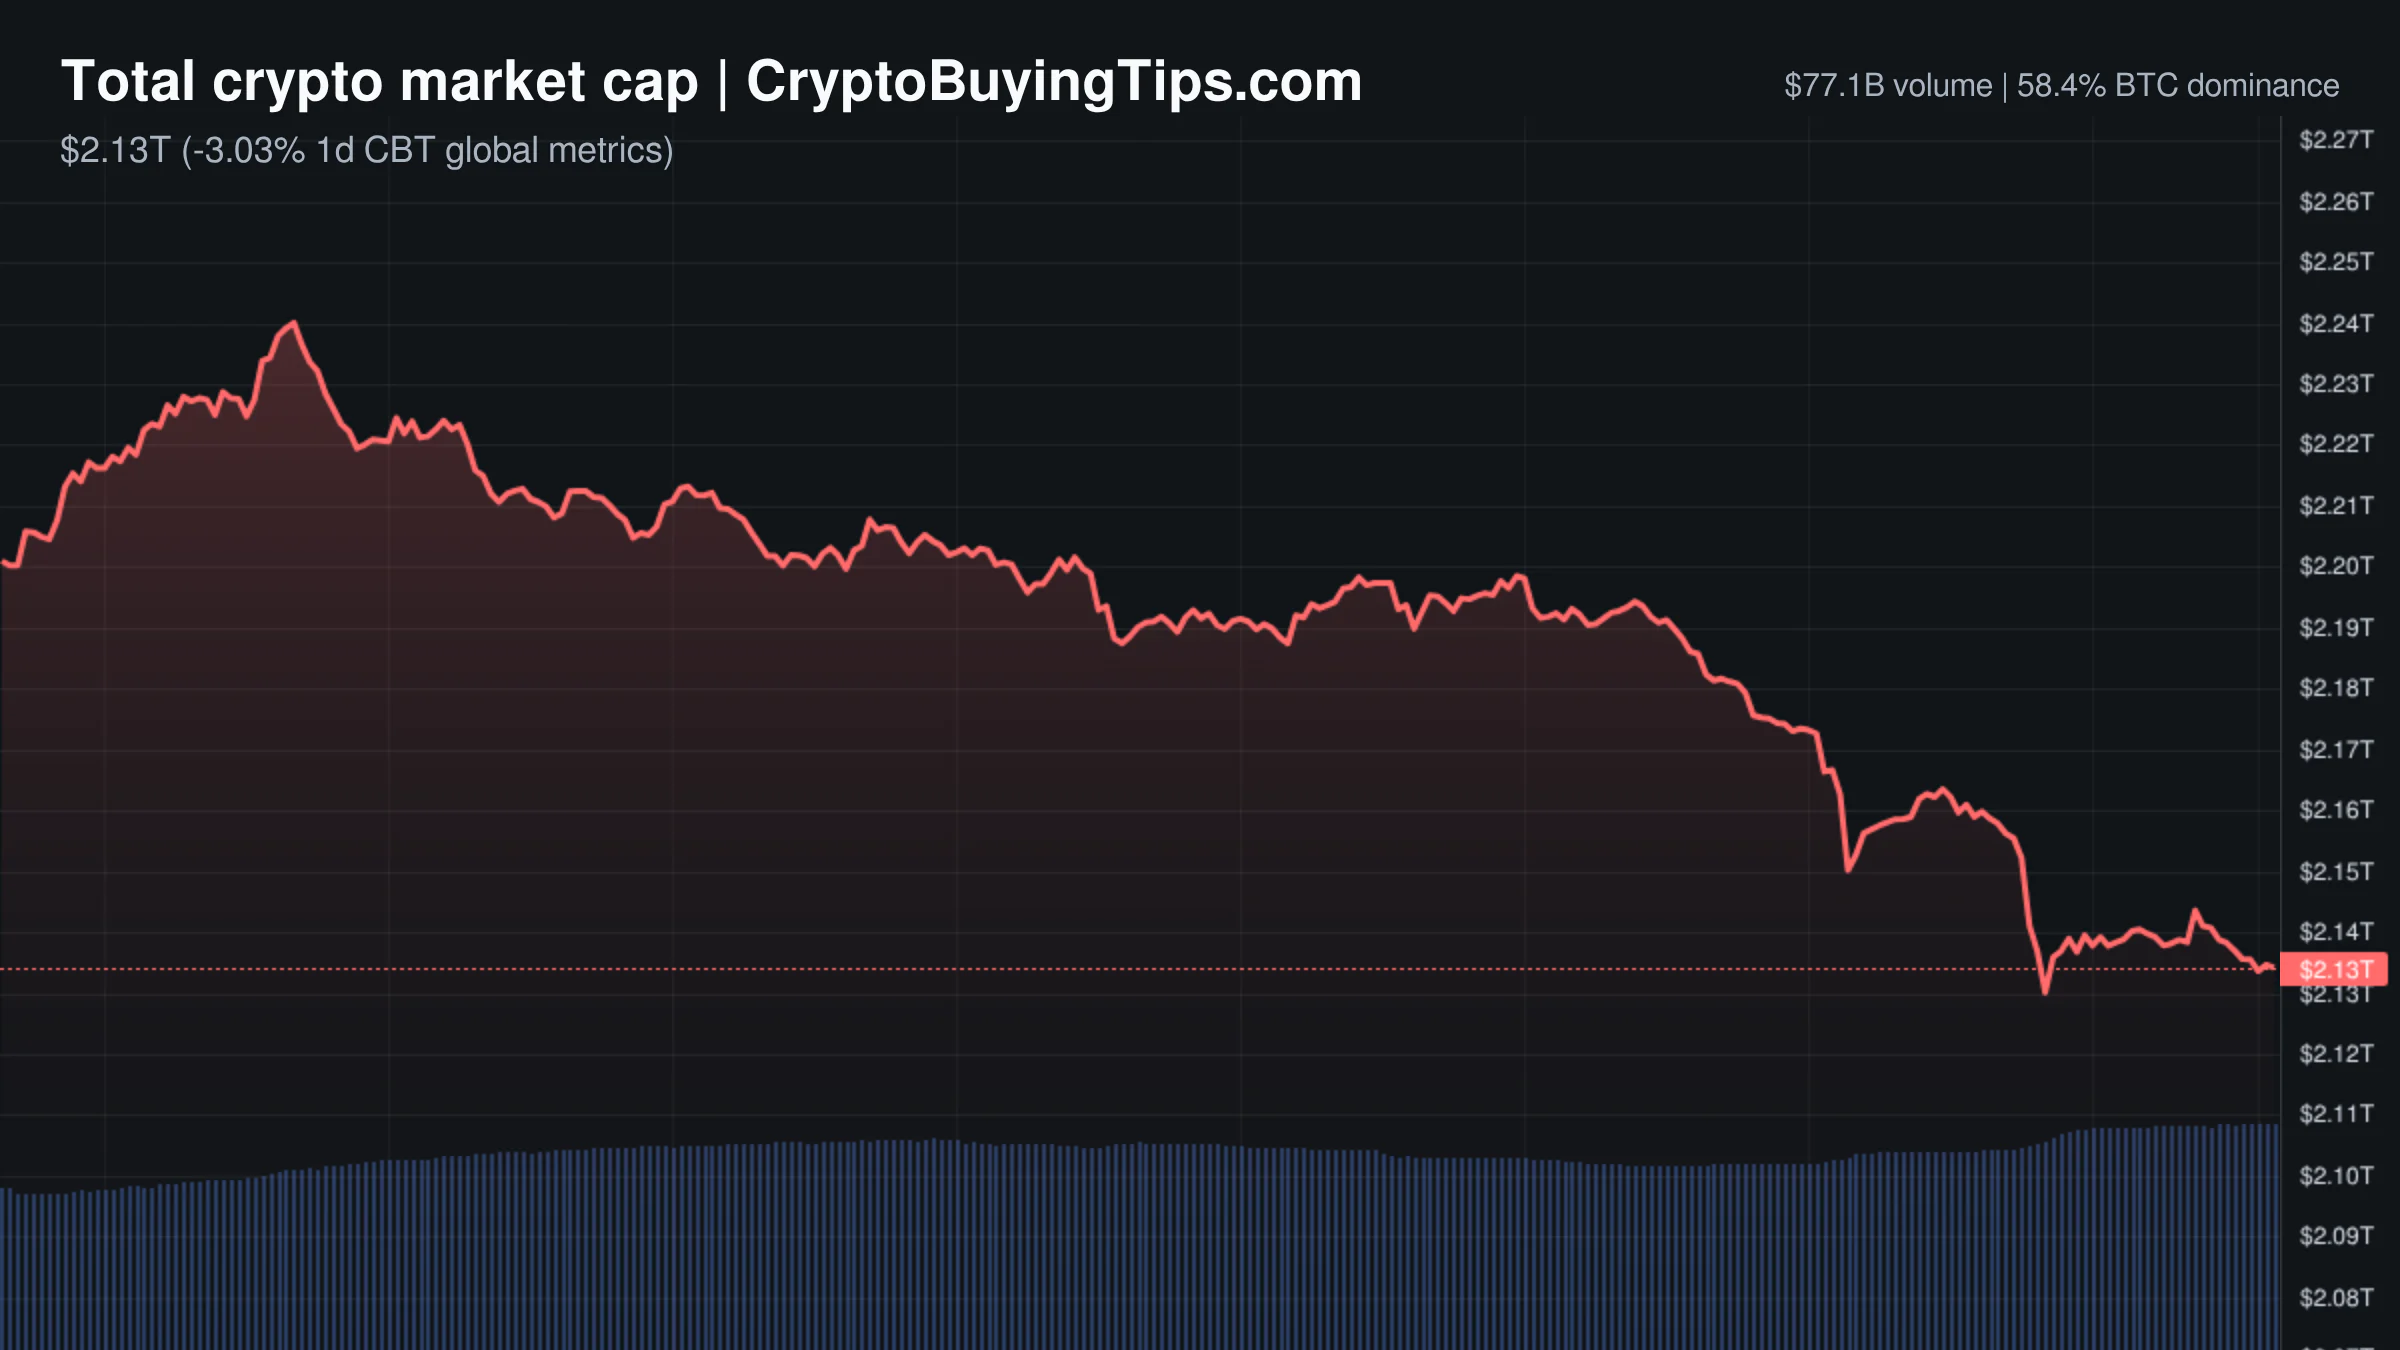
Total market capitalization has slipped to $2.14 trillion, a decline of 2.64% over the last 24 hours. This downward trend is reflected in the CMC20 and CMC100 indices, which have dropped 3.08% and 3.20% respectively. The most telling metric is the rising stablecoin volume, which climbed 7.05% to $108.45 billion. Capital is moving into the sidelines. Traders are not necessarily exiting the ecosystem, but they are retreating into the safety of USDT and USDC while they wait for the dust to settle.
Bitcoin dominance remains high at 58.07%, though it has dipped slightly. The Altcoin Season Index sits at 45, which is firmly neutral. This means money is not rotating into alts in any meaningful way. Instead, the market is in a holding pattern where the only real activity is happening in the high-leverage pits of the perpetuals markets.
Bitcoin and Ethereum
Bitcoin is struggling to find a floor as it correlates heavily with a bearish outlook for the S&P 500 and a rising DXY index. When the dollar strengthens and equity markets look shaky, risk assets like Bitcoin usually take the hit. The current price action suggests a struggle to maintain key psychological levels. If the market loses the heavy support zones between $56,600 and $48,000, the corrective phase could extend much further than most bulls are comfortable with.
Ethereum is in a different kind of trouble. On-chain activity has essentially vanished. Gas fees are at 0.15 Gwei for slow transactions and 0.16 Gwei for fast ones. This is a ghost town. Low gas fees are usually a win for users, but in this context, they signal a lack of demand for network space. It means the "world computer" is currently idling.
There is some institutional movement, however. On-chain data from @lookonchain shows that SharpLink has resumed buying ETH after an eight-month hiatus, recently receiving 5,000 ETH from FalconX. This is a bold move considering SharpLink now holds over 876,000 ETH and is sitting on an unrealized loss of $1.71 billion. It is the kind of aggressive averaging down that either leads to a legendary recovery or a very expensive lesson in humility.
Top crypto prices
Specific front-page price data for the top coins is unavailable today. However, the broader indices show a synchronized decline. The CMC20 and CMC100 indices are both down over 3%, indicating that the sell-off is not limited to a few outliers but is a general retreat across the top 100 assets.
News driving today's market
The dominant narrative is a clash between regulatory friction and institutional adoption. The most immediate pressure comes from the European Union. Binance has notified users that it will restrict key services starting July 1 because it failed to secure MiCA authorization. This is a significant blow. It signals that the era of "move fast and break things" for centralized exchanges in Europe is over. The move forces users toward self-custody or MiCA-licensed competitors like OKX and Revolut. This regulatory squeeze creates immediate operational risk and uncertainty.
On the other side of the ledger, the structural plumbing of the industry is improving. The GENIUS Act has provided a federal regulatory framework for dollar-backed stablecoins in the U.S. This is a massive development for institutional confidence. We are also seeing traditional finance giants plant flags in the sector. Invesco is filing for a tokenized fund targeting the stablecoin reserve market, and SBI is acquiring Bitbank in a $289 million deal to create Japan's largest crypto exchange.
These moves suggest that while the retail-facing exchanges are hitting walls, the back-end infrastructure is being absorbed by the biggest players in global finance. We previously covered how volume data suggests fight when institutional analysts claim the winter is over. The current data supports that view; the "winter" might be over for the banks, but the retail traders are still shivering. We also noted that the Bank of Japan raised rates, which continues to tighten the global liquidity that fuels these risk-on rallies.
Social intelligence
The social sentiment is a mix of macro anxiety and protocol failure. OpenAI is reportedly delaying its IPO until 2027, aiming for a $1 trillion valuation. While this is an AI story, it matters for crypto because it signals a shift in how the biggest "risk" companies in the world are timing their liquidity events. If the AI bubble is adjusting its timeline, crypto liquidity often follows.
Meanwhile, the prediction market sector took a hit. Polymarket suffered a breach via a third-party provider, resulting in the theft of $3 million in user assets. The stolen funds were primarily pUSD and were quickly swapped for ETH. This is the second security incident for the platform in two months. It is a reminder that "decentralized" often just means "trusting a different set of people who might have a leaky API."
Trading ideas worth watching
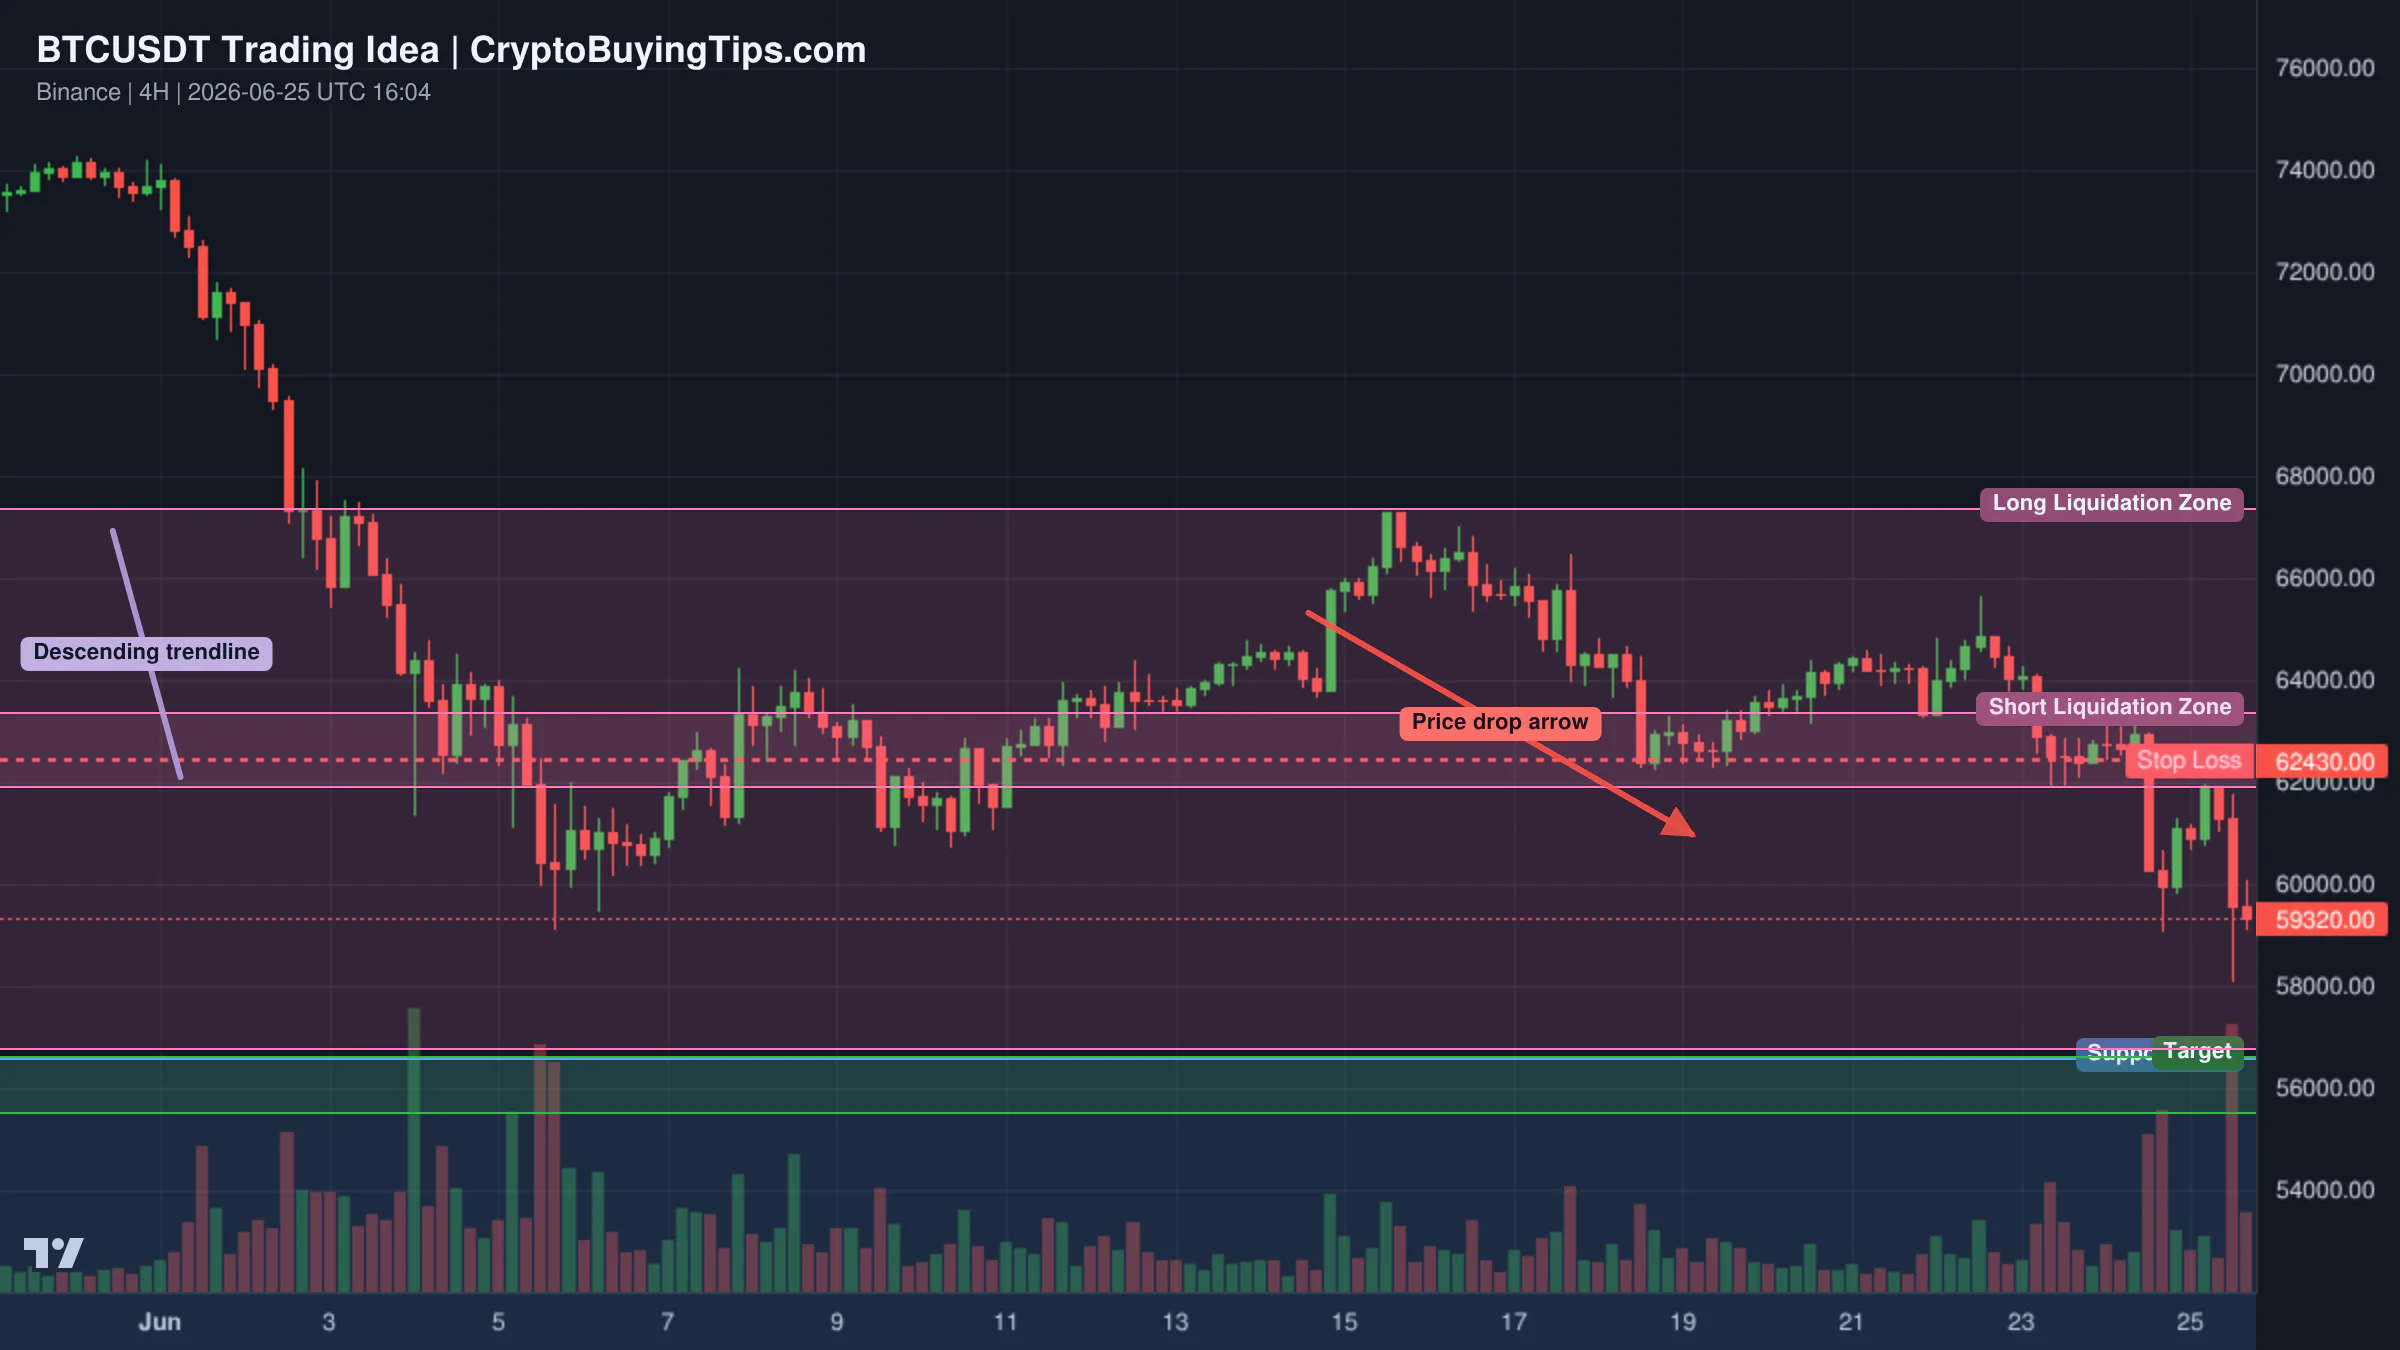
The focus for BTCUSDT is currently on a few critical zones. One analysis suggests that Bitcoin is approaching a heavy support zone between $56,600 and $48,000. The setup identifies a Potential Reversal Zone between $56,640 and $55,500. If the price hits this area and holds, it could trigger a bullish move. However, the risk is high. If the price slices through this zone, it could fill the CME Gap between $54,545 and $52,980. The stop loss for this view is set at $62,430.
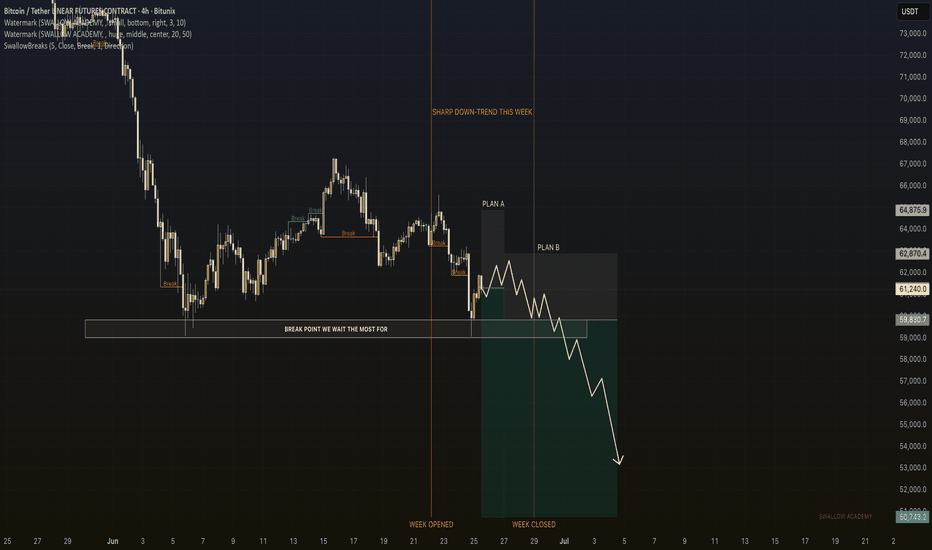
A more bearish perspective focuses on the $59,830 level. This is viewed as the key floor holding the current structure together. A clean break below $59,830 would likely open the door to a sharp continuation down toward $53,000. This would be the "final flush" before a genuine accumulation phase begins. Traders are looking to sell the break of $59,830 or wait for a retest of that level as resistance for a cleaner entry.
From a longer-term perspective, the $52,500 to $60,000 range is being flagged as a primary demand and accumulation zone. For long-term investors, this is an attractive area to build positions. For day traders, however, the volatility is the only thing that matters. The nearest supply zones are at $63,000 and $66,000, with a stronger resistance cluster between $70,000 and $74,000.
What to watch next
The market is currently a tug-of-war between two different versions of the future. One version is the "institutional rail" where Invesco, SBI, and Circle build a compliant, tokenized financial system. The other version is the "regulatory wall" where Binance and other CEXs are forced to shrink or exit jurisdictions like the EU.
In the short term, the $59,830 level for Bitcoin is the line in the sand. If it holds, the extreme fear might be a buying opportunity. If it breaks, the path to $53,000 is wide open. We will be watching the stablecoin dominance and derivatives volume. If the derivatives volume continues to dwarf spot activity while price falls, we are looking at a highly unstable environment where a single piece of news can trigger a massive liquidation event.
Some links in this article may be affiliate links. We may earn a commission at no extra cost to you — this never influences our analysis or coverage.
Sigrid Voss
Crypto analyst and writer covering market trends, trading strategies, and blockchain technology.
More Articles
Crypto Market Overview | panic selling amid exploding derivatives volume | June 25, 2026
Panic selling hits as derivatives volume explodes, signaling high volatility despite falling market cap amid crypto…
Crypto Market Overview | low volume divergence amid political noise | June 24, 2026
Crypto market overview shows low volume divergence amid political noise; see how declining trading activity affects BTC…
Crypto Market Overview | bearish price action meets surging derivatives volume amid macro headwinds | June 23, 2026
Bearish price action meets surging derivatives volume amid macro headwinds; see our market overview on crypto's current…

Altcoin season index is at 76 but the market is in fear
High Altcoin Season Index meets deep market fear; it looks less like an upswing and more like desperate short-term…