
Crypto Market Overview | panic selling amid exploding derivatives volume | June 25, 2026
Crypto Market Overview | panic selling amid exploding derivatives volume | June 25, 2026
Market overview
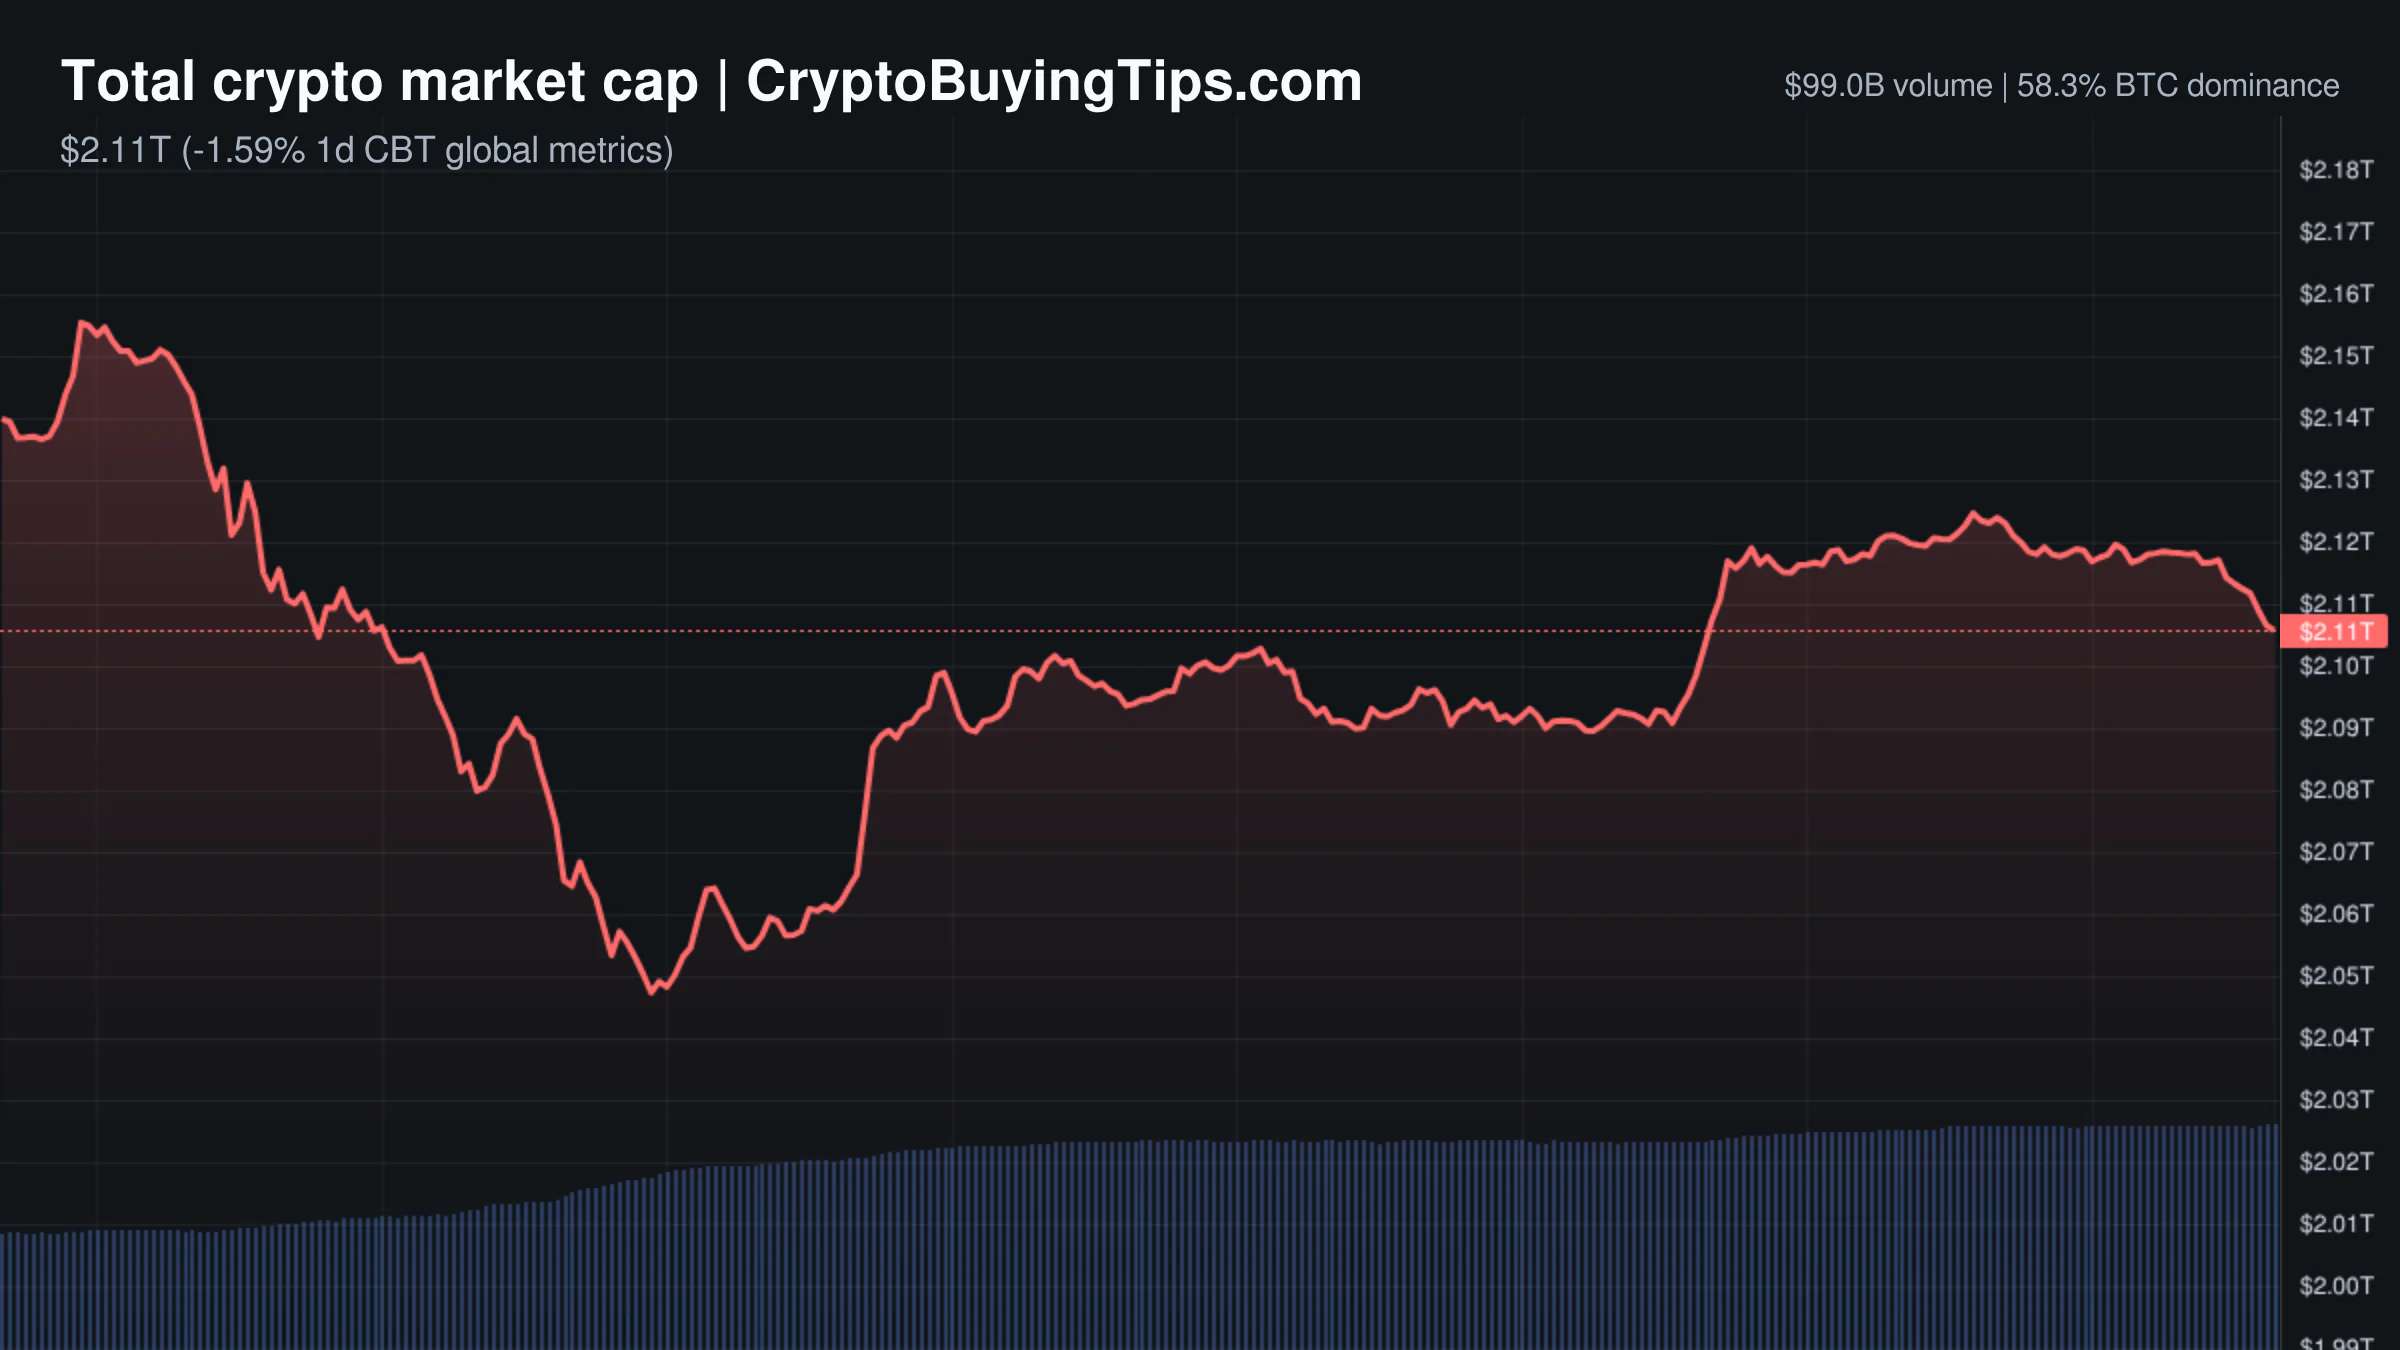
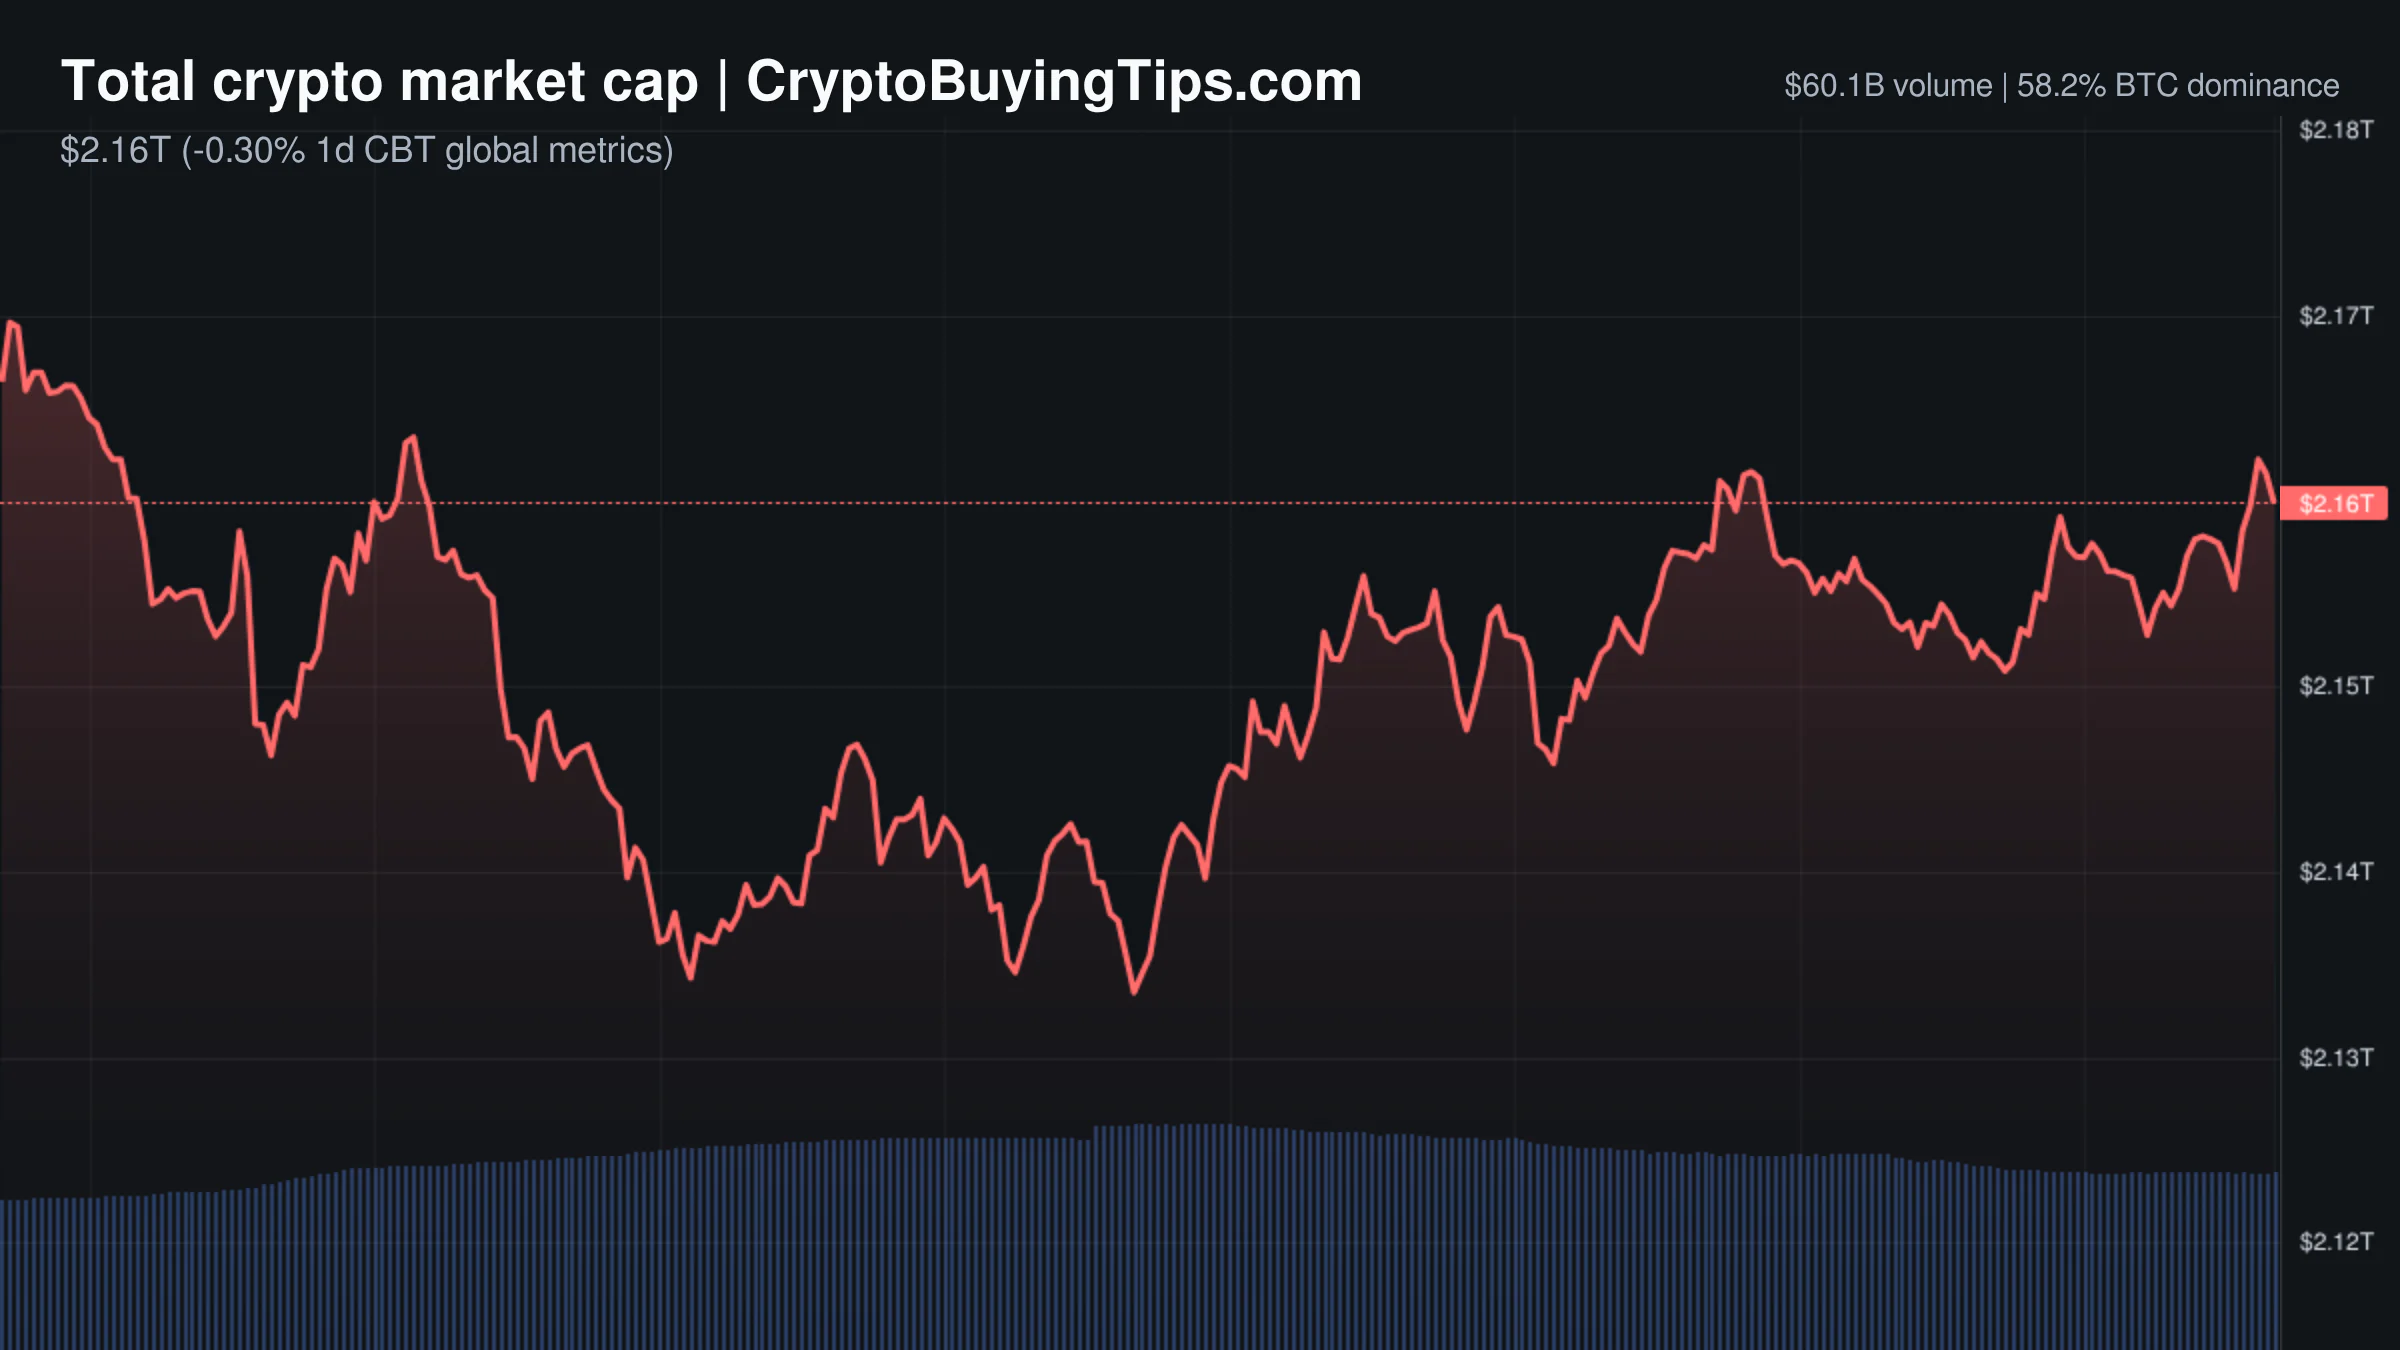
The market is currently in a state of high-intensity panic. A Fear and Greed index score of 18 is comfortably apocalyptic, signaling a phase of extreme fear that usually accompanies deep corrections or capitulation. While the total market cap has dipped to around $2.11 trillion, the real story is the volume. We are seeing a massive divergence where prices are falling but trading activity is exploding.
Spot volume has climbed to roughly $100 billion, but the derivatives market is where the chaos lives. With a 24 hour volume of $1 trillion, derivatives activity has surged by over 70 percent. This suggests that the current price drop is not a quiet slide but a violent event driven by leverage. Traders are fighting over the exit, and the resulting volatility is creating a high-friction environment.
Stablecoin volume has also spiked by over 61 percent. This usually means one of two things. Either investors are rushing into hedges to survive the volatility, or a segment of the market is preparing dry powder for a bottom. Given the extreme fear, it is likely a mix of both. The total market cap has shrunk by about 1.6 percent in the last day, but the sheer volume of trades suggests that the current price level is a battleground rather than a consensus.
Bitcoin and Ethereum
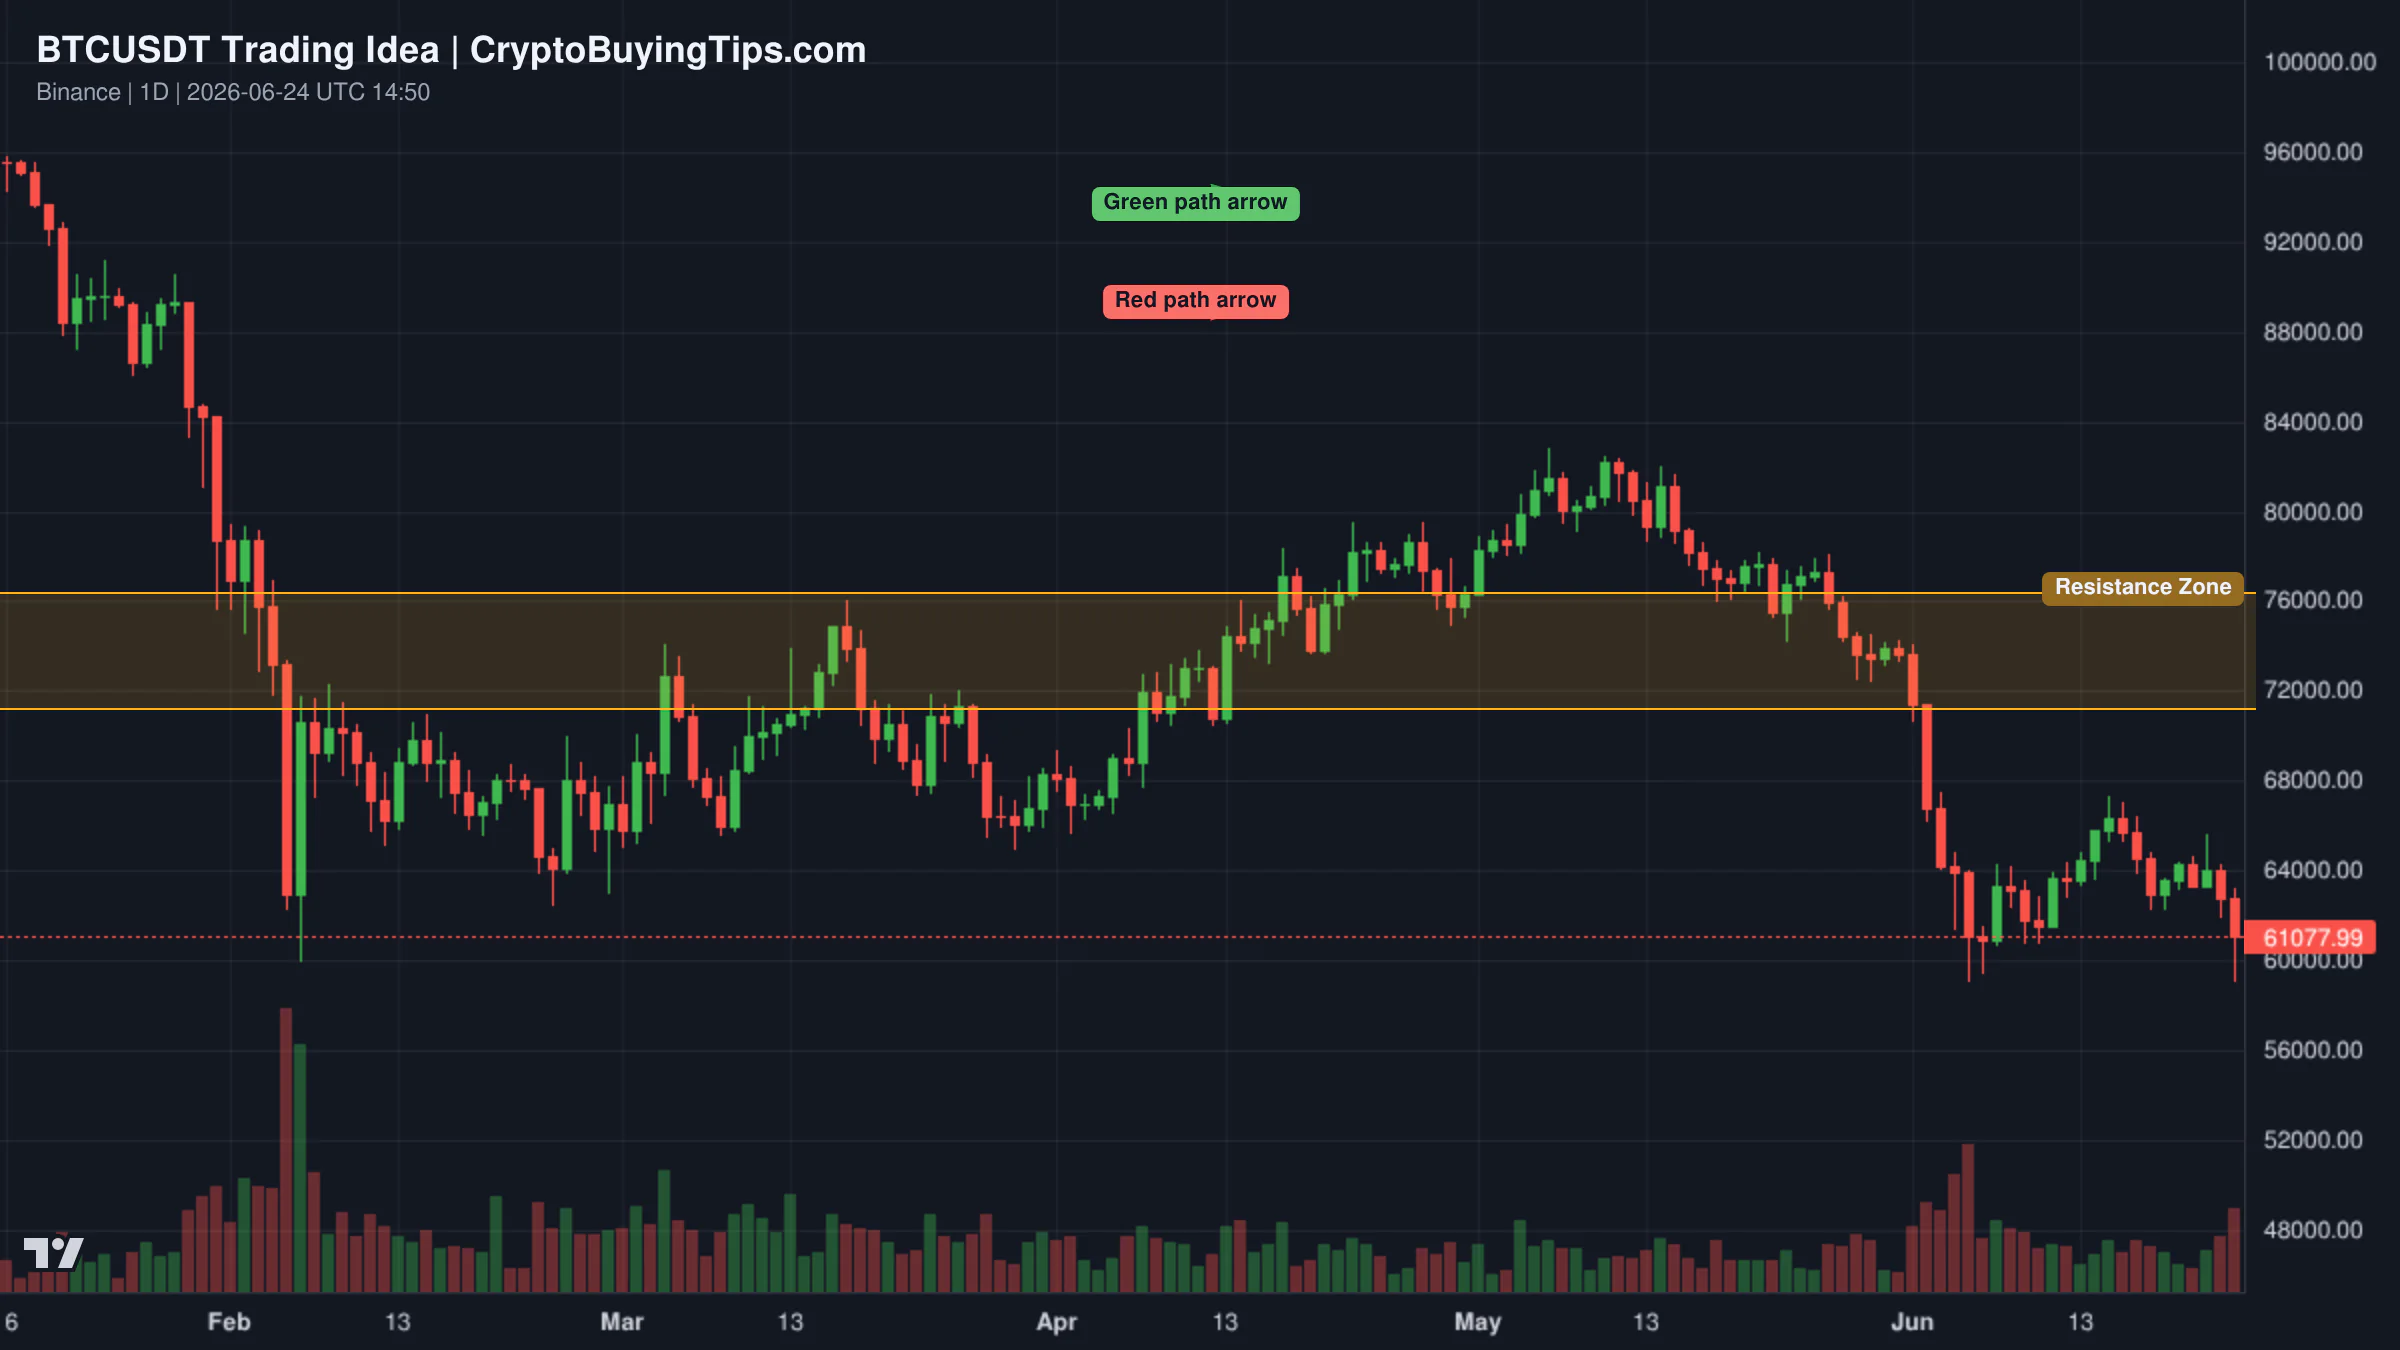
Bitcoin continues to hold the majority of the market's attention, with dominance sitting between 56 percent and 58 percent. The asset is currently trapped in a bearish structure, trading below its key moving averages. While the price action is grim, some on-chain data provides a glimmer of hope. Long-term holders have significantly reduced their spending, with the 90-day average spending falling to 962 BTC. This is the lowest level in 19 months.
The lack of selling from the "OGs" removes a significant amount of supply from the market. However, the absence of selling is not the same as the presence of buying. Demand remains weak, and the market is still waiting for a catalyst to spark a genuine recovery. Until Bitcoin can reclaim the $64,900 level, the trend remains firmly to the downside.
Ethereum is in a state of relative hibernation. Network activity is exceptionally low, with gas fees hovering between 0.15 and 0.22 Gwei. This lack of on-chain congestion is a sign of a dormant ecosystem. While low fees are usually a benefit for users, in a market crash, they often indicate that the "engine" of DeFi is idling. Ethereum dominance has slipped to around 9 percent, reflecting a broader trend where capital is either fleeing to stables or concentrating in Bitcoin.
Top crypto prices
Specific front-page price data for the top coins is unavailable today. However, the broader indices provide a clear picture of the carnage. The CMC20 index is down 2.02 percent and the CMC100 index has dropped 1.82 percent. This shows that the sell-off is not limited to a few outliers but is a systemic move across the top 100 assets. The Altcoin Season Index is currently neutral, sitting around 40 to 42, which means neither Bitcoin nor altcoins are decisively leading the market. Everyone is simply losing value at different speeds.
News driving today's market
The news cycle is a confusing blend of political theater and genuine regulatory risk. President Trump has canceled the signing of a housing bill that would have banned central bank digital currencies (CBDCs) until 2030. He is using the bill as leverage to push for a controversial voting rights act. For the market, this is a reminder that crypto-friendly legislation is often a pawn in larger political games. While the bill's carve-out for stablecoins was a positive, the delay in signing it removes a short-term bullish catalyst. We previously covered Bank of Japan raised rates for more background.
On the regulatory front, the U.S. Department of Justice has seized cloud infrastructure linked to the Huione Group, which is accused of laundering billions in crypto fraud. This is a serious strike against the technical backbone of illicit finance. When the DOJ moves against the infrastructure itself, it signals a shift toward more aggressive systemic enforcement.
Adding to the tension, Binance has withdrawn its bid for a Greek MiCA license. The exchange must find a home base in the EU by July 1 or face potential operational shutdowns for millions of users. This creates a genuine operational risk for one of the world's largest exchanges. We previously covered how the volume data suggests fight in a similar volatile environment, and the current spike in derivatives volume suggests that the fight has only intensified.
There is some potential for a long-term pivot, however. South Korean officials have met with the U.S. SEC to discuss unified crypto rules. If one of Asia's most active markets can align its framework with the U.S., it would significantly de-risk the global landscape.
Social intelligence
The social sentiment is a mix of macro anxiety and desperate optimism. President Trump has once again called for the Federal Reserve to cut interest rates. In a market currently drowning in extreme fear, the hope for cheaper capital is a recurring theme.
Michael Saylor is attempting to pivot the narrative toward AI. He expects capital flowing into giants like OpenAI and SpaceX to eventually rotate back into Bitcoin. It is a bold theory, but it feels a bit optimistic when the total market cap has wiped out $2.3 trillion in just eight months.
Geopolitical tensions are also adding a layer of risk. Trump has stated that any shipping fees in the Strait of Hormuz would be a "red line" in U.S.-Iran negotiations. While oil prices have returned to pre-war levels and some traders are shrugging off the fears, the threat of a geopolitical flashpoint usually pushes investors away from risk assets and into the safety of the dollar.
Trading ideas worth watching
The first setup focuses on Bitcoin and the behavior of long-term holders. The data shows that "OGs" have stopped selling, which removes supply pressure. But a lack of supply is not a buy signal if there is no demand. The price remains below the EMA20, EMA50, and EMA200. The immediate bottom test is at $59,080. If this level holds and the asset reclaims $64,900, a bottoming process could begin. However, if $59,080 fails, the realized-price floor near $53,600 is the more likely candidate for a final washout. The setup is neutral; the bulls must prove that buyers actually exist.
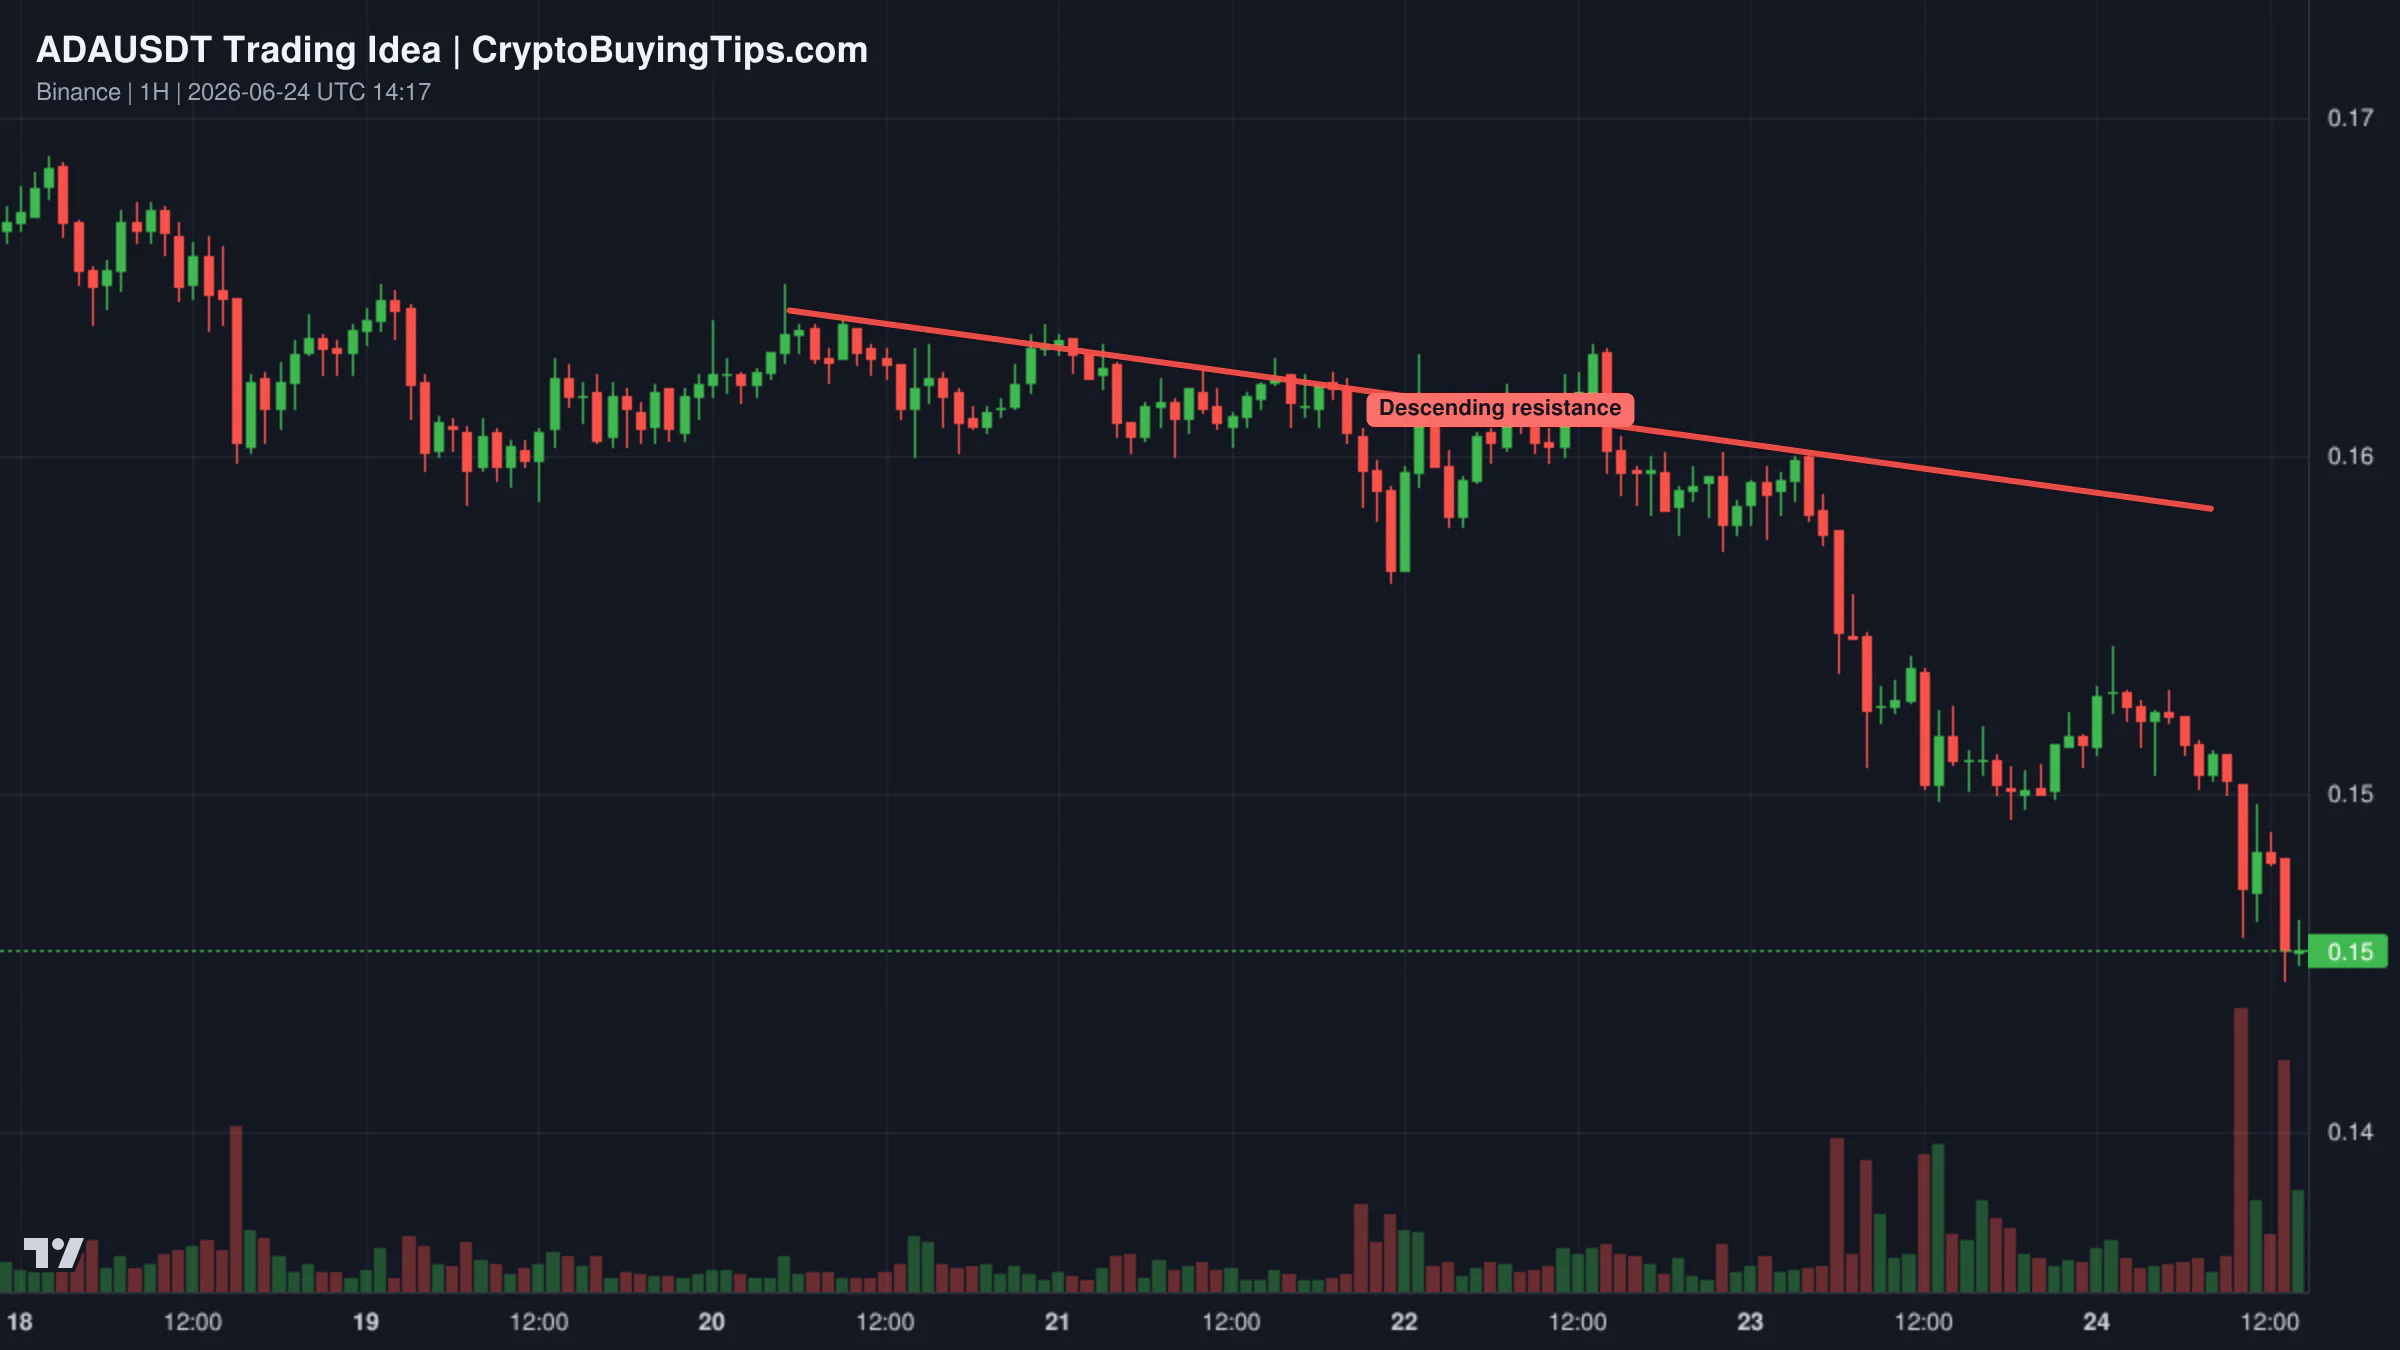
For Cardano, the technicals look like a disaster on the surface. The RSI is at 14.2, which is deeply oversold. In a vacuum, this looks like a buy signal, but the structure is still aggressively bearish. The ADX is at 68.5, confirming that the downward trend has significant strength. Chasing shorts at $0.1453 is unattractive because the low has already been swept. The more logical trade is to wait for a relief bounce into the $0.1548 to $0.1631 range and sell the rejection. A 4-hour close above $0.1631 would invalidate this bearish view.
What to watch next
The market is currently a pressure cooker of extreme fear and massive volume. The divergence between falling prices and exploding derivatives activity suggests that we are in the middle of a high-volatility event. The $1 trillion derivatives volume is a warning that a large number of positions are being liquidated or flipped.
The immediate focus is on the $59,080 level for Bitcoin. A failure there could trigger a move toward $53,600, which would be the final act of capitulation for many. On the macro side, keep an eye on the July 1 deadline for Binance in the EU. Any failure to secure a license could lead to a sudden loss of liquidity and user access in a major region.
For now, the data suggests patience. When the Fear and Greed index hits 18, the market is usually too emotional for precise timing. The "smart money" may be preparing entries, but until the bearish structure on the daily charts breaks, the path of least resistance remains down.
Some links in this article may be affiliate links. We may earn a commission at no extra cost to you — this never influences our analysis or coverage.
Sigrid Voss
Crypto analyst and writer covering market trends, trading strategies, and blockchain technology.
More Articles
Crypto Market Overview | Institutional adoption signals clash with persistent retail fear | July 15, 2026
Crypto market overview shows price gains despite fear sentiment; see how derivatives volume signals potential short…

Bitcoin is rising while ETFs bleed $425M. Here is the danger
Bitcoin climbs despite $425M ETF outflows; our read shows the price action isn't backed by institutional buying, but by…
Crypto Market Overview | Institutional tokenization gains steam amid market apprehension and stablecoin inflows | July 14, 2026
Market overview shows apprehension despite $2.24T cap; tokenization gains steam while stablecoin inflows suggest…

The UK wants to tokenize everything, but Ethereum is barely breathing
The UK's tokenization push seems awfully ambitious given Ethereum gas fees hover near zero. Our data suggests…