
Crypto Market Overview | Institutional adoption contrasts with low altcoin utility and high derivatives betting volume | August 5, 2026
Crypto Market Overview | Institutional adoption contrasts with low altcoin utility and high derivatives betting volume | August 5, 2026
Market overview
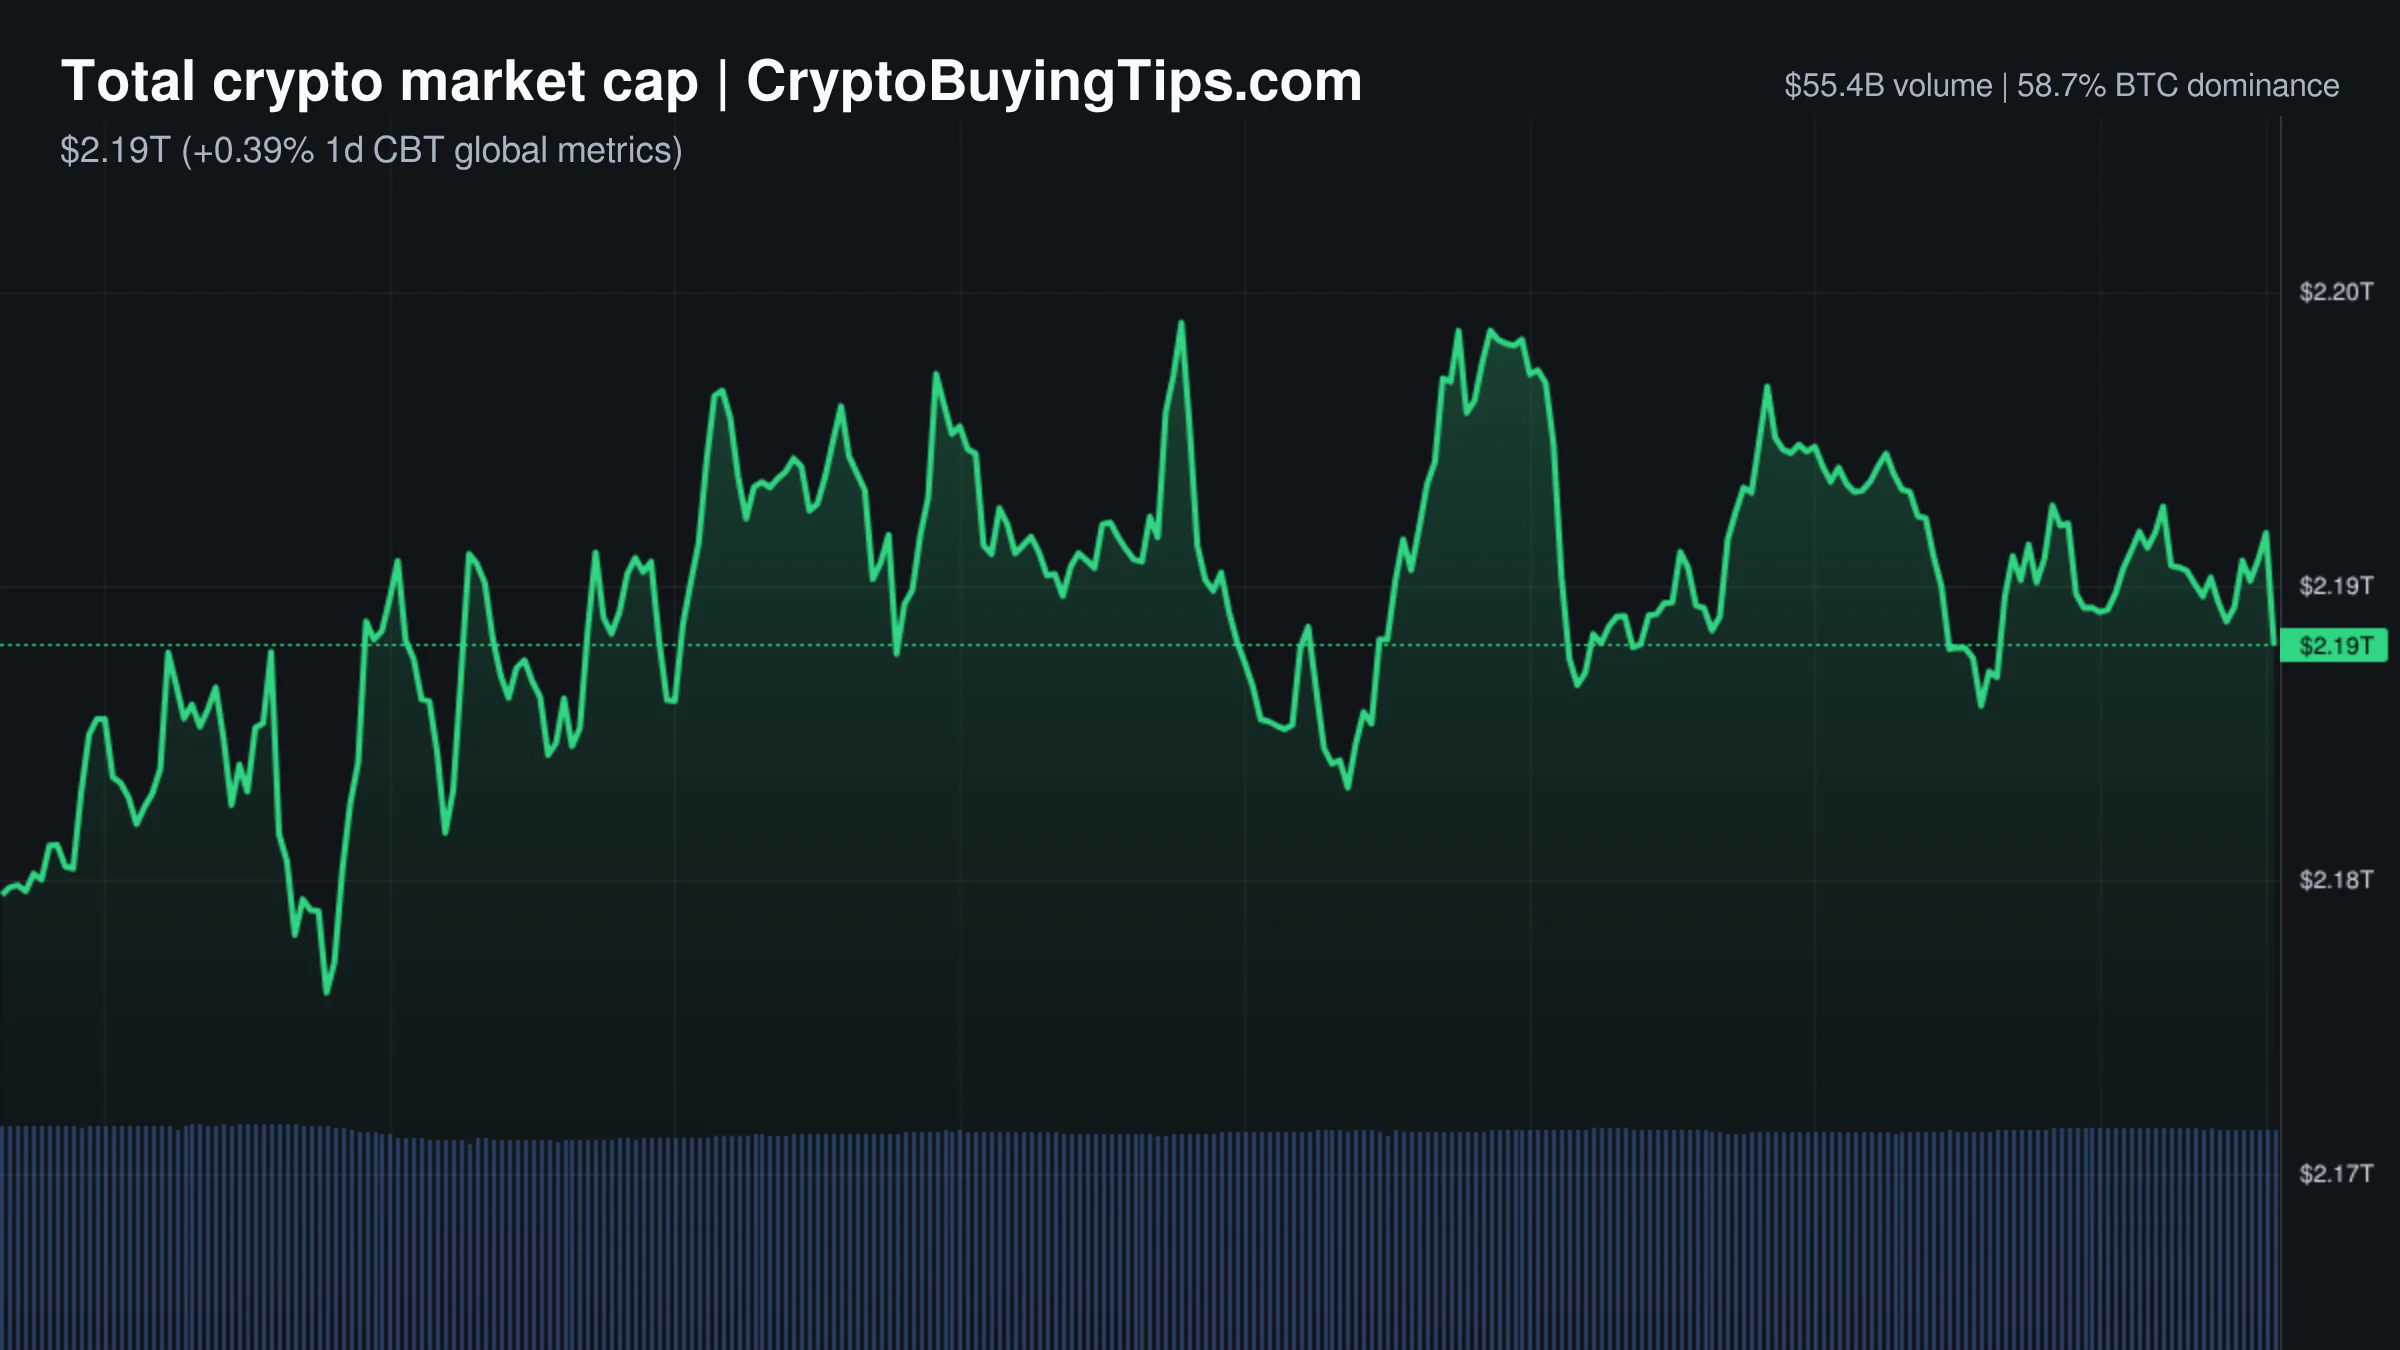
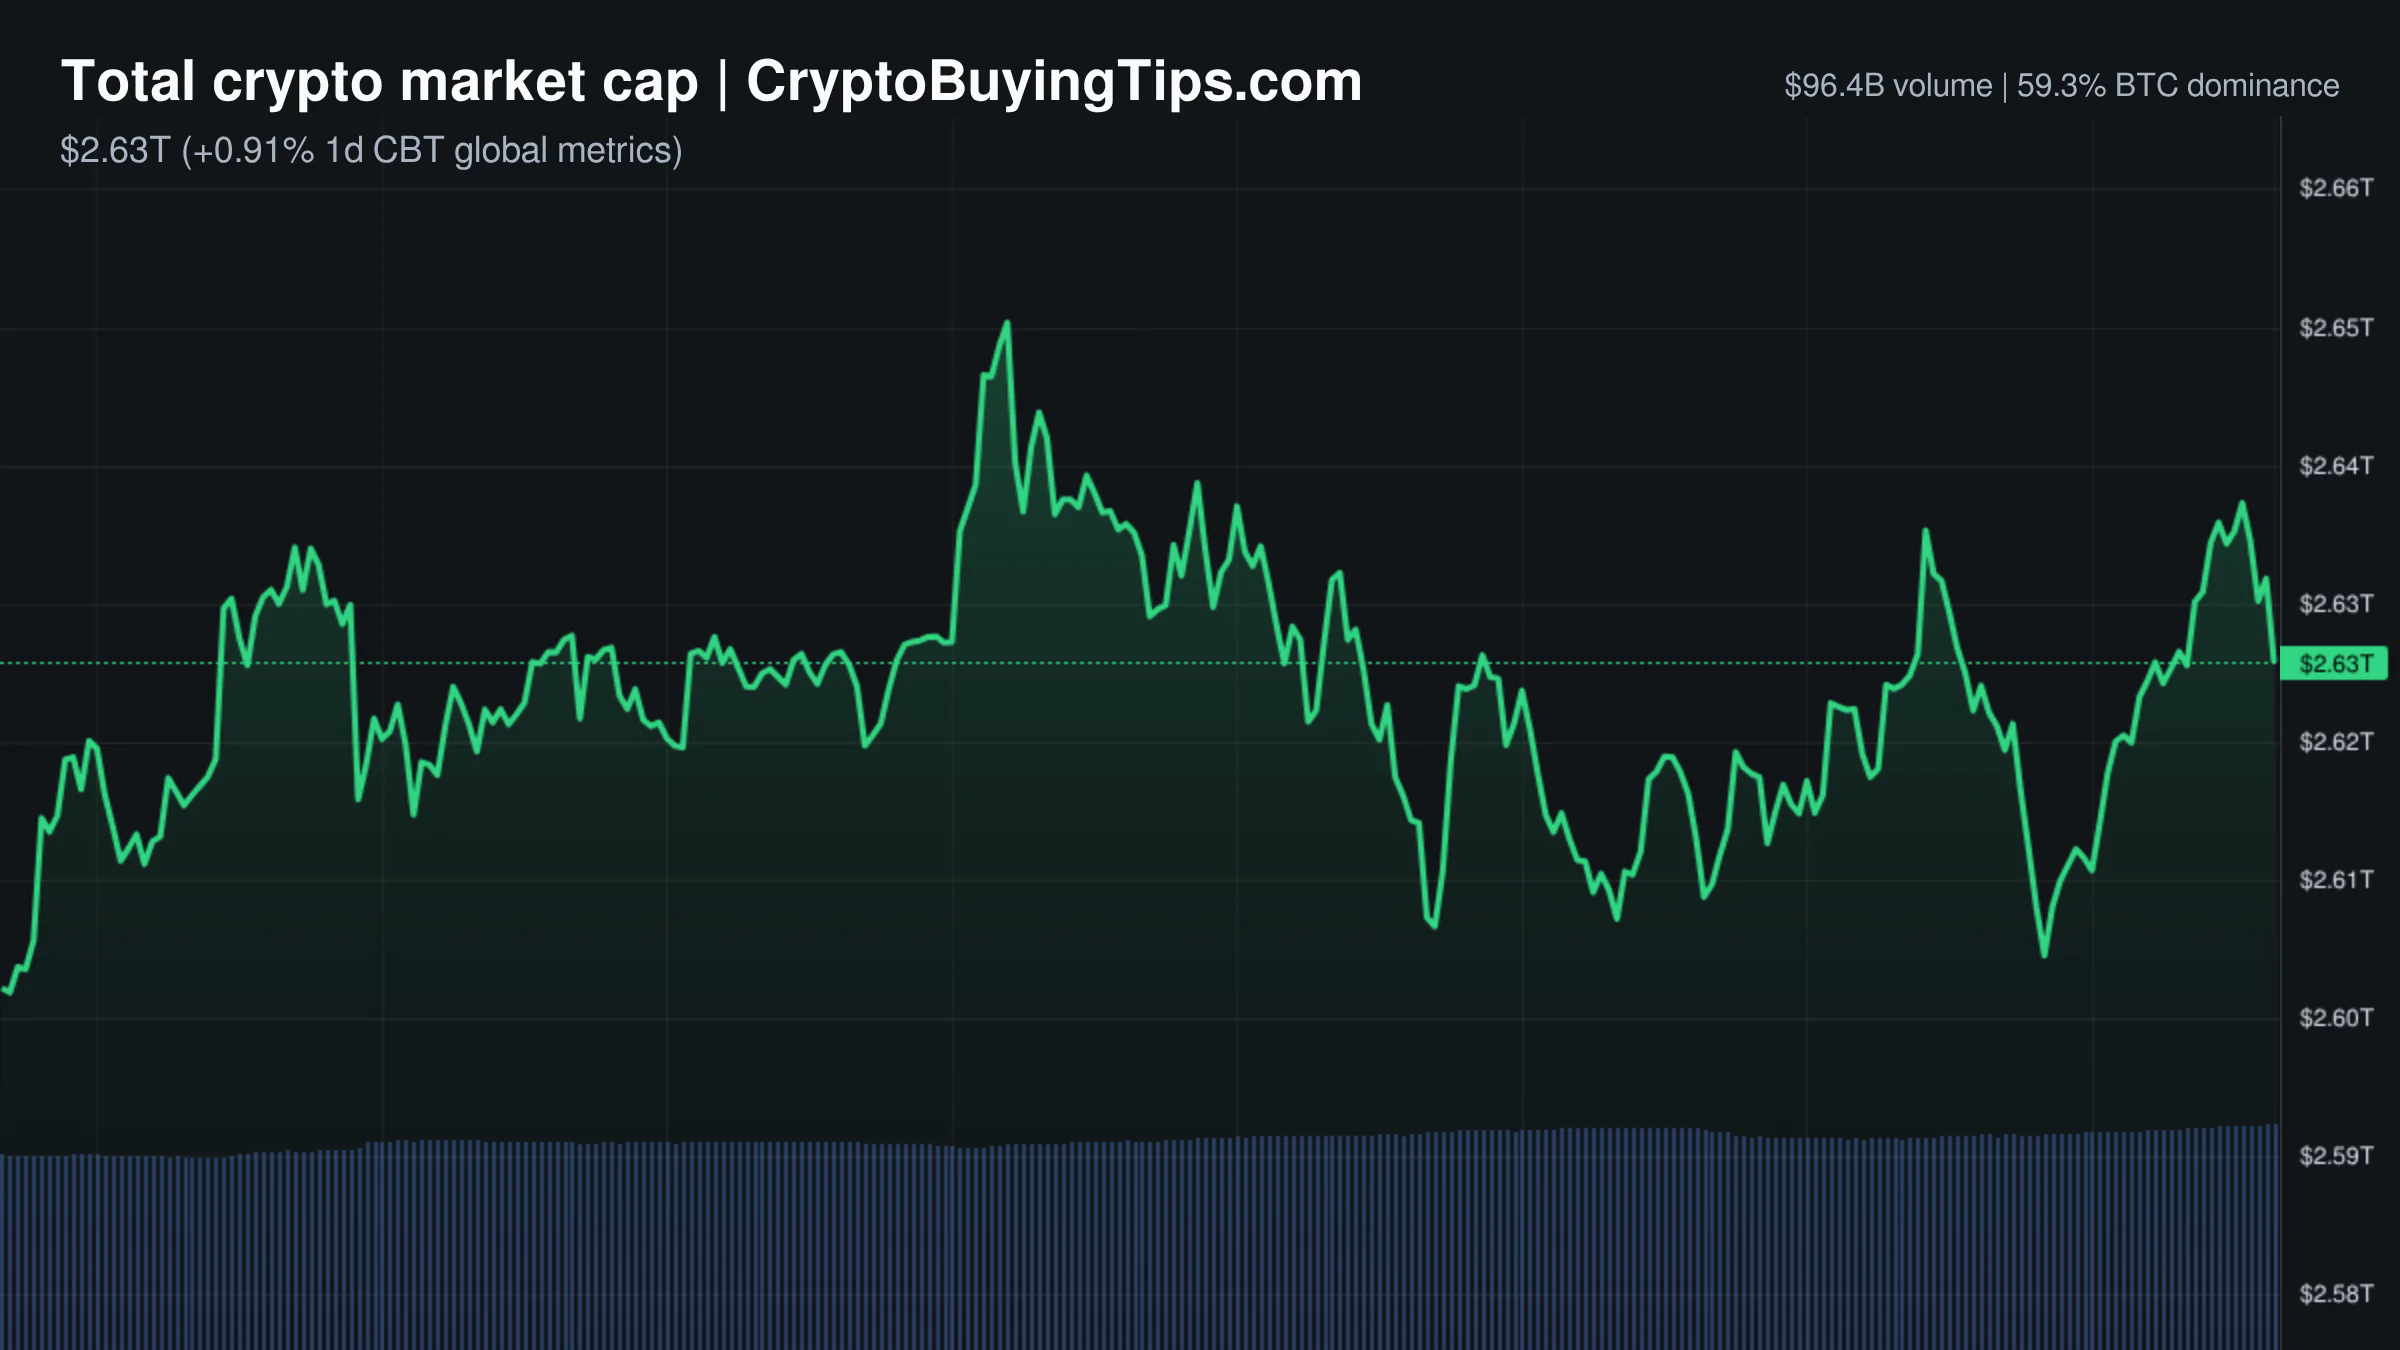
The market is currently presenting a curious contradiction. While the Fear and Greed Index sits at 38, suggesting a pervasive sense of anxiety among retail participants, the total market capitalization has edged up to $2.27 trillion. It is the classic crypto dichotomy: the crowd is terrified, but the numbers are marginally positive. We see a total market cap change of 0.33 percent, which is essentially a flatline, yet the underlying activity is skewed heavily toward speculation.
The most telling metric is the activity ratio. Derivatives volume is currently $585.51 billion, which is approximately 10.5 times higher than the $55.47 billion in spot volume. This suggests the current price action is not being driven by organic accumulation but by high-leverage bets. When derivatives volume expands while spot volume contracts, we are no longer looking at a market of buyers and sellers. We are looking at a giant casino where the bets are far larger than the actual chips on the table.
This internal fragility is contrasted by a stark divergence with traditional markets. The S&P 500 and NASDAQ are ripping higher, up 1.80 percent and 3.40 percent respectively. Usually, this risk-on appetite in equities spills over into crypto. Today, that bridge is narrow. Bitcoin dominance remains high at 56.52 percent, which confirms that capital is not rotating into altcoins. Instead, it is huddling in the largest asset for safety. The Altcoin Season Index at 20 indicates we are firmly in a Bitcoin season. Money is not flowing into the periphery; it is retreating to the center.
Bitcoin and Ethereum
Bitcoin is currently trading at $63,996.98. It remains the sole anchor for the market, maintaining a dominant grip on liquidity. The price action is stagnant, but the institutional narrative is attempting to provide a floor. We are seeing a push from the traditional side, with JP Morgan raising its target price to $240 for certain indices, which suggests that the "smart money" is looking past the current retail fear. However, the lack of spot volume suggests that these targets are theoretical until a real catalyst forces a breakout.
Ethereum is in a more complicated position. Trading at $1,865.79, it is the primary beneficiary of the tokenization trend, yet its network metrics are ghostly. Gas fees are currently between 0.09 and 0.12 Gwei. This is an incredibly low level of activity for a network that is supposedly the foundation for the future of global finance.
There is a widening gap between the PR and the plumbing. While BlackRock and JP Morgan use the network to tokenize hundreds of billions in funds, the actual on-chain utility for the average user has vanished. We previously covered how Ethereum market share vanishes while it undergoes a corporate makeover. The data today reinforces that read. The network is becoming a high-end settlement layer for institutions, but it is losing its identity as a vibrant ecosystem for retail DeFi.
Top crypto prices
The price action across the top assets is mostly sideways, with a few notable exceptions. Bitcoin is holding near $64,000, while Ethereum remains flat at $1,865.79. BNB has shown some strength, climbing 1.21 percent to $596.57.
On the downside, XRP has dipped 1.18 percent to $1.06. This move comes as realized volatility on Binance hits a three-month low, suggesting the asset is entering a period of stagnation. Solana is slightly up at $73.86, and TRON is nearly flat at $0.3281.
The standout performer is Hyperliquid, which has jumped 3.88 percent to $57.26. This gain is particularly interesting given the general apathy toward altcoins today.
News driving today's market
The dominant theme is the aggressive move by Wall Street to tokenize everything that isn't nailed down. BlackRock has tokenized $311 billion of European money market funds using JP Morgan's Kinexys platform on Ethereum. Simultaneously, Wells Fargo is preparing to launch tokenized deposits this fall for corporate clients. BNY is also moving into the space by adding crypto staking to its custody platform via a partnership with Galaxy.
This is a structural shift. We are seeing the "reverse bridge" in action, where traditional finance is not just buying crypto assets but adopting the underlying technology to fix their own inefficient settlement rails. We previously discussed how crypto exchanges reverse bridge the flow of capital. This institutional adoption is a long-term bullish signal, but it does not necessarily help retail prices in the short term. These tokenized assets are often "centralized receipts wearing blockchain paint," and they do not always create the same demand for the underlying token that a retail mania does.
On the regulatory front, the EU's MiCA list continues to expand, adding 12 more companies. This provides a clearer path for institutional entry in Europe. However, Taiwan is introducing a Travel Rule for domestic transfers in October. This adds a layer of compliance friction that usually dampens speculative fervor.
Finally, we have the "AI bubble" narrative. Arthur Hayes is suggesting that overleveraged AI spending will eventually crack, forcing governments to print money to bail out the sector. In his view, this would be the ultimate catalyst for Bitcoin to hit $1 million. It is a bold claim, but it aligns with the historical pattern of crypto acting as a hedge against monetary debasement.
Social intelligence
The social data reveals a hidden tension. On one hand, we have a massive contraction in stablecoin liquidity. USDT has seen its market cap fall by $4 billion over the last 60 days. This is nearing its sharpest contraction on record. When the primary stablecoin shrinks, it usually means capital is leaving the ecosystem or moving into other assets. It is a bearish signal that contradicts the slight price gains we are seeing.
On the other hand, geopolitical noise is creating a potential "risk-on" spark. Reports indicate that a deal to reopen the Strait of Hormuz could be days away, with the US and Iran progressing in talks. If this geopolitical chokepoint clears, the global risk appetite should improve. This would likely benefit the broader market, as it removes a significant layer of macro uncertainty.
Trading ideas worth watching
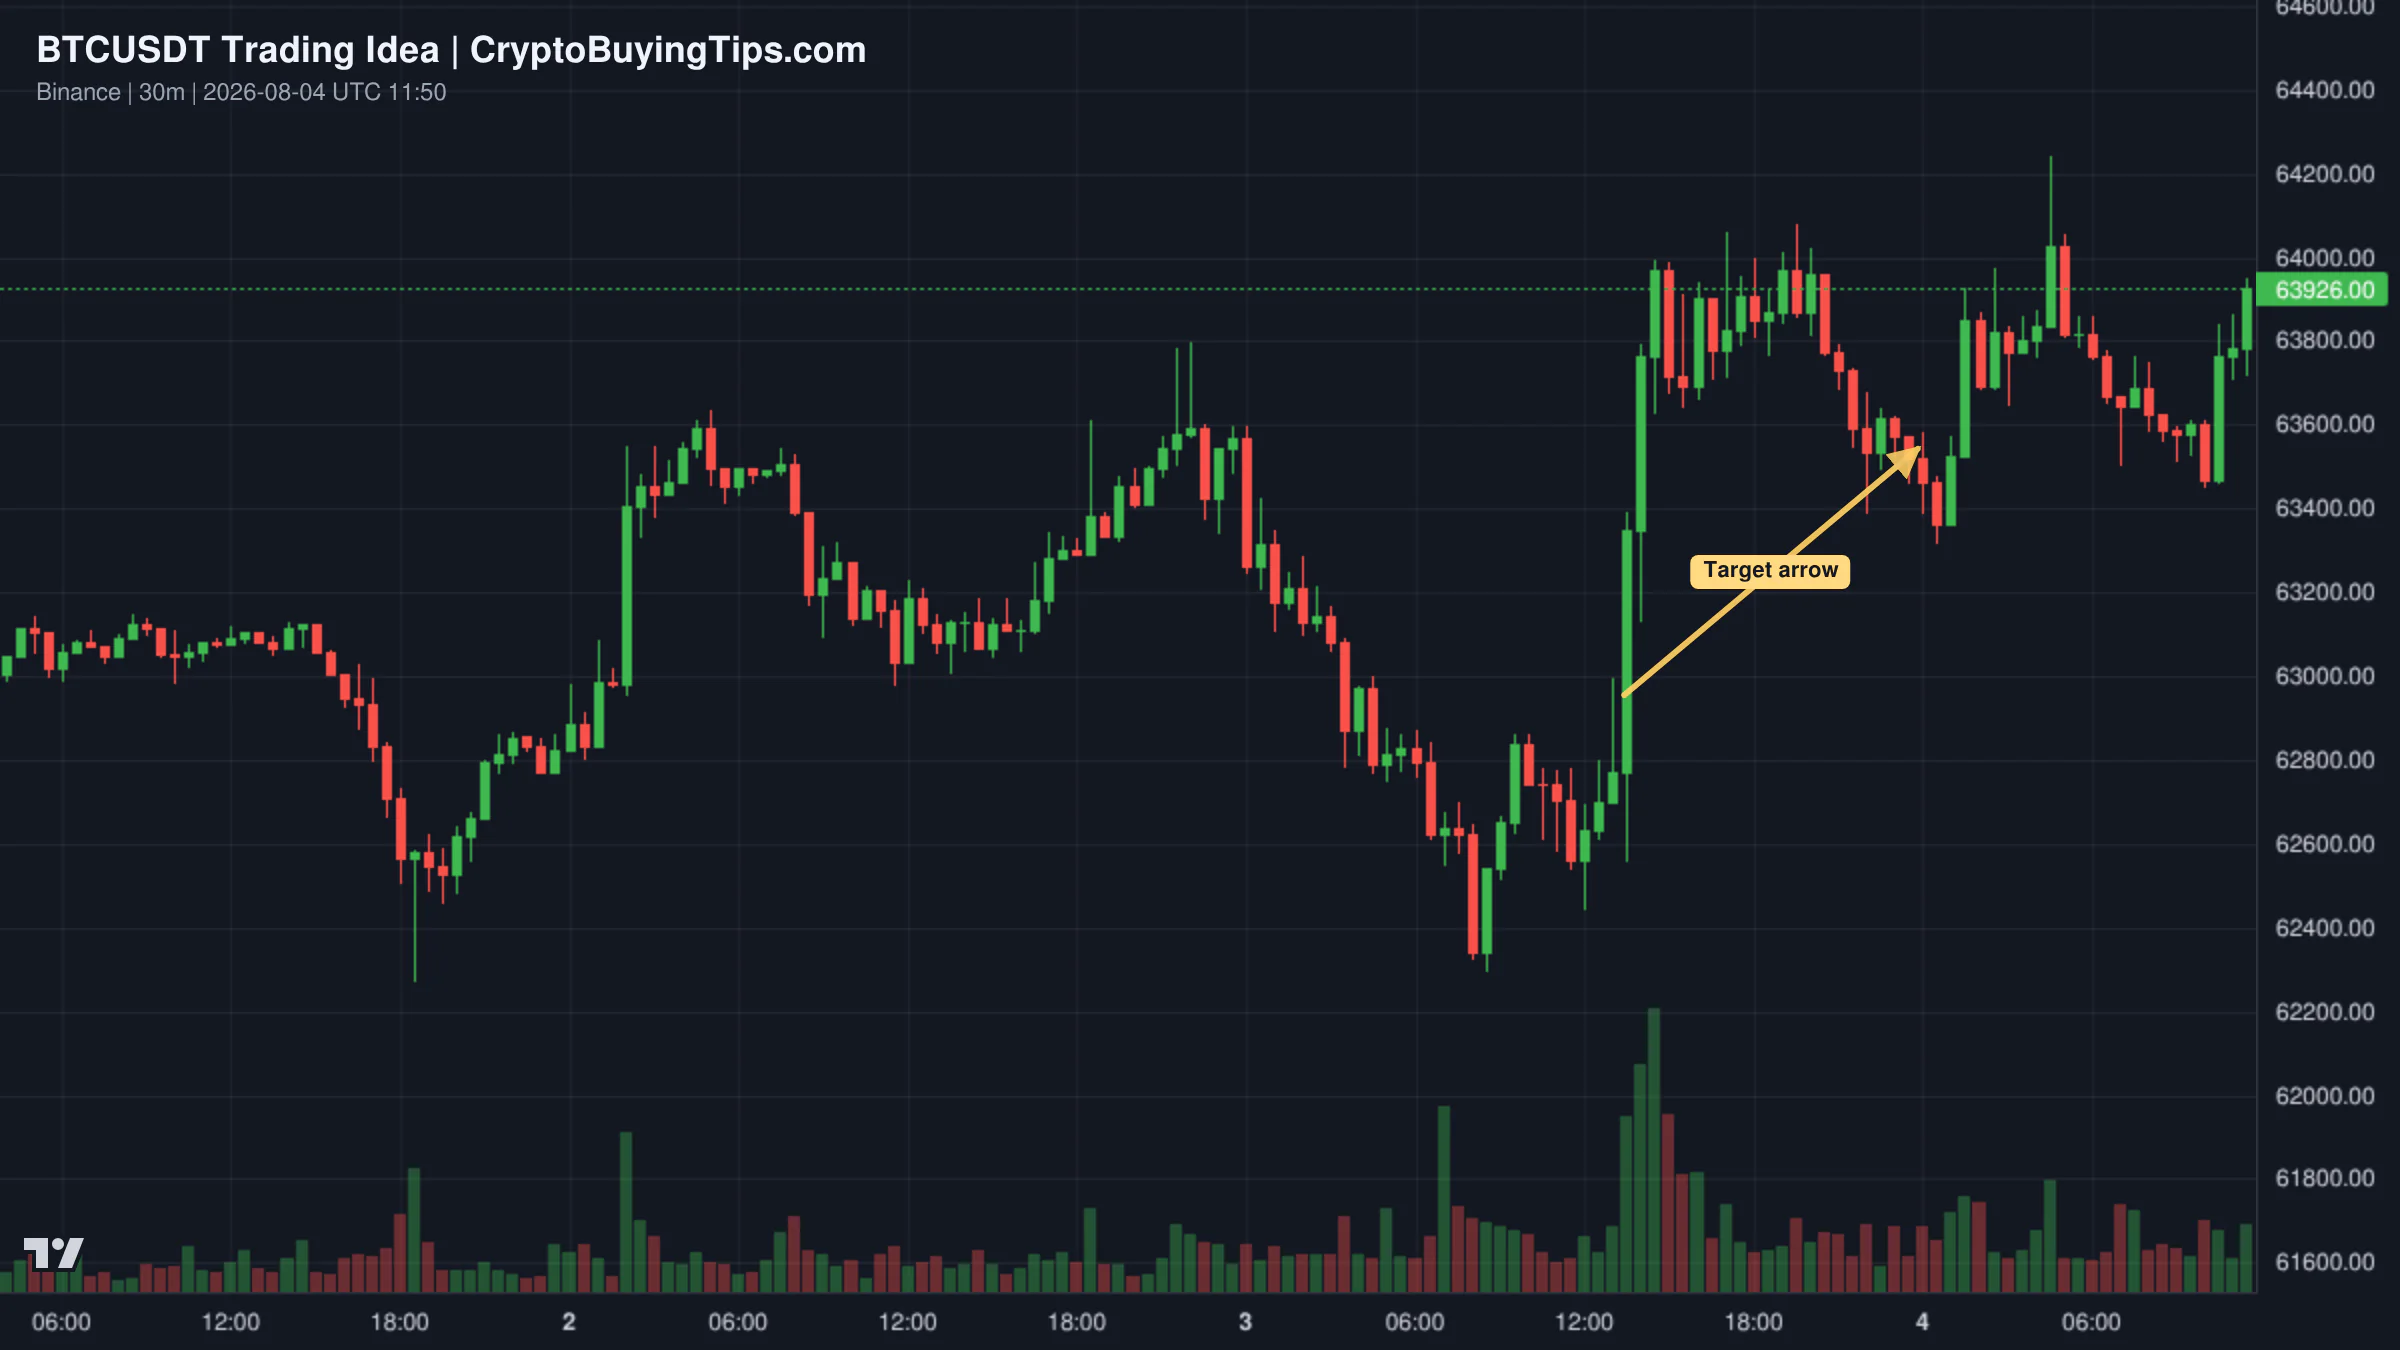
The Bitcoin setup is currently focused on the 64.6k level. Price has reacted well to a demand zone, and buyers are stepping in after a retest. As long as the price holds above the 100 SMA and the previous engulfed level acts as support, the path to $64,600 is open. However, if the demand zone fails, the momentum shifts back to the sellers quickly.
For Ethereum, there is a bullish triangle breakout play on the 2-hour chart. The price is bouncing off support near $1,872.62. The target is a multi-wave expansion toward $1,960. The strategy involves an initial rally to $1,900, a pullback to $1,890, and then a final surge. A close below $1,845 on the 2-hour timeframe would invalidate this setup.
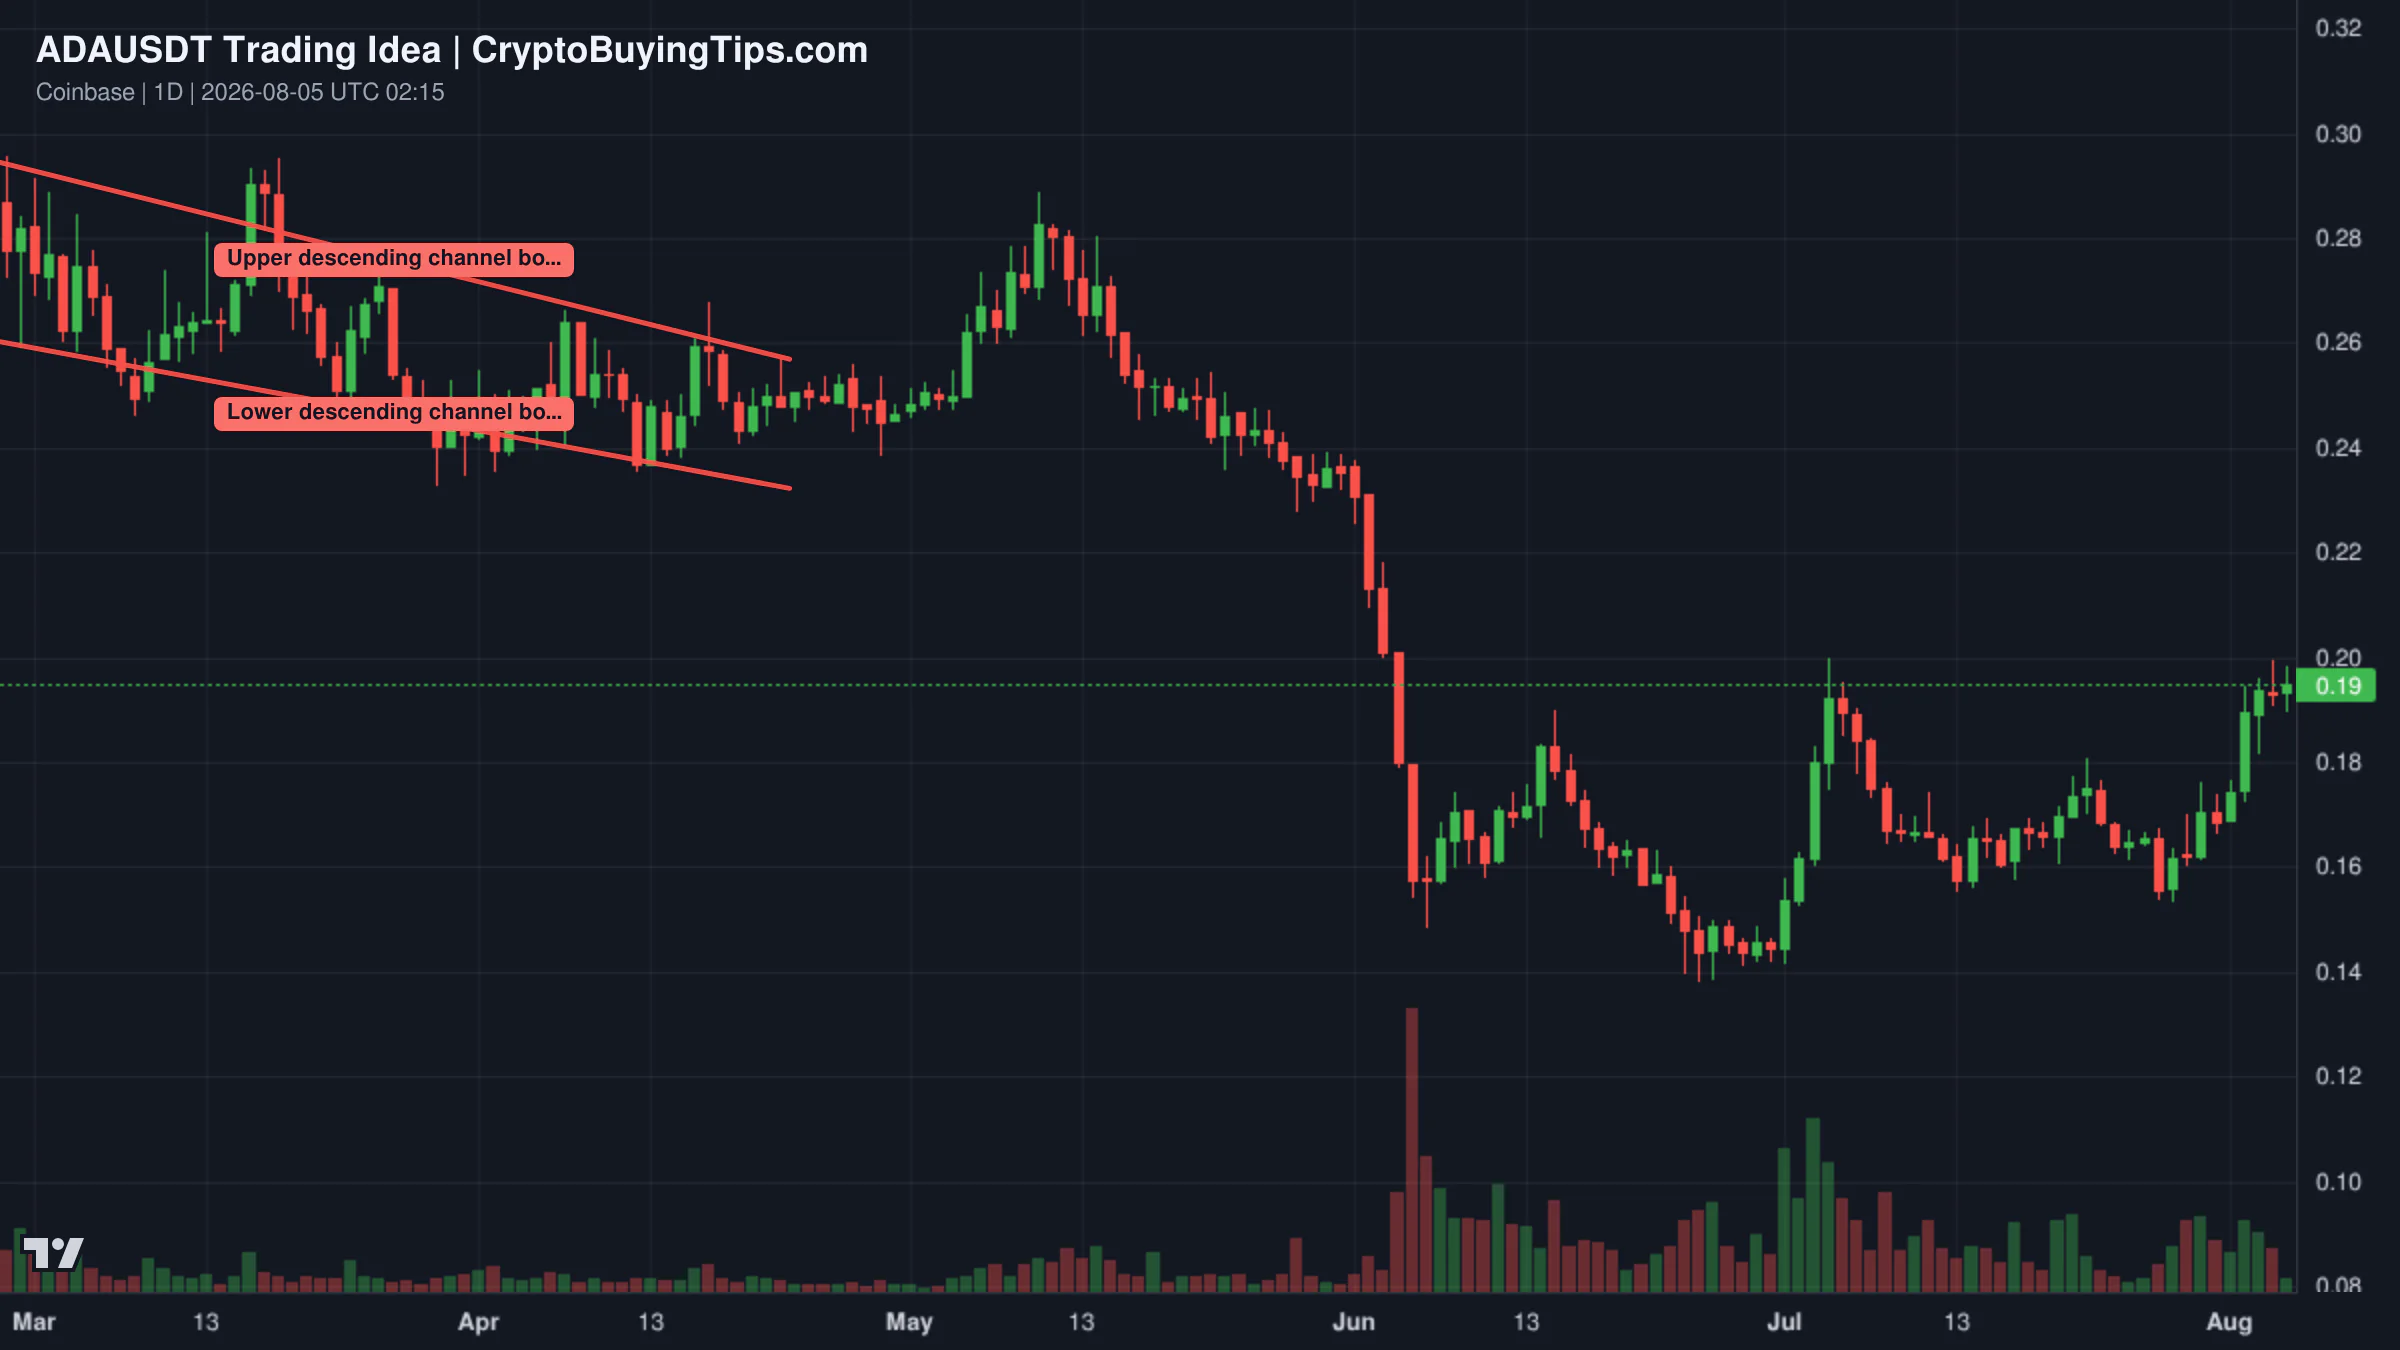
Cardano is showing a long-term recovery pattern. Despite a local double-top that could signal a short-term retrace, the broader trend since June has been upward. The current read is that any dip is a normal fluctuation within a larger bull market. This is a higher-risk play given the general altcoin weakness, but the chart supports a long-term hold.
Altcoin Spotlight
Hyperliquid deserves attention today. While the rest of the altcoin market is essentially asleep, HYPE has managed a nearly 4 percent gain. This is significant because HYPE is not just another token; it is the native asset of a platform that is currently benefiting from the massive derivatives volume we see across the market.
As the activity ratio of derivatives to spot continues to climb, platforms that can efficiently handle that leverage become the real winners. HYPE is essentially a bet on the "casino" aspect of the current market. While we generally dislike high-leverage environments, the data shows that the liquidity is moving there. HYPE is capturing that flow.
What to watch next
The immediate focus is the tension between institutional plumbing and retail sentiment. We have a market where the world's largest asset managers are tokenizing hundreds of billions of dollars, yet the average trader is in a state of "Fear." This suggests that the next leg of the bull market will not be driven by a retail frenzy, but by the slow, grinding absorption of assets into institutional portfolios.
We need to watch the USDT market cap closely. If the contraction continues, the lack of liquidity will make the market more volatile and prone to sharp drops, regardless of how many funds BlackRock tokenizes. Additionally, the potential Hormuz deal could be the catalyst that finally moves the Fear and Greed index back into the neutral or greedy zones. Until then, the market is a high-leverage game of waiting.
Some links in this article may be affiliate links. We may earn a commission at no extra cost to you — this never influences our analysis or coverage.

Sigrid Voss
Crypto analyst and writer covering market trends, trading strategies, and blockchain technology.
More Articles
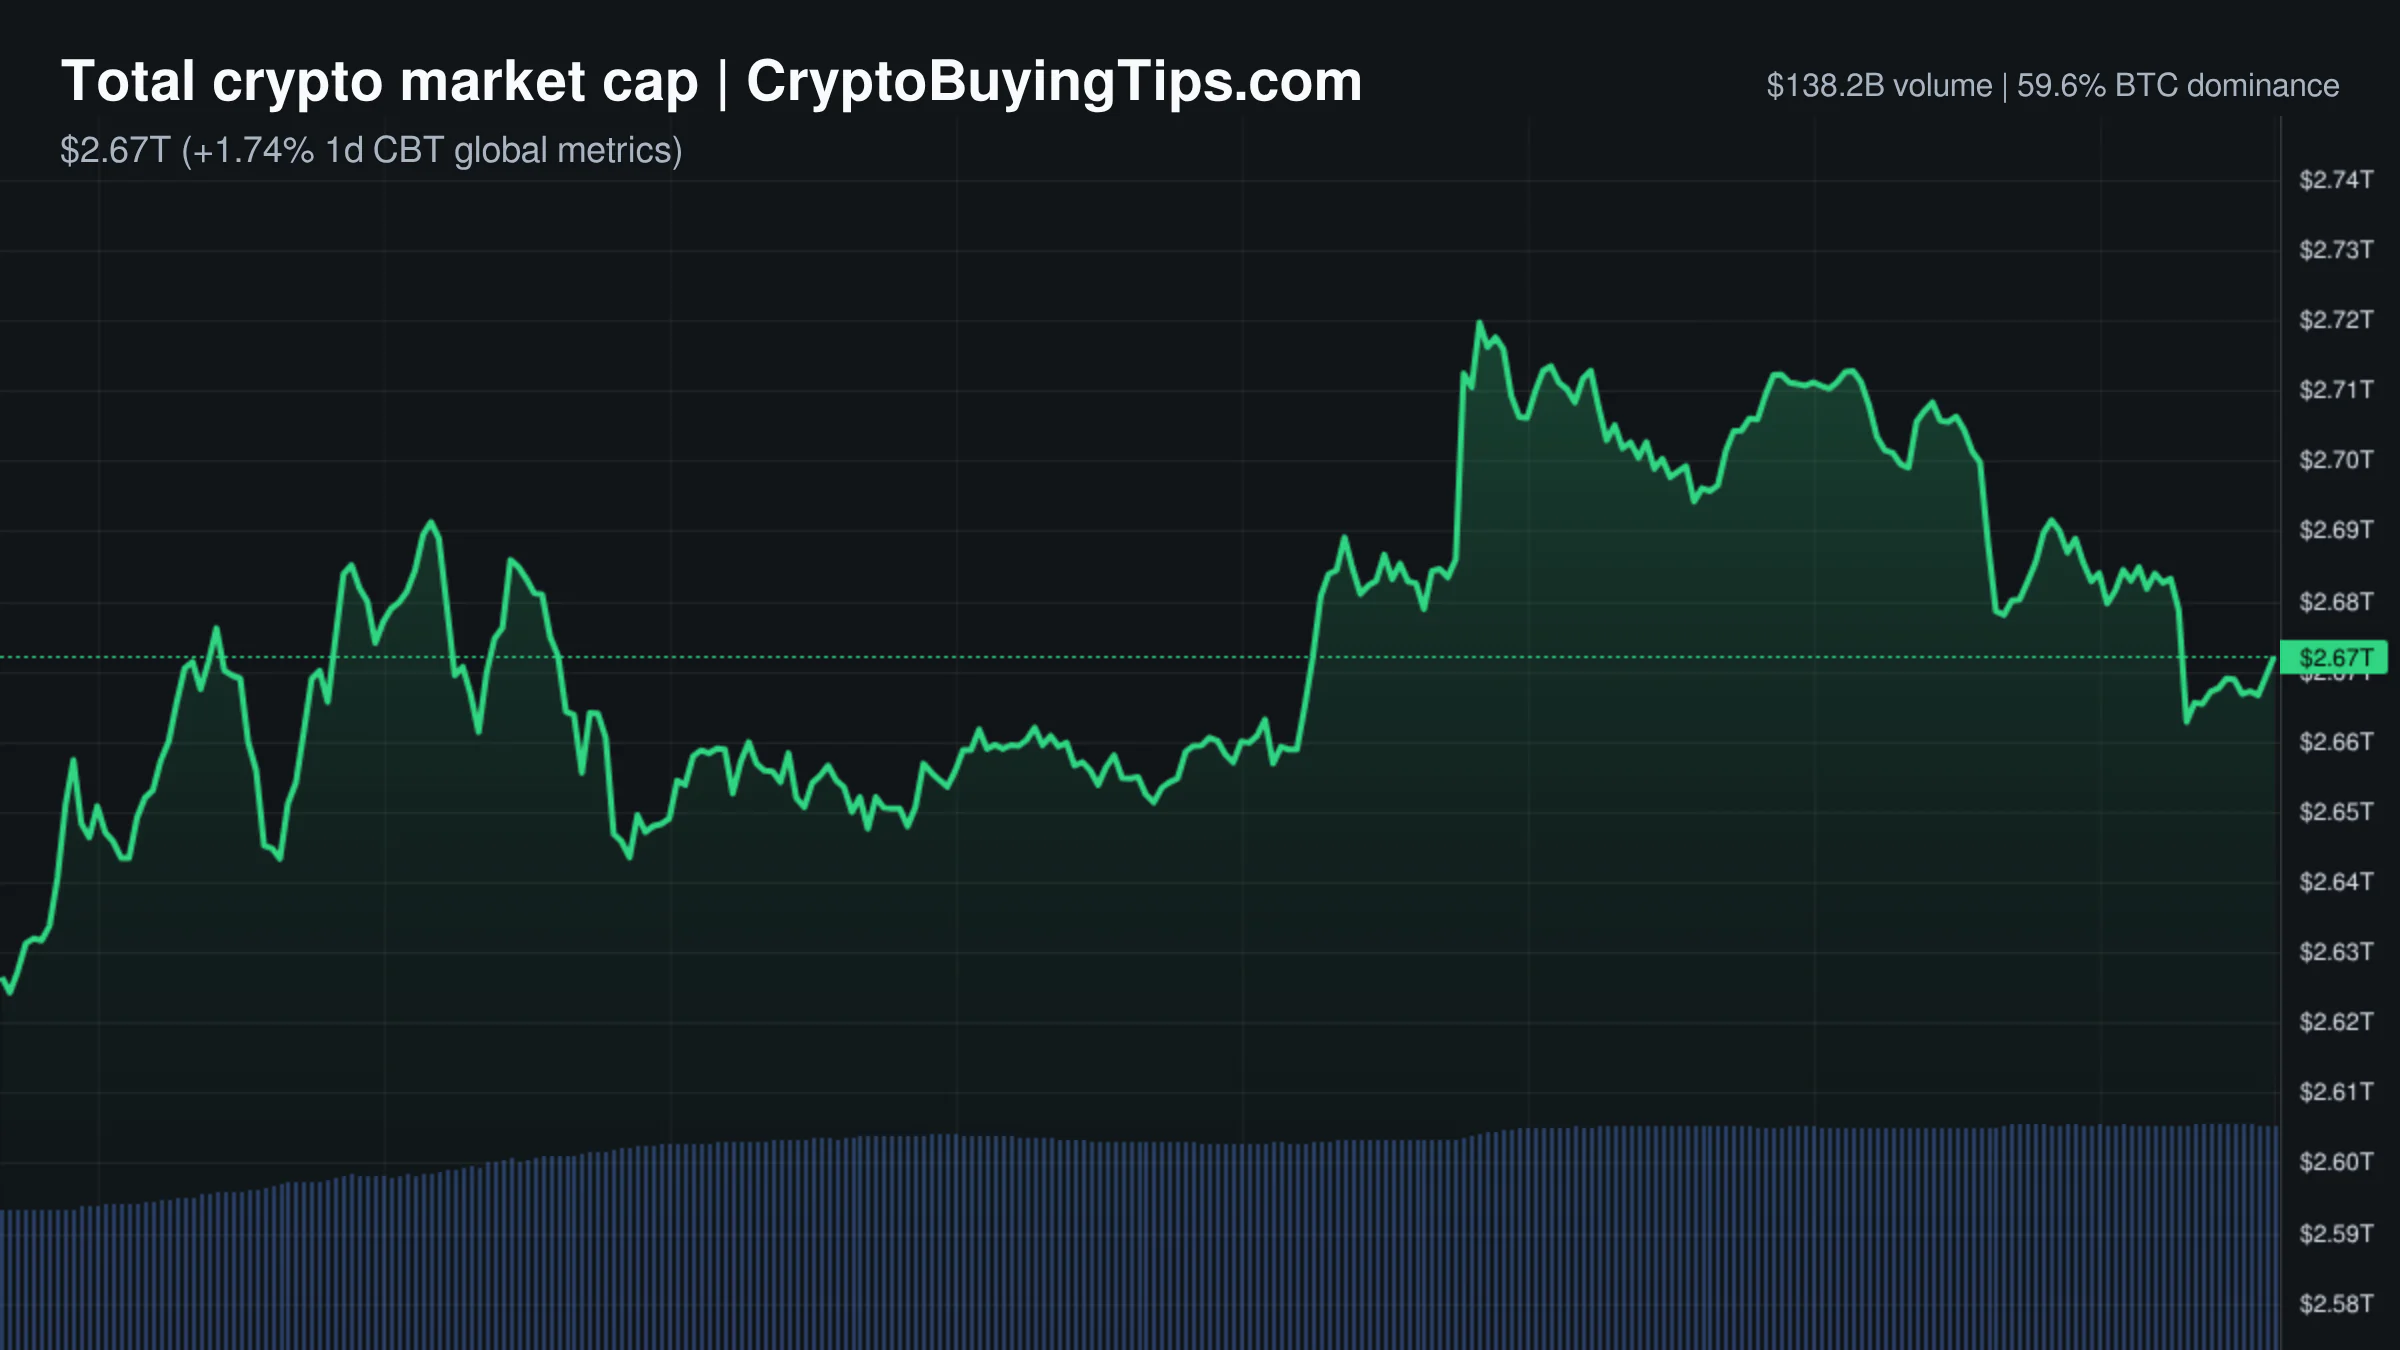
Crypto Market Overview | leverage driving bitcoin's move amid institutional adoption and geopolitical risk | August 25, 2026
The market shows contradiction as leverage drives bitcoin's move amid institutional adoption and geopolitical risk…

Coinbase is putting stocks on Base, but the money is still in Bitcoin
Coinbase has launched tokenized stocks on Base, which sounds rather sophisticated for mere digital shares. However, our…
Crypto Market Overview | Leverage-driven rally amid strong ETF inflows as BTC targets 80k | August 24, 2026
Leverage-driven rally sees BTC near 80k amid strong ETF inflows; see our market overview on current crypto dynamics.

Derivatives volume is 8x higher than spot. Here is why that is a warning
The market's current price action seems to be driven by bets rather than cash; with derivatives volume eight times…