
XRP is calm at $0.9771 in extreme fear. These are the levels that decide whether it lasts
XRP is at $0.9771, down about 0.8% on the day, in a market where the Fear & Greed Index reads 12. That's Extreme fear, a number you'd normally expect alongside a proper washout, not a coin shrugging off less than a percent. So what are the XRP price support and resistance levels behind the calm, and which one gives way first if the calm doesn't last? We previously covered XRP institutional winner for more background.
The short answer
Our read is that $0.94 is the line that matters, with $1.00 as the lid above it. Hold the first and reclaim the second, and the bounce has room. Close below the first, and the bullish case is dead for now.
The backdrop isn't friendly. Our market data tools show US spot bitcoin ETFs have shed $2.58B in November, with BlackRock's IBIT accounting for $2.25B of it. Spot volume is down 5.16% on the day, and derivatives volume is about 10.9x spot, so leverage is doing most of the talking. XRP is holding up in a market that is mostly leaving.
What are the XRP price support and resistance levels?
First, a correction to our own plan for this piece. Our signal scanner's feed today holds three scored setups, all on Bitcoin: two bullish, one neutral. None is on XRPUSDT or XRPUSDT.P. We'd rather say so than dress up a number as scanner output, so the XRP levels below come from public sources and the setup built on them is our own construction.
The levels:
- $1.00 is resistance. CoinStats' XRP coverage cites it as the reclaim many traders want for further gains.
- $0.97 is where price sits now, the current base.
- $0.94 is support, from the same CoinStats piece. It's the line we'd use for invalidation.
- $0.89 is the November 14 low, XRP's weakest level since November 2024 according to that source. It's the next stop if $0.94 fails.
The same source puts daily RSI at 25.47 on November 17. RSI measures how stretched a move is on a 0 to 100 scale, and anything under 30 is conventionally called oversold. Oversold isn't a buy signal, only a statement that sellers have already done a lot of work.
The entry zone
Our zone is $0.95 to $0.97, the stretch between the lower support and today's price. Notice that spot at $0.9771 is not inside it, and the arithmetic shows why that matters. From $0.9771, the move to $1.00 is 2.3% and the fall to $0.94 is 3.8%. You'd be risking more than you could make on the first target.
From an illustrative $0.96 entry, the numbers flip. The fall to $0.94 is 2.1% and the climb to $1.00 is 4.2%, which is about 2:1. That's the reasoning for waiting for a pullback rather than buying a quiet Thursday.
How invalidation works
Invalidation is the price at which your reason for entering is simply wrong. You buy near support because you expect support to hold, so if price closes below it, you don't get to reinterpret the chart. You exit.
Two details trip people up. Use a daily close, not an intraday wick, because thin markets produce wicks that mean very little. And decide the level before you enter, since the moment you're losing money is a terrible time to negotiate with yourself.
What confirms the setup is a daily close back above $1.00. What kills it is a daily close below $0.94, with $0.89 as the next reference. Between them, price is just wandering.
The macro backdrop
This is where the calm looks fragile. Fed Governor Christopher Waller told CNBC the central bank may need a 50-basis-point hike in December, bigger than markets expected, and Bitcoin slipped below $63,000 on the news. Before his comments, Kalshi traders saw an 87% chance of a 25-point hike on December 9 and 12% for something larger. Those odds are a few days old and will have moved.
Higher rates tend to hit assets with no cash flow first, which describes most of this market. A support level doesn't care about the reason it's tested, only whether buyers show up.
Our news scoring system rated the Binance $6.5 billion freezing order story 8/10 for liquidity impact, with a bearish bias. It was the highest-rated story in our feed for novelty and liquidity impact. Add BTC dominance at 58.87% on the CoinMarketCap snapshot, and money is still hiding in Bitcoin and stablecoins (stablecoin dominance is 11.1% on our tools).
The mixed part: CoinMarketCap's Altcoin Season Index reads 58/100, Neutral, on a 90-day view. Plenty of alts have kept pace with Bitcoin over three months despite the fear reading. That may explain why XRP isn't collapsing. It's also a lagging measure.
One more link back to Bitcoin. Our scanner's neutral BTC setup eyes a possible 58k test. From $63,464.93 that's about 8.6% lower. We wouldn't expect $0.94 on XRP to be spared if Bitcoin goes there.
Funding rates and liquidation totals didn't load in our data pull today, so we can't tell you how crowded the leverage is. That's a real gap, and it's the first thing we'd check before acting. (We previously covered a similar XRP and Bitcoin setup when conditions were considerably more cheerful.)
Where people get tripped up
Treating a level as a wall is the classic one. Support is an area where buyers have shown up before, and every test uses up some of them.
The second mistake is trading the fear index like a signal. A reading of 12 says sentiment is poor, not that the low is in. It has been poor for a while, and the Fed risk is arriving into it.
The third is sizing. A tight invalidation is only useful if the position is small enough that being stopped out is boring.
The verdict
Our view is patience. XRP is holding, but holding in a thin, leverage-heavy market with a rate-hike risk that grew this week, and with no XRP-specific scanner setup to lean on. The setup works only if you get the entry near $0.95 to $0.97 and treat a daily close under $0.94 as final.
If price drifts up to $1.00 without you, that's fine. A confirmed daily close above it is a better signal than anything we can see today, and it will still be there to buy.
Some links in this article may be affiliate links. We may earn a commission at no extra cost to you — this never influences our analysis or coverage.

Sigrid Voss
Crypto analyst and writer covering market trends, trading strategies, and blockchain technology.
More Articles
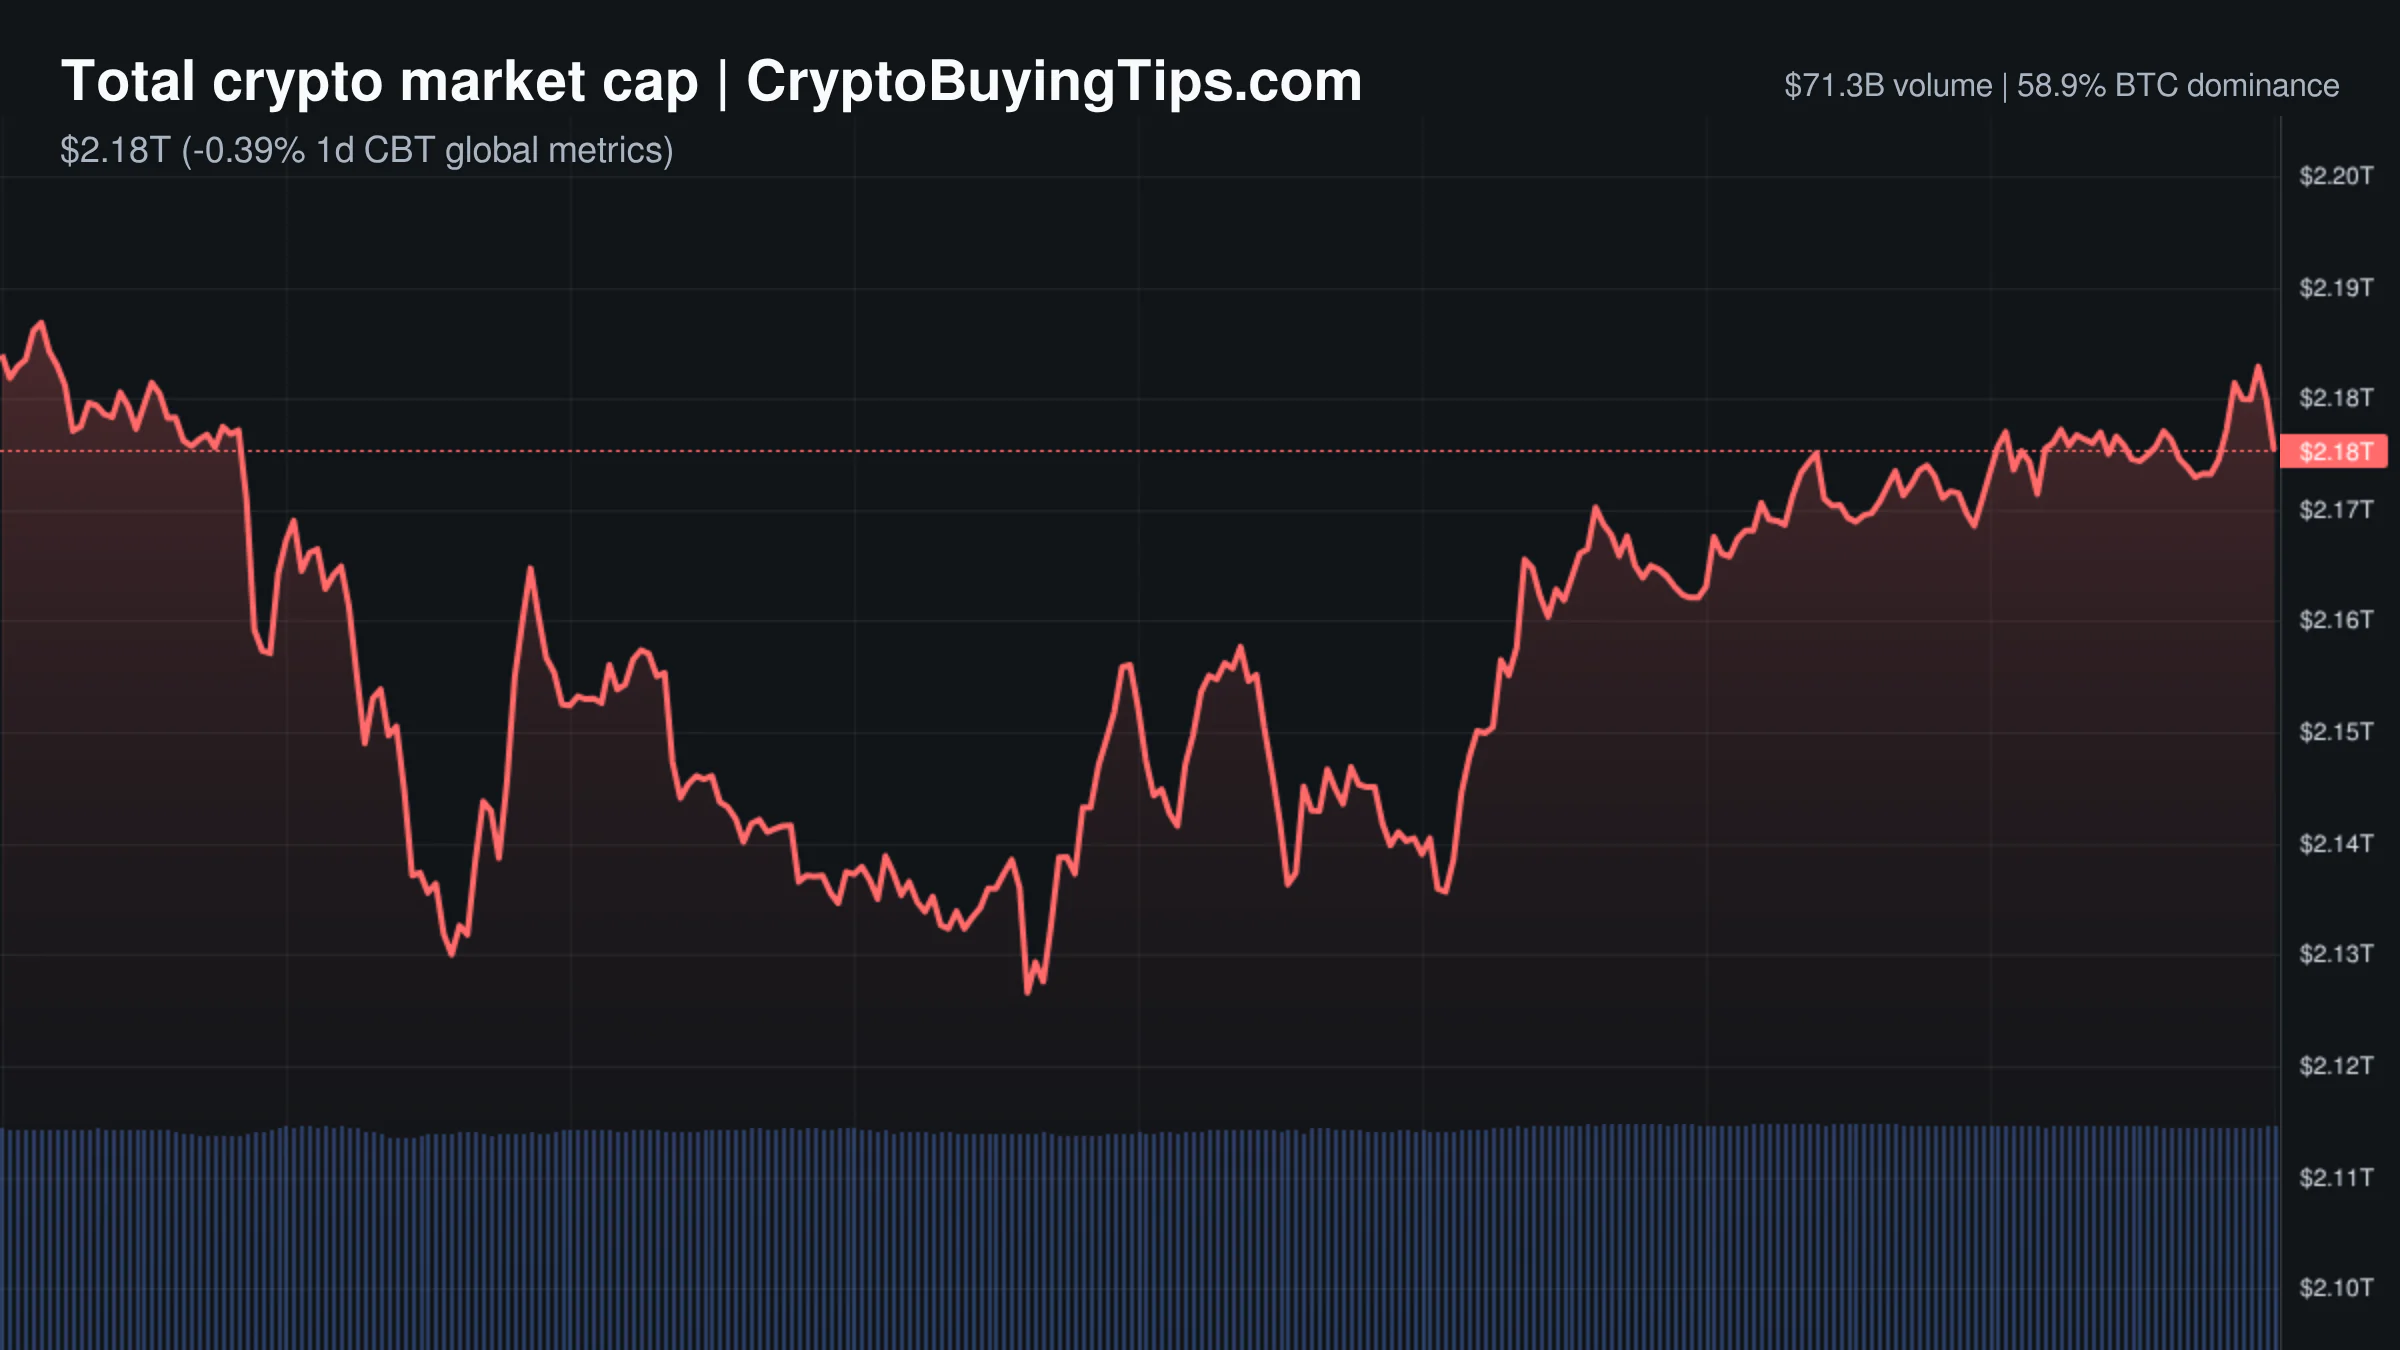
Crypto Market Overview | Extreme fear meets a flat tape as derivatives volume towers over spot | November 19, 2026
The Fear & Greed Index hits extreme fear at 12, yet the crypto market remains flat as derivatives volume towers over…
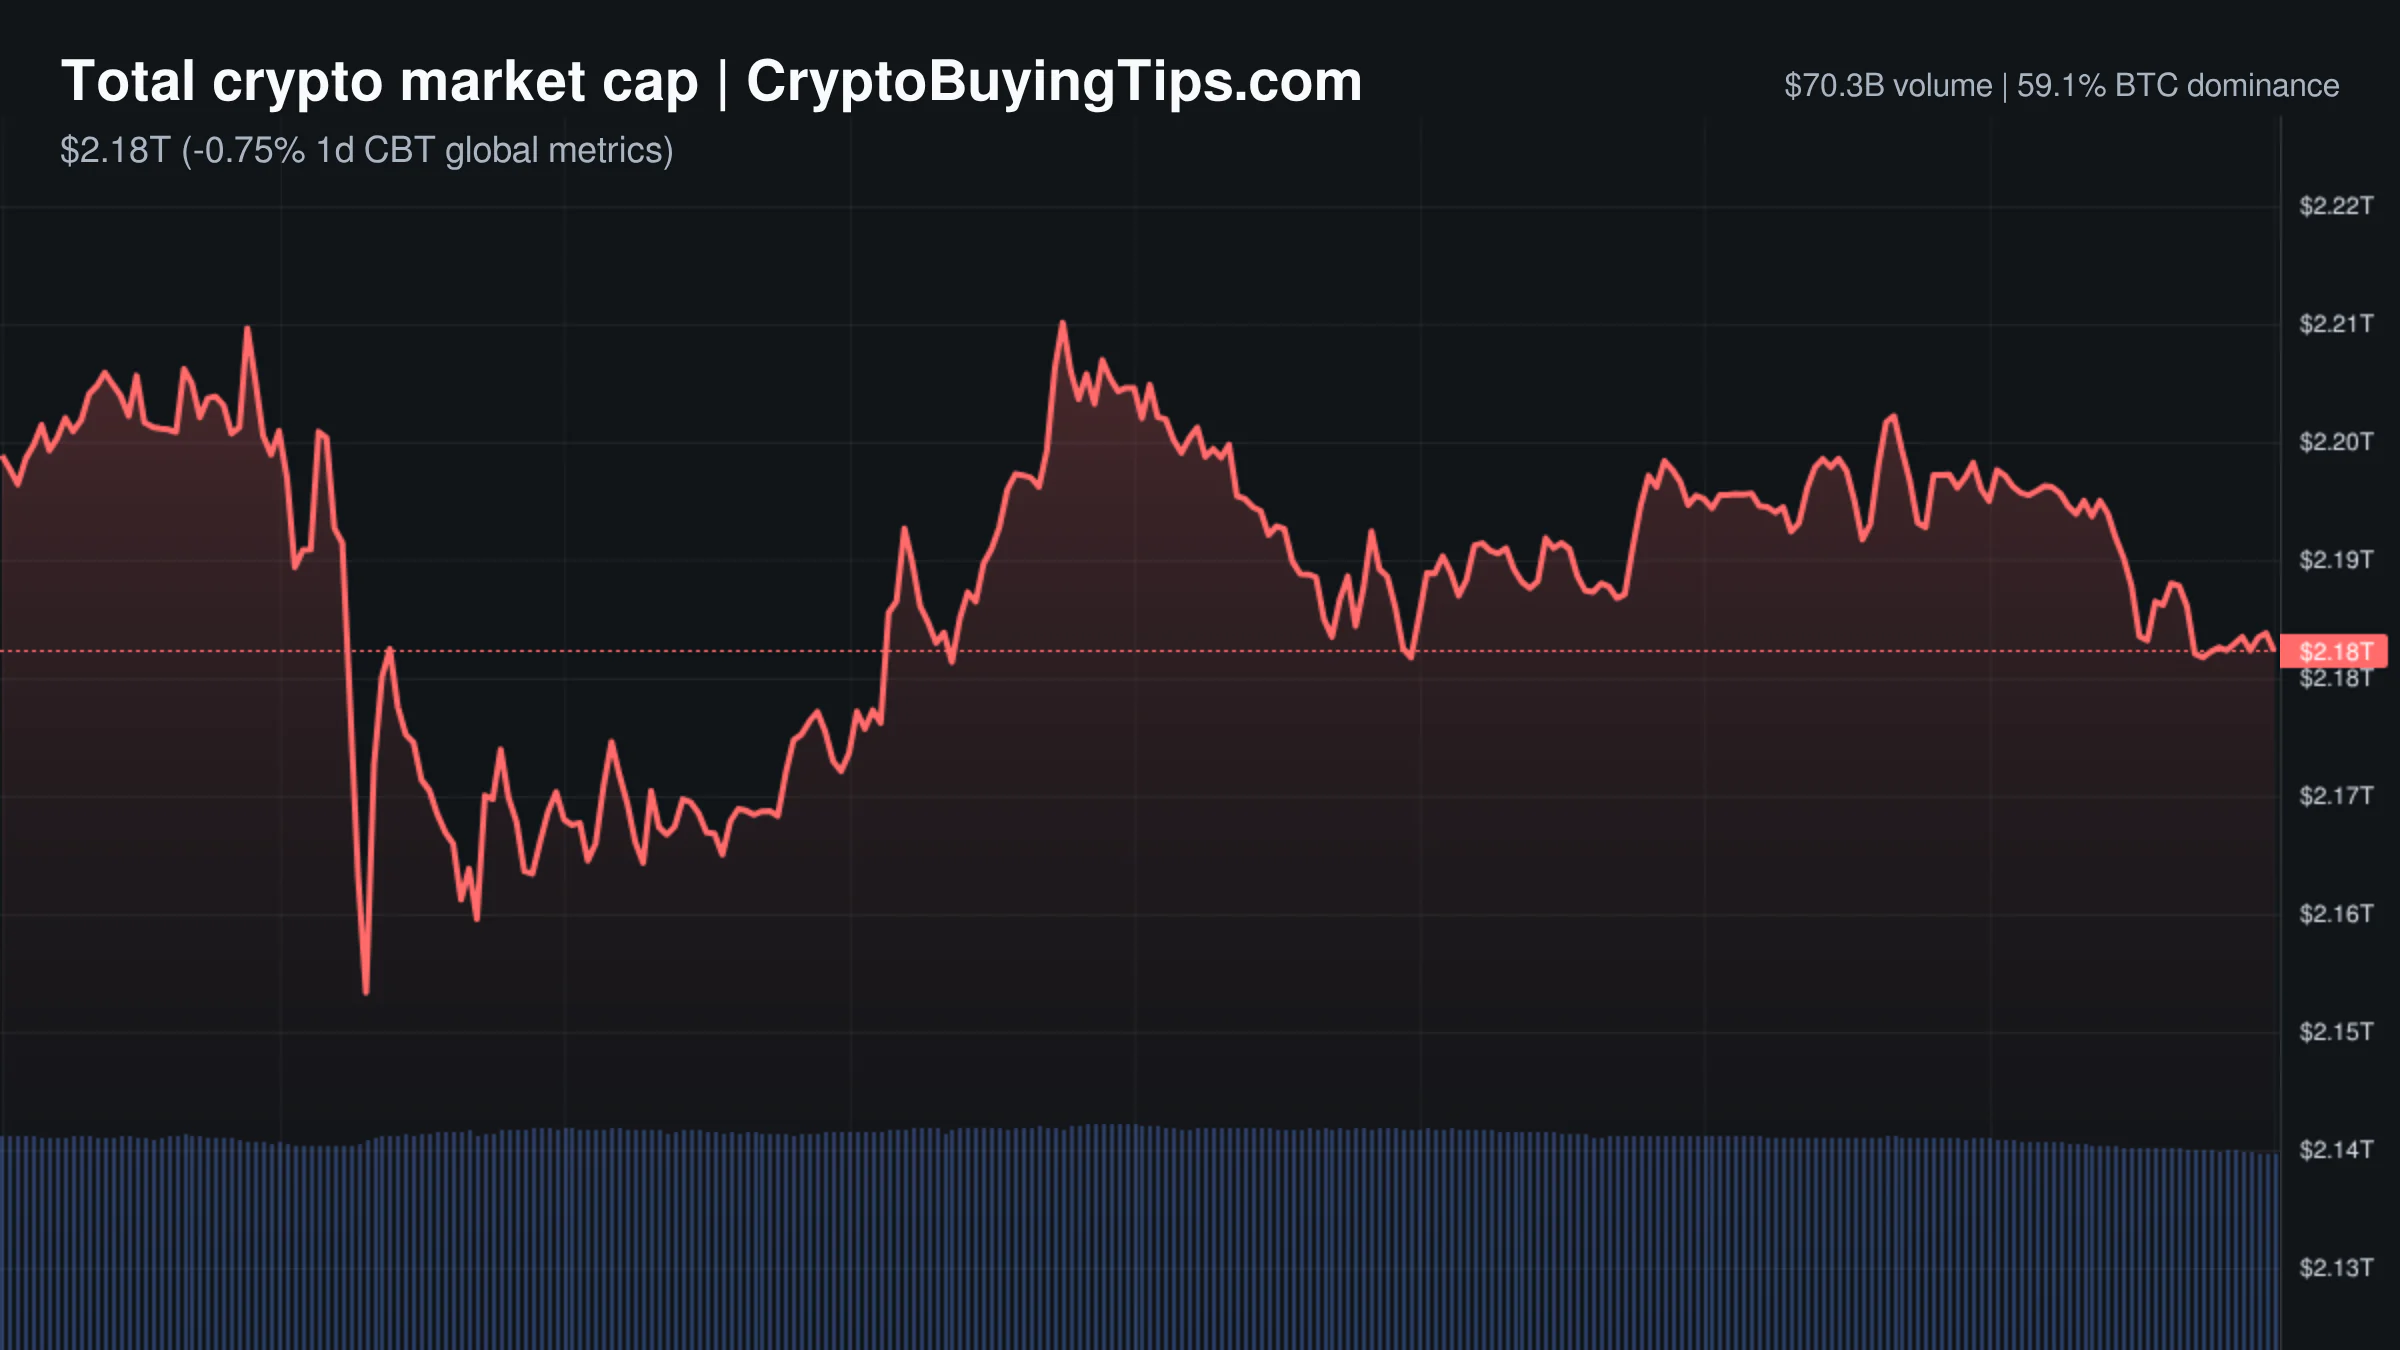
Crypto Market Overview | Extreme fear and heavy derivatives leverage as spot volume declines and Bitcoin tracks risk assets | November 18, 2026
Bitcoin trades near $64,190 amid extreme fear as spot volume declines. Derivatives volume is up 9.03%, showing heavy…

Are crypto perpetual futures legal in the US? The CFTC just licensed two venues to find out
The CFTC has finally decided that crypto perpetual futures are legal in the US, provided you use a licensed venue. It is…

What is implied volatility in crypto? ETH's reads 13.8 points hotter than Bitcoin's
Price charts are just yesterday's weather reports. Implied volatility offers a look at what traders are actually betting…