Market Overviews

Daily crypto market overviews, trend analysis, and key updates from our editorial team.

Crypto Market Overview | price stability amid volume collapse and high fear index readings | July 5, 2026
Sigrid Voss·

Crypto Market Overview | price stability amid volume collapse and high fear index readings | July 5, 2026

Market overview

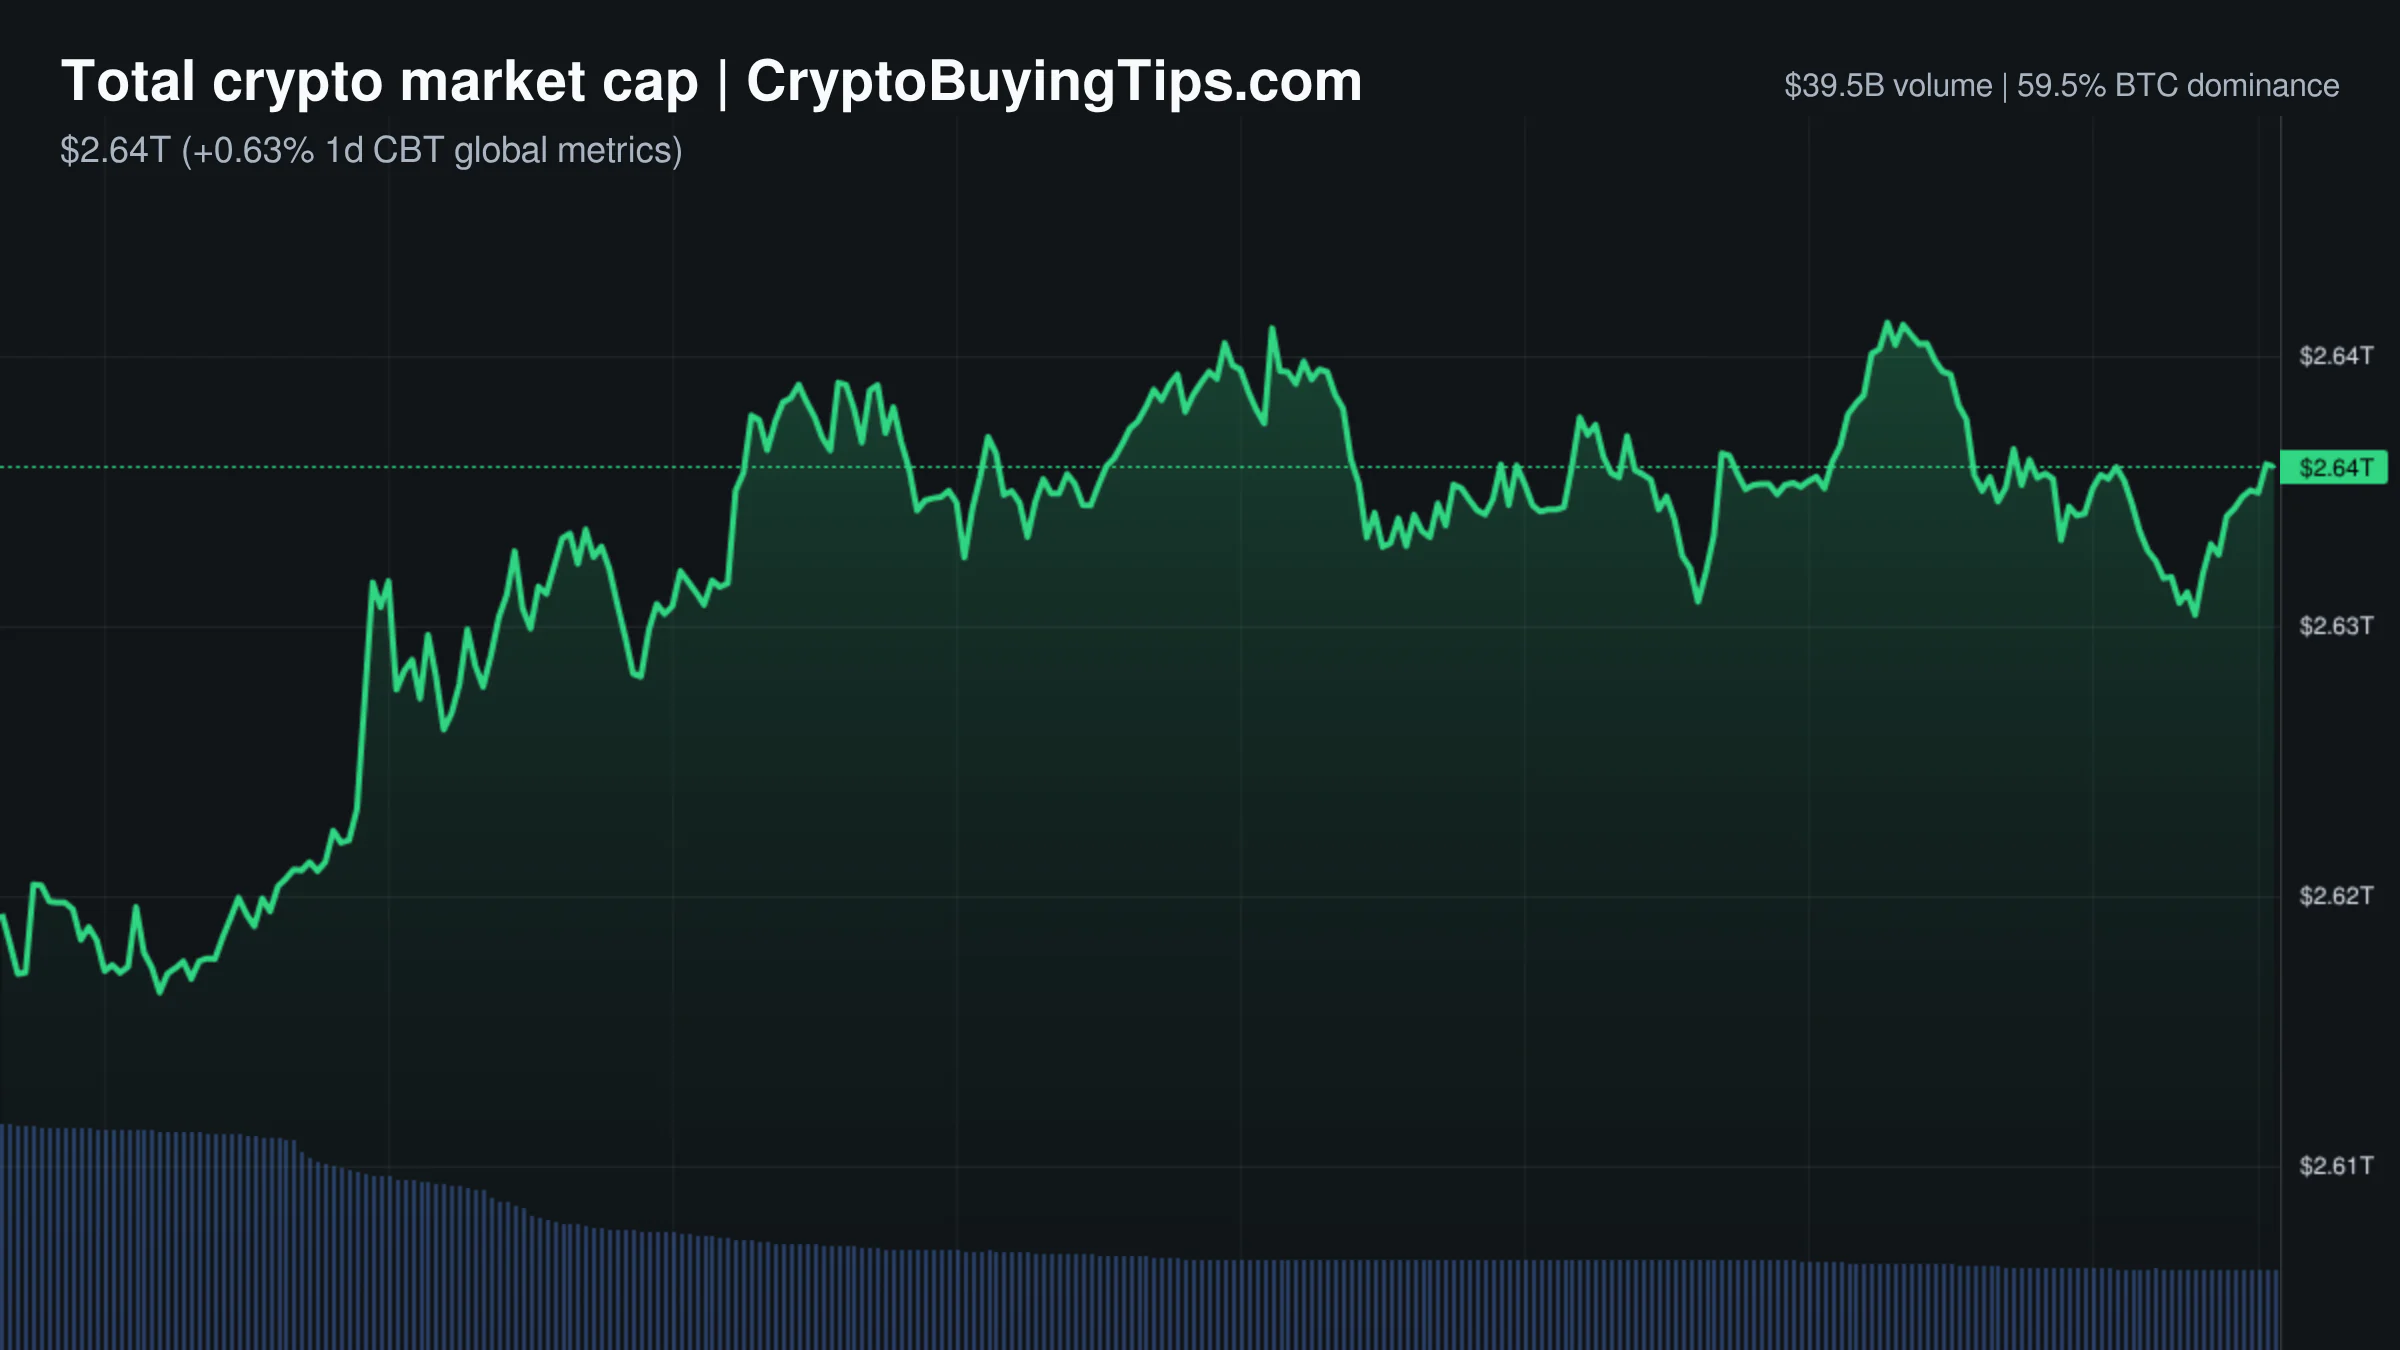
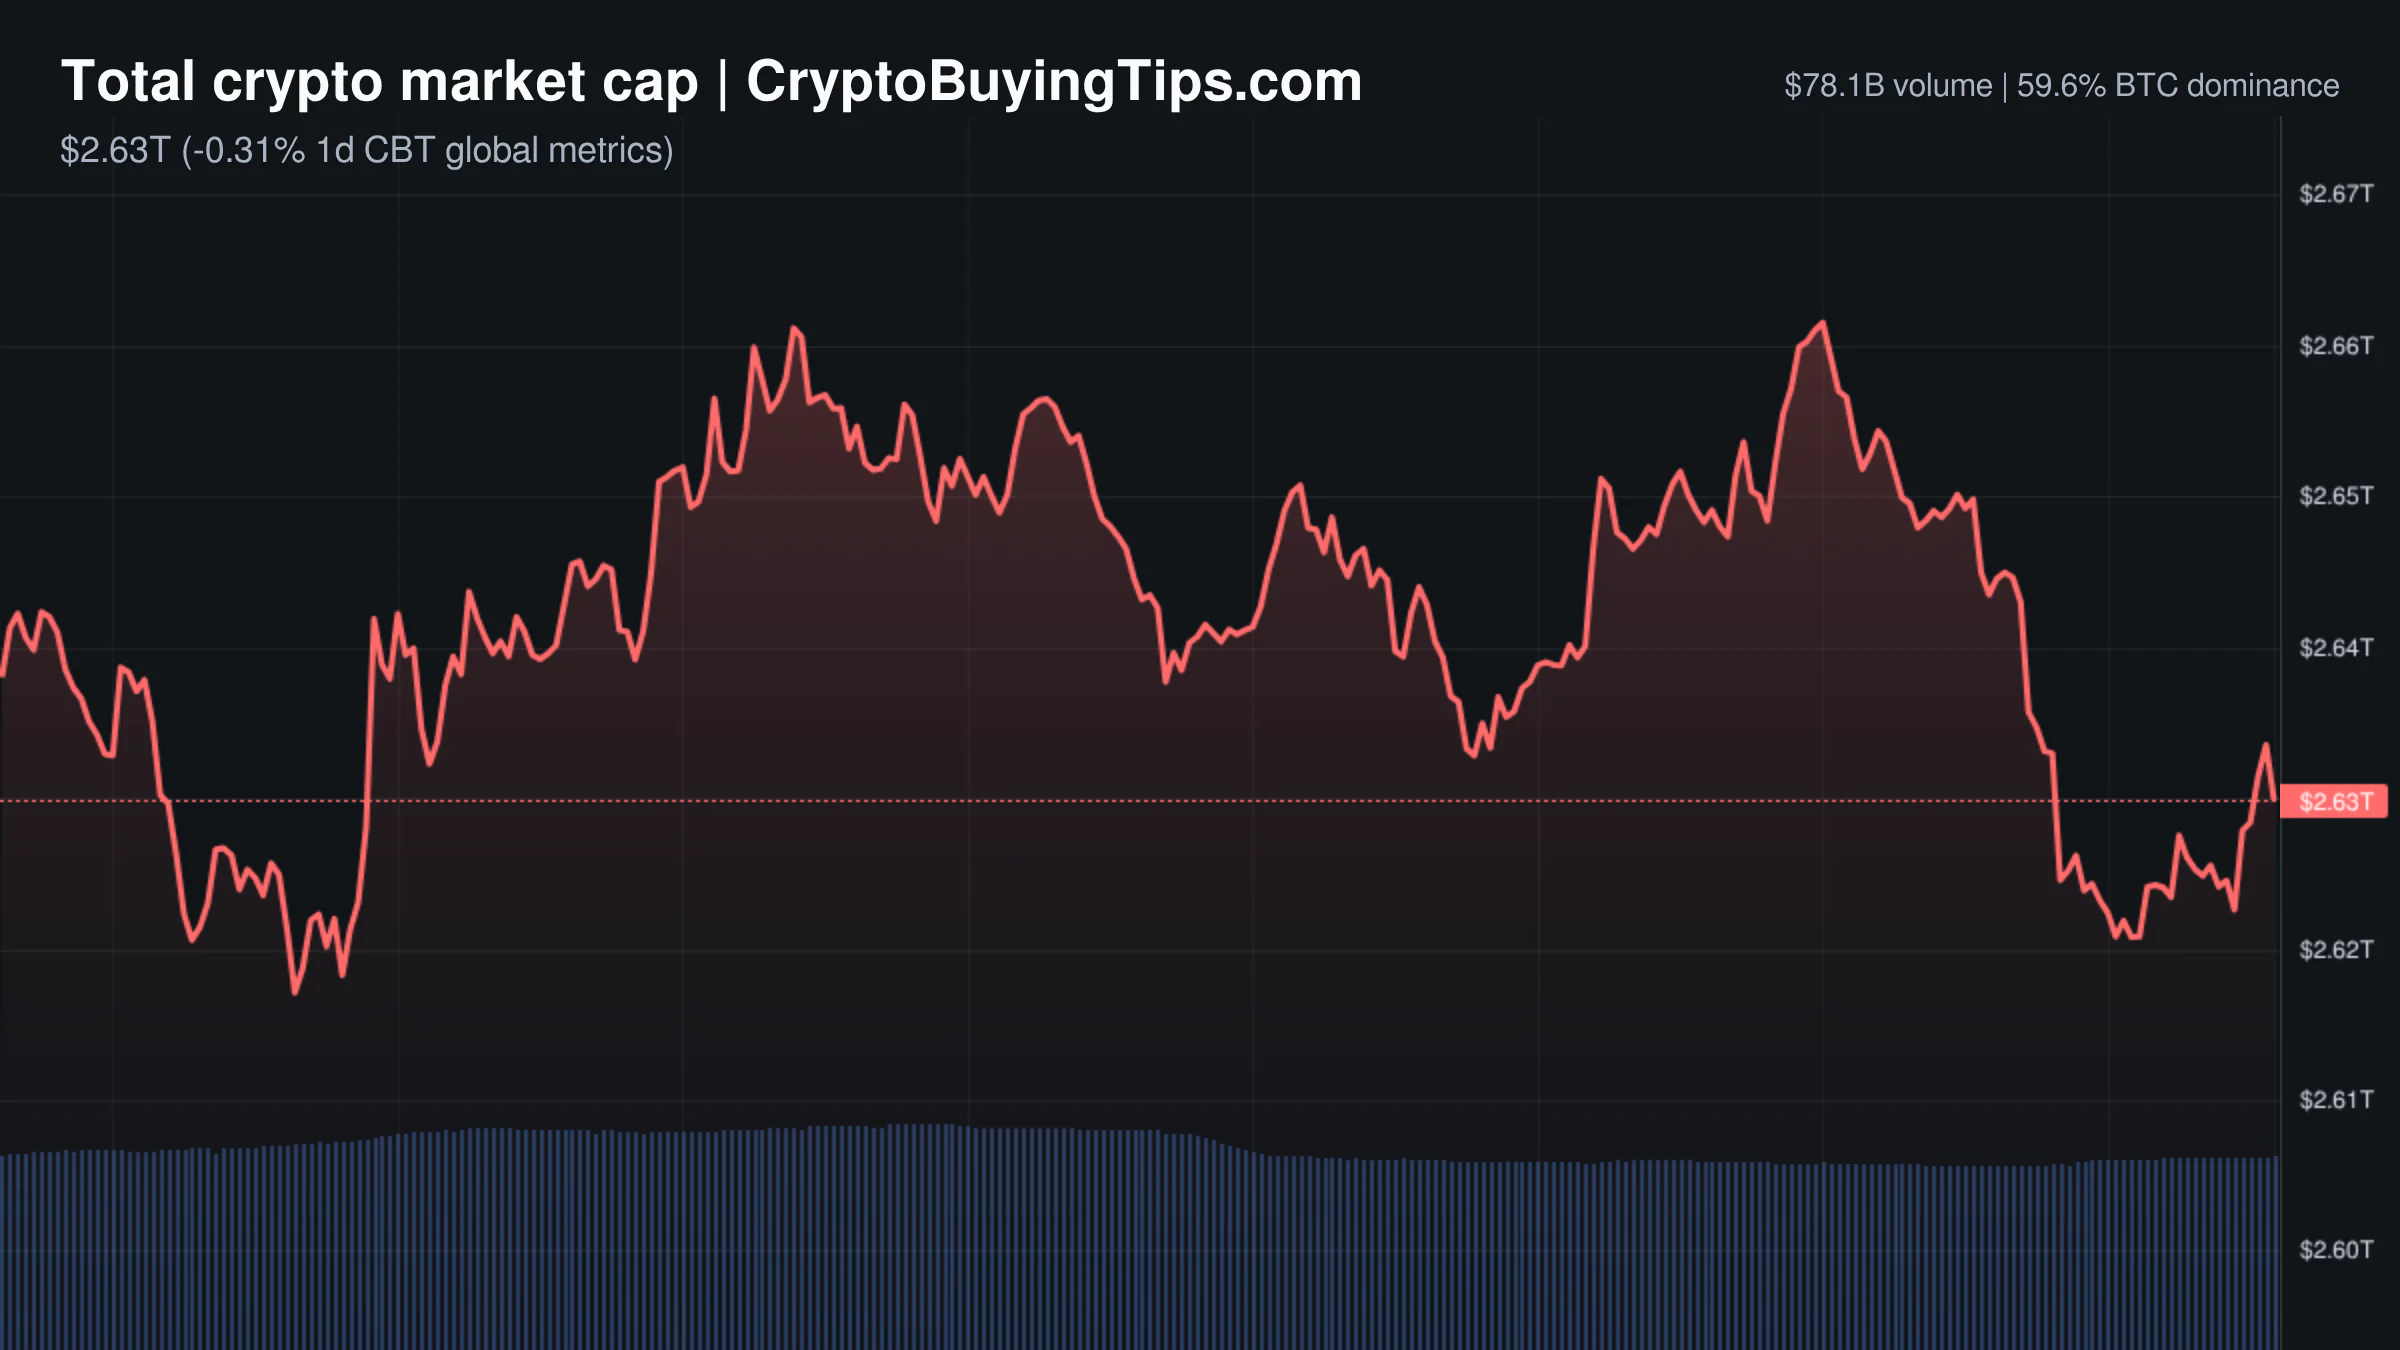
The market is currently presenting a confusing set of contradictions. On the surface, prices are holding steady or ticking slightly higher, but the plumbing suggests a different story. Total market capitalization sits at $2.17 trillion, a marginal increase of 0.07 percent. However, this price stability is happening on a backdrop of a significant volume collapse. Spot volume has dropped by 8.57 percent, derivatives volume is down nearly 10 percent, and stablecoin activity has fallen by almost 11 percent. We are seeing a market that is not so much bullish as it is exhausted.

The sentiment gap is the most striking feature of the day. The Fear and Greed Index has plummeted to 26, placing the market firmly in the Fear zone. Usually, this level of fear accompanies a violent price crash. Instead, we have a sideways market where the indices are slightly positive. This divergence suggests that while the crowd is anxious, there is no aggressive selling pressure to actually drive prices down. It is the kind of atmosphere where traders wait for a catalyst that never arrives, resulting in a deadening of liquidity.

The leverage picture remains skewed. Derivatives volume at $459.33 billion is roughly 8.3 times higher than spot volume. This concentration of leverage means that any sudden move in either direction could trigger a cascade of liquidations, regardless of the current lack of momentum. With the S&P 500 and NASDAQ both closing in the red, the macro environment is offering little support for a risk-on rally. The market is essentially holding its breath.

Bitcoin and Ethereum

Bitcoin is trading at $62,693.53, up a modest 0.34 percent. The price action is unremarkable, but the on-chain data is more interesting. Social intelligence indicates that the realized profit and loss ratio has hit a 43-month low. Historically, this metric has often flagged major market bottoms. If that pattern holds, the current stagnation might be the final stage of a long consolidation before a new leg up. Bitcoin dominance remains high at 57.99 percent, which confirms that capital is staying in the safest asset while the rest of the market struggles to find a narrative.

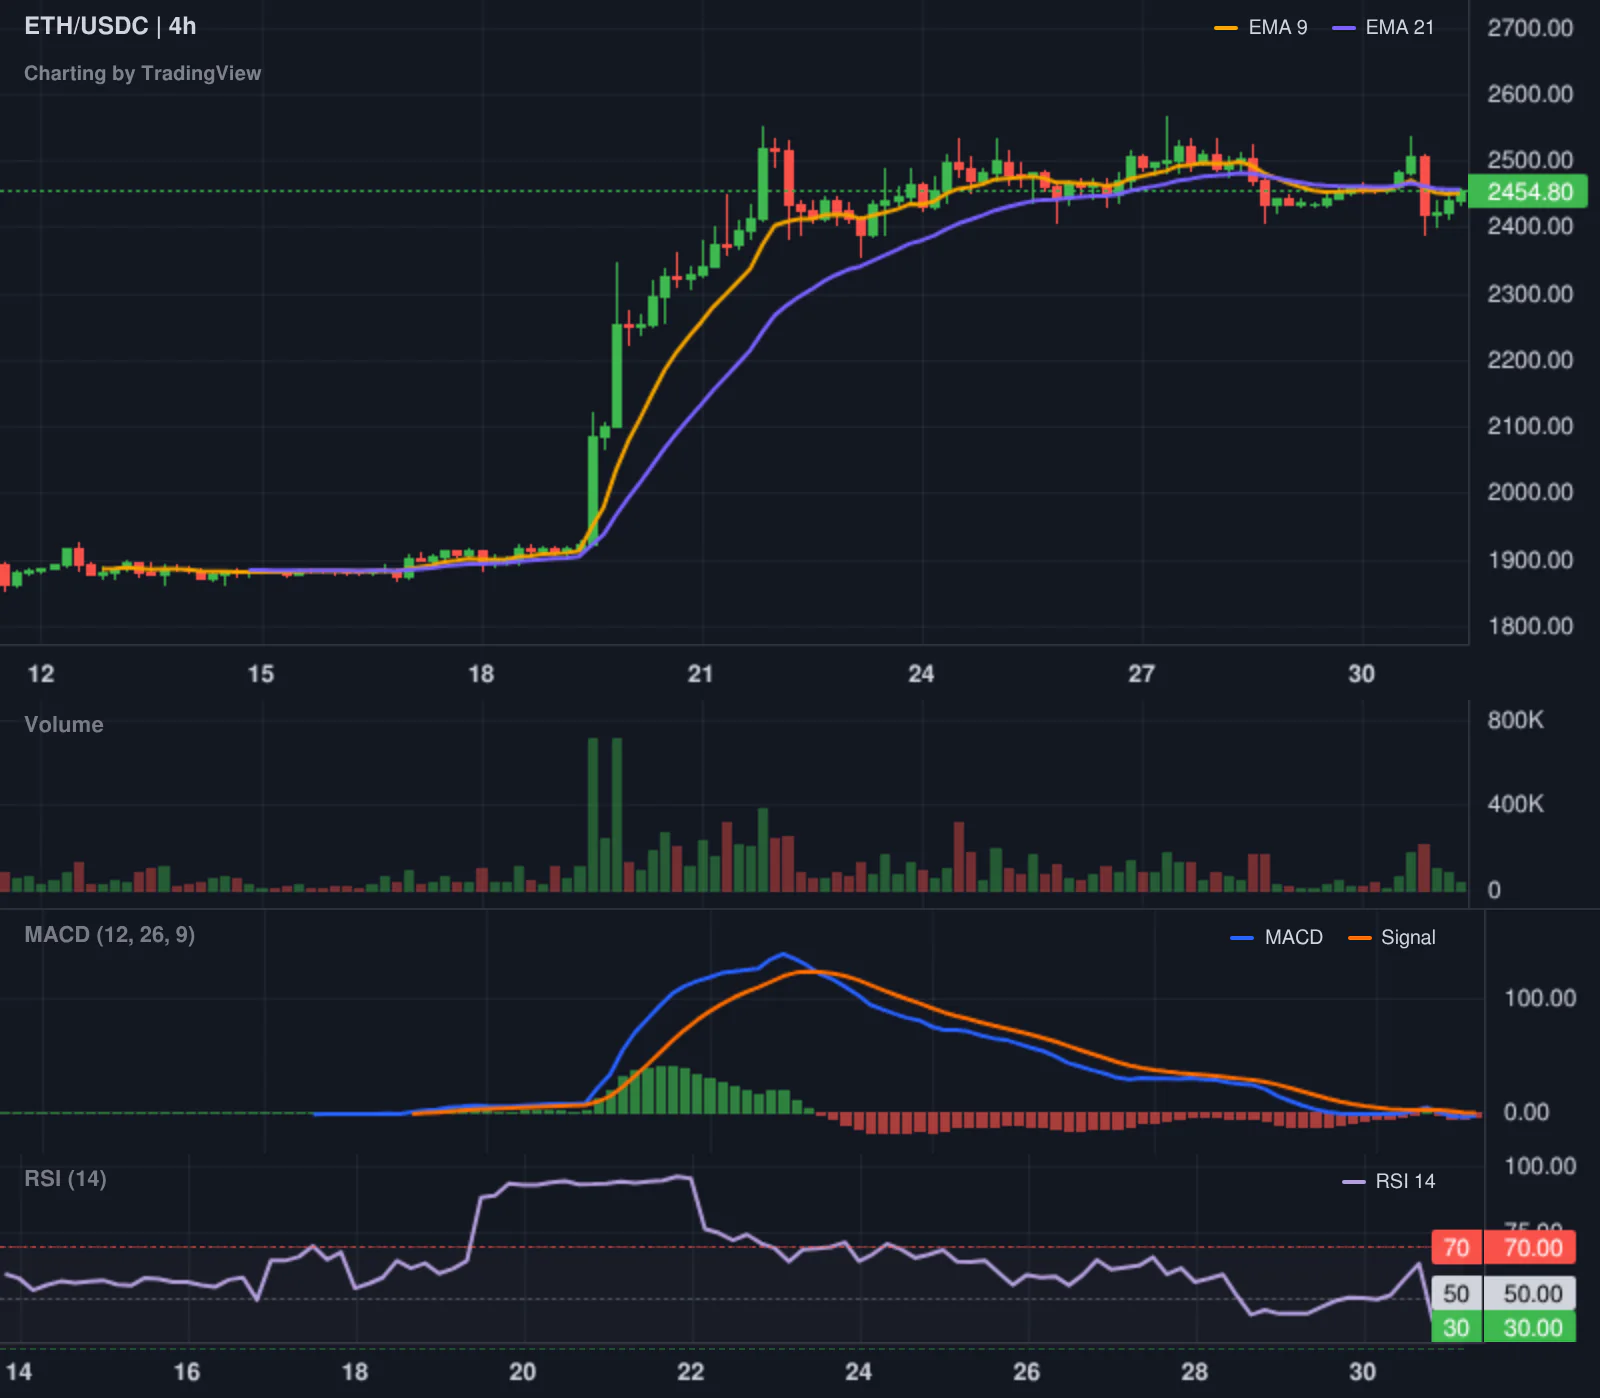
Ethereum is far less convincing, hovering at $1,759.47. While the price is technically up 0.06 percent, the network is seeing a strange mix of signals. Gas fees are exceptionally low, between 0.09 and 0.15 Gwei, which suggests a lack of on-chain congestion and a general absence of retail activity. At the same time, we are seeing a massive surge in ETH withdrawals from Binance, which have hit a three-year high.

This exodus from centralized exchanges often suggests that whales are moving assets into cold storage or preparing for a specific protocol event. Vitalik Buterin has shared a roadmap for a Lean Ethereum, which targets native STARKs and quantum resistance over the next few years. While these technical ambitions are high, they do not provide immediate price support. We previously covered how Ethereum market share vanishes as it attempts to pivot toward institutional needs, and today's price action suggests that the corporate makeover is not yet translating into buying pressure.

Top crypto prices

Beyond the two giants, the performance across the top assets is mixed. BNB is one of the few bright spots, trading at $575.53 and gaining 0.75 percent. It seems to be benefiting from a specific accumulation phase that is decoupled from the broader market fear. TRX is essentially flat at $0.3252.

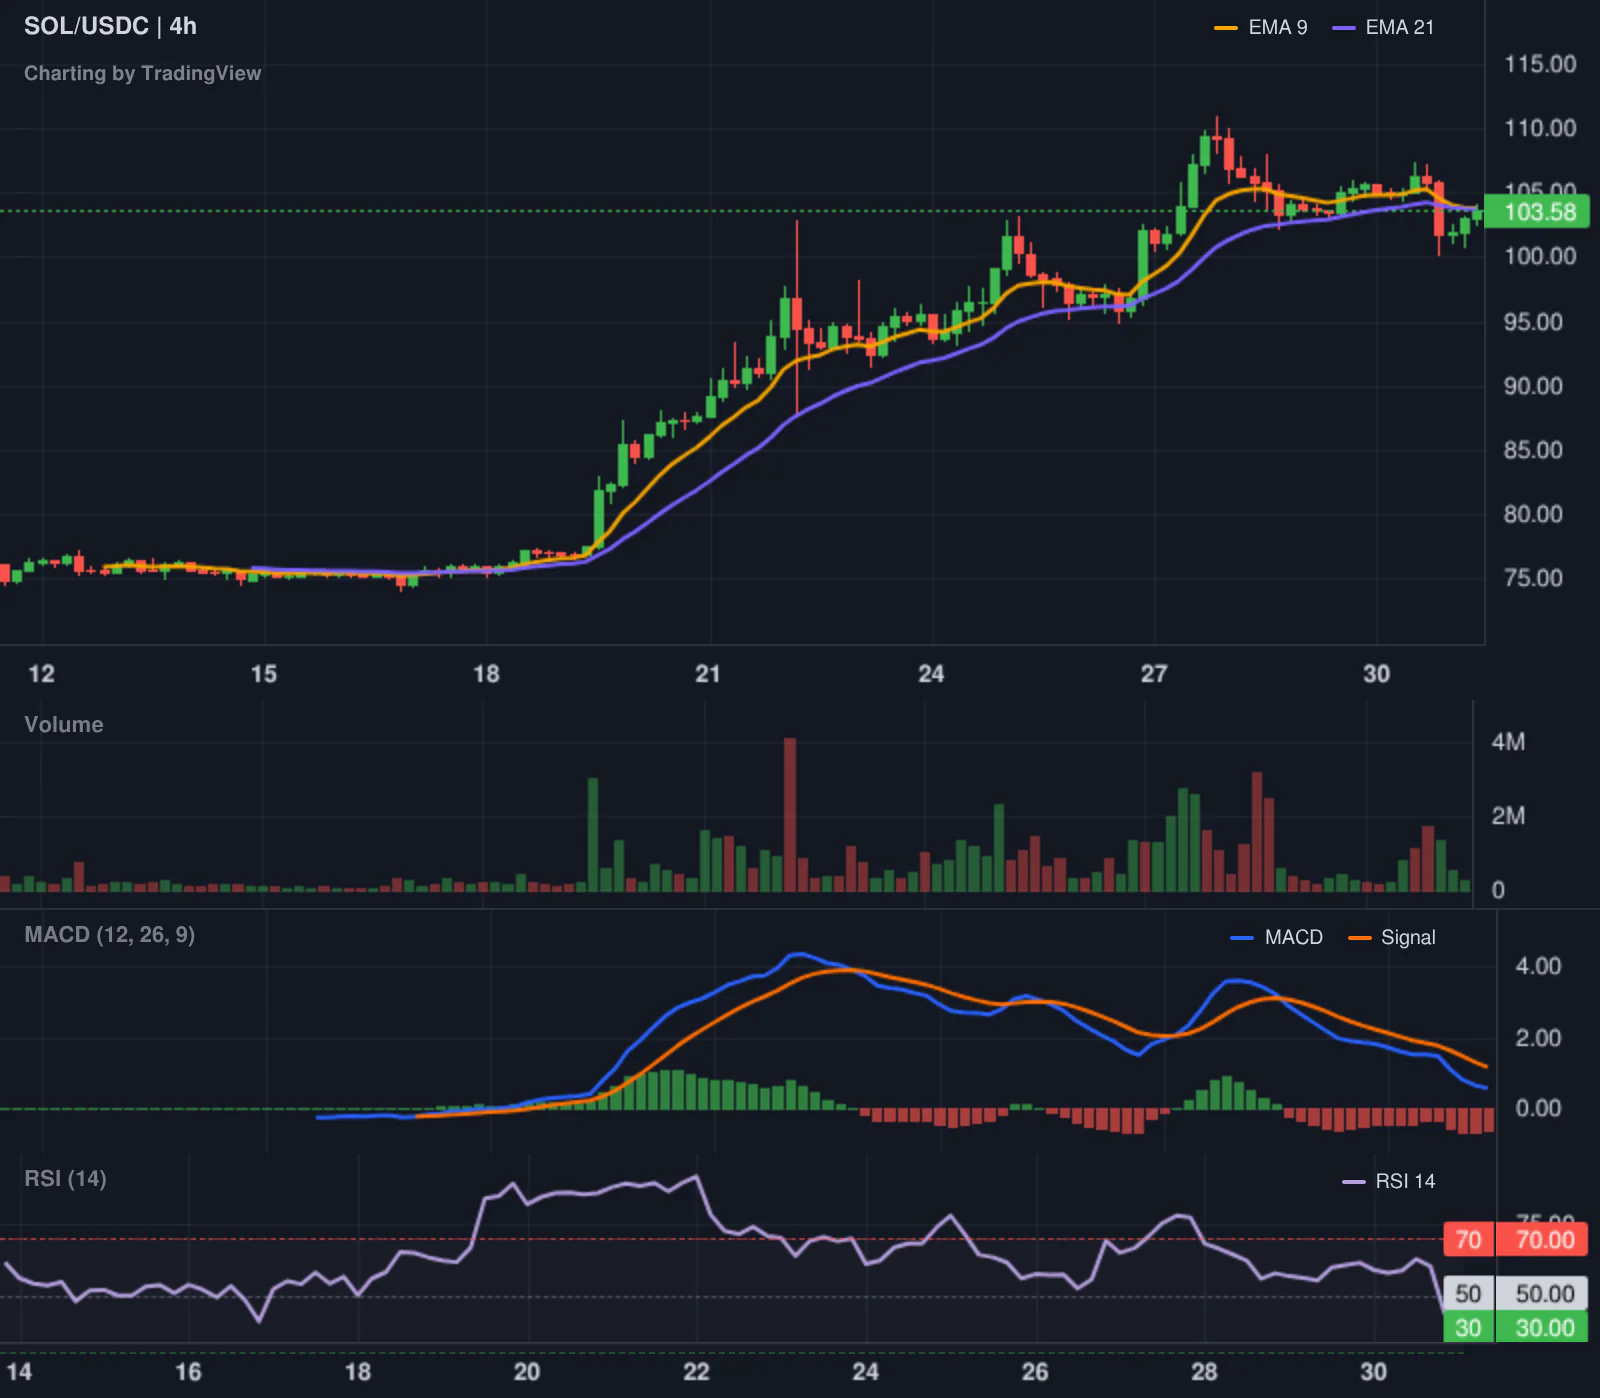
The losses are concentrated in the high-beta assets. Solana has slipped 1.53 percent to $80.34, while Hyperliquid has fallen 2.46 percent to $68.98. XRP is also in the red, down 1 percent to $1.12. This trend is typical for a Fear-dominated environment; when the crowd gets nervous, they sell the assets that rose the fastest first.

News driving today's market

Regulatory friction is the primary theme of the week. Revolut has notified users that it will delist USDT in August, citing regulatory and risk concerns. This is a blow to the ease of on-ramping for many retail users and adds to the general uncertainty surrounding stablecoin compliance. We have seen this pattern before, and we previously explained how Mica crypto regulation explained is forcing a cull of non-compliant assets across Europe.

Systemic risk is also back in the conversation. Ethical hackers discovered a flaw in the Aptos blockchain that could have put $70 billion at risk. Although the vulnerability was patched, the fact that a $3,000 server was enough to simulate a successful attack on a major layer-1 is a sobering reminder of the fragility of these systems. This news tends to push traders toward more established protocols and away from the newer, more experimental chains.

In the EU, regulators are moving to block retail investors from prediction markets, arguing that the actual function of a product as a derivative matters more than its label. This is a direct hit to a growing sector of DeFi and signals that the era of regulatory forbearance is over. Conversely, the UK is attempting to unlock global trading with a new framework, though the compliance hurdles remain daunting. The market is currently weighing the UK's openness against the EU's tightening grip.

Social intelligence

The on-chain data is providing some contrast to the general fear. Hyperliquid has seen $116 million in net bridged inflows in just 24 hours. This suggests that while the broader market is hesitant, sophisticated traders are moving capital into high-performance DeFi platforms to seek yield or better trading tools.

There is also a significant shift in stablecoin distribution. Ethereum now controls 87 percent of the stablecoin supply. This is a massive structural advantage for ETH as it ensures that the vast majority of liquidity remains within its ecosystem. If the market decides to rotate back into alts, the path of least resistance will likely be through the Ethereum-based assets.

Finally, the Bitcoin realized profit and loss ratio hitting a 43-month low is the most bullish signal on the board. It suggests that a large number of holders are currently underwater, which often happens right before a trend reversal. It is a cold, mathematical indicator that contradicts the emotional fear currently seen in the index.

Trading ideas worth watching

Dogecoin is presenting a high-risk setup for those with a high appetite for volatility. The asset recently pierced below long-term support and is now attempting a recovery. A long position with an entry zone between $0.0730 and $0.0800 targets a move up to $0.0969 and potentially as high as $0.4482 in a full bullish extension. The invalidation point is a weekly close below $0.0720. This is essentially a bet that the bearish cycle has exhausted itself, though the lack of volume in the recent drop makes this a speculative play.

Redrawn XRPUSDT 1D trading idea chart for XRP Re-enters accumulation zone, aims at new all-time highRedrawn DOGEUSDT 3D trading idea chart for Dogecoin—DOGEUSDT 10X LONG with 4,700% profits potential

XRP has re-entered what looks like a five-month accumulation range. After a stop-loss hunt in February, the asset has spent months moving sideways. Bullish momentum has been visible for four consecutive days, and the setup suggests a long-term growth phase starting from the June-July lows. The goal here is a move toward new all-time highs, provided the asset can maintain its current floor.

BNB is showing a more technical setup. It has broken out of a falling wedge pattern, and there is a clear RSI divergence suggesting strength. The asset recently printed a selling climax followed by high-volume accumulation, which is often a sign that smart money is positioning ahead of a move. Resistance is currently at 664, with a further target of 729 if the momentum sustains.

What to watch next

The immediate future depends on whether the volume collapse is a temporary lull or the start of a deeper liquidity drain. Price stability in the face of extreme fear is often a sign of a bottom, but without a surge in volume, it is just a stalemate. We are watching the $62,000 level for Bitcoin and the $1,750 level for Ethereum as the critical lines in the sand.

If the Revolut delisting of USDT triggers a wider move away from centralized stablecoin gateways, we could see an increase in volatility as traders scramble for alternative liquidity. The tension between the UK's optimistic framework and the EU's restrictive approach will likely define the institutional flow for the rest of the month. For now, the market is in a state of professional paranoia, where the data suggests a bottom but the mood suggests a crash.

Crypto Market Overview | relief rallies meet volume collapse amid institutional inflows and regulatory uncertainty | July 4, 2026
Sigrid Voss·

Crypto Market Overview | relief rallies meet volume collapse amid institutional inflows and regulatory uncertainty | July 4, 2026

Market overview

The crypto market is currently presenting a strange paradox. Prices are ticking higher, but the actual activity suggests a ghost town. Total market capitalization sits at $2.25T, up slightly by 0.89%, yet trading volume has collapsed. Spot volume is down 26.03%, and derivatives volume has fallen by 26.66%. This is a low-conviction environment. We see a relief rally occurring while the Fear and Greed Index remains stuck at 25, firmly in the Fear zone.

This divergence is telling. Usually, a price bounce accompanied by a volume drop suggests a lack of aggressive buying. It is more of a technical correction than a fundamental reversal. Bitcoin dominance is high at 55.63%, which means the limited capital returning to the market is flowing into the safest bet rather than venturing into altcoins. Stablecoin dominance at 11.42% shows that a significant amount of capital is still sitting on the sidelines, waiting for a reason to enter.

The macro backdrop adds to the tension. The NASDAQ is down 1.73%, suggesting a risk-off mood in tech that usually bleeds into crypto. The fact that crypto is slightly green while the NASDAQ slides is an interesting anomaly, but the volume collapse suggests this decoupling is fragile.

Bitcoin and Ethereum

Bitcoin is trading at $62,481.48. The primary catalyst for the current stability is a return of institutional interest. Spot BTC ETFs saw a $221 million inflow on July 2, snapping a ten-day losing streak that had drained $2.7 billion. This institutional bid is providing a floor, but it is not yet enough to spark a full trend reversal.

Ethereum is at $1,758.49, up 0.85%. The outlook for ETH is less convincing. Dominance has slipped to 9.42%, and on-chain activity is nearly non-existent. ETH gas fees are at a negligible 0.07 Gwei. This level of network stagnation is worrying for a protocol that claims to be the foundation of decentralized finance. We previously covered how Ethereum market share vanishes as it attempts a corporate rebranding, and today's data suggests that the institutional PR is not yet translating into network usage.

Top crypto prices

The top assets are showing a general, if sluggish, recovery. Bitcoin leads at $62,481.48. Ethereum follows at $1,758.49. BNB is trading at $571.27, up 1.05%. XRP has seen a more notable jump of 2.76% to reach $1.13.

Solana remains flat at $81.53. TRON is up 1.64% at $0.3250. Hyperliquid is performing well, trading at $70.68, a 2.46% increase.

News driving today's market

The political theater in the US is providing a weird mix of bullish and bearish signals. President Trump recently disclosed a $1.4 billion crypto windfall from 2025. His insistence that there is nothing wrong with profiting from crypto ventures while in office is a signal to the market that the administration is deeply embedded in the industry. For some, this is a bullish sign of regulatory capture. For others, it is a red flag for ethics.

However, this has triggered a counter-reaction. Senator Kirsten Gillibrand is now calling for a ban on elected officials issuing memecoins. This is a direct hit to the speculative side of the market. If the US government begins banning specific asset classes like memecoins for officials, it could lead to broader restrictions on how these tokens are marketed to the public.

In Europe, the regulatory noose is tightening. The transition period for MiCA has ended. Crypto firms without authorization can no longer legally serve EU clients. The costs of compliance are high, with some estimates ranging from 350,000 to 600,000 euros. This creates a period of high uncertainty as firms either wind down or face fines starting at 5 million euros. Simultaneously, ESMA has warned that prediction market event contracts may be banned for retail investors, as they often fall under binary options restrictions.

These regulatory headwinds contrast with the ETF data. The $221 million inflow into Bitcoin ETFs suggests that while the regulators are fighting the "casino" side of crypto, the institutional "vault" side is still open for business. We previously noted that the volume data suggests fight between bullish narratives and actual trading activity, and today's 26% drop in volume confirms that the fight is currently a stalemate.

Social intelligence

On-chain data and social feeds are highlighting systemic risks. The US money supply has hit a record $23T. This is a massive amount of liquidity that eventually seeks a home in risk assets, but it also signals the ongoing erosion of fiat confidence. This is mirrored by the fact that central banks are stacking gold at record levels. When the world's bankers buy gold, it usually means they expect a storm.

In the whale world, the focus is on individual windfalls. Analyst @lookonchain noted that trader Ansem's portfolio grew by $193M in a single week due to $ANSEM. This is the typical "lottery" narrative that keeps retail interested even when the broader market is stagnant.

From a protocol perspective, the OUSD stablecoin is expanding, with the Polygon Foundation CEO announcing its arrival on Polygon. However, this is clouded by reports that Samsung and Dunamu were listed as consortium members without being consulted. This suggests a lack of professionalism in the governance of some of these new stablecoin initiatives.

Trading ideas worth watching

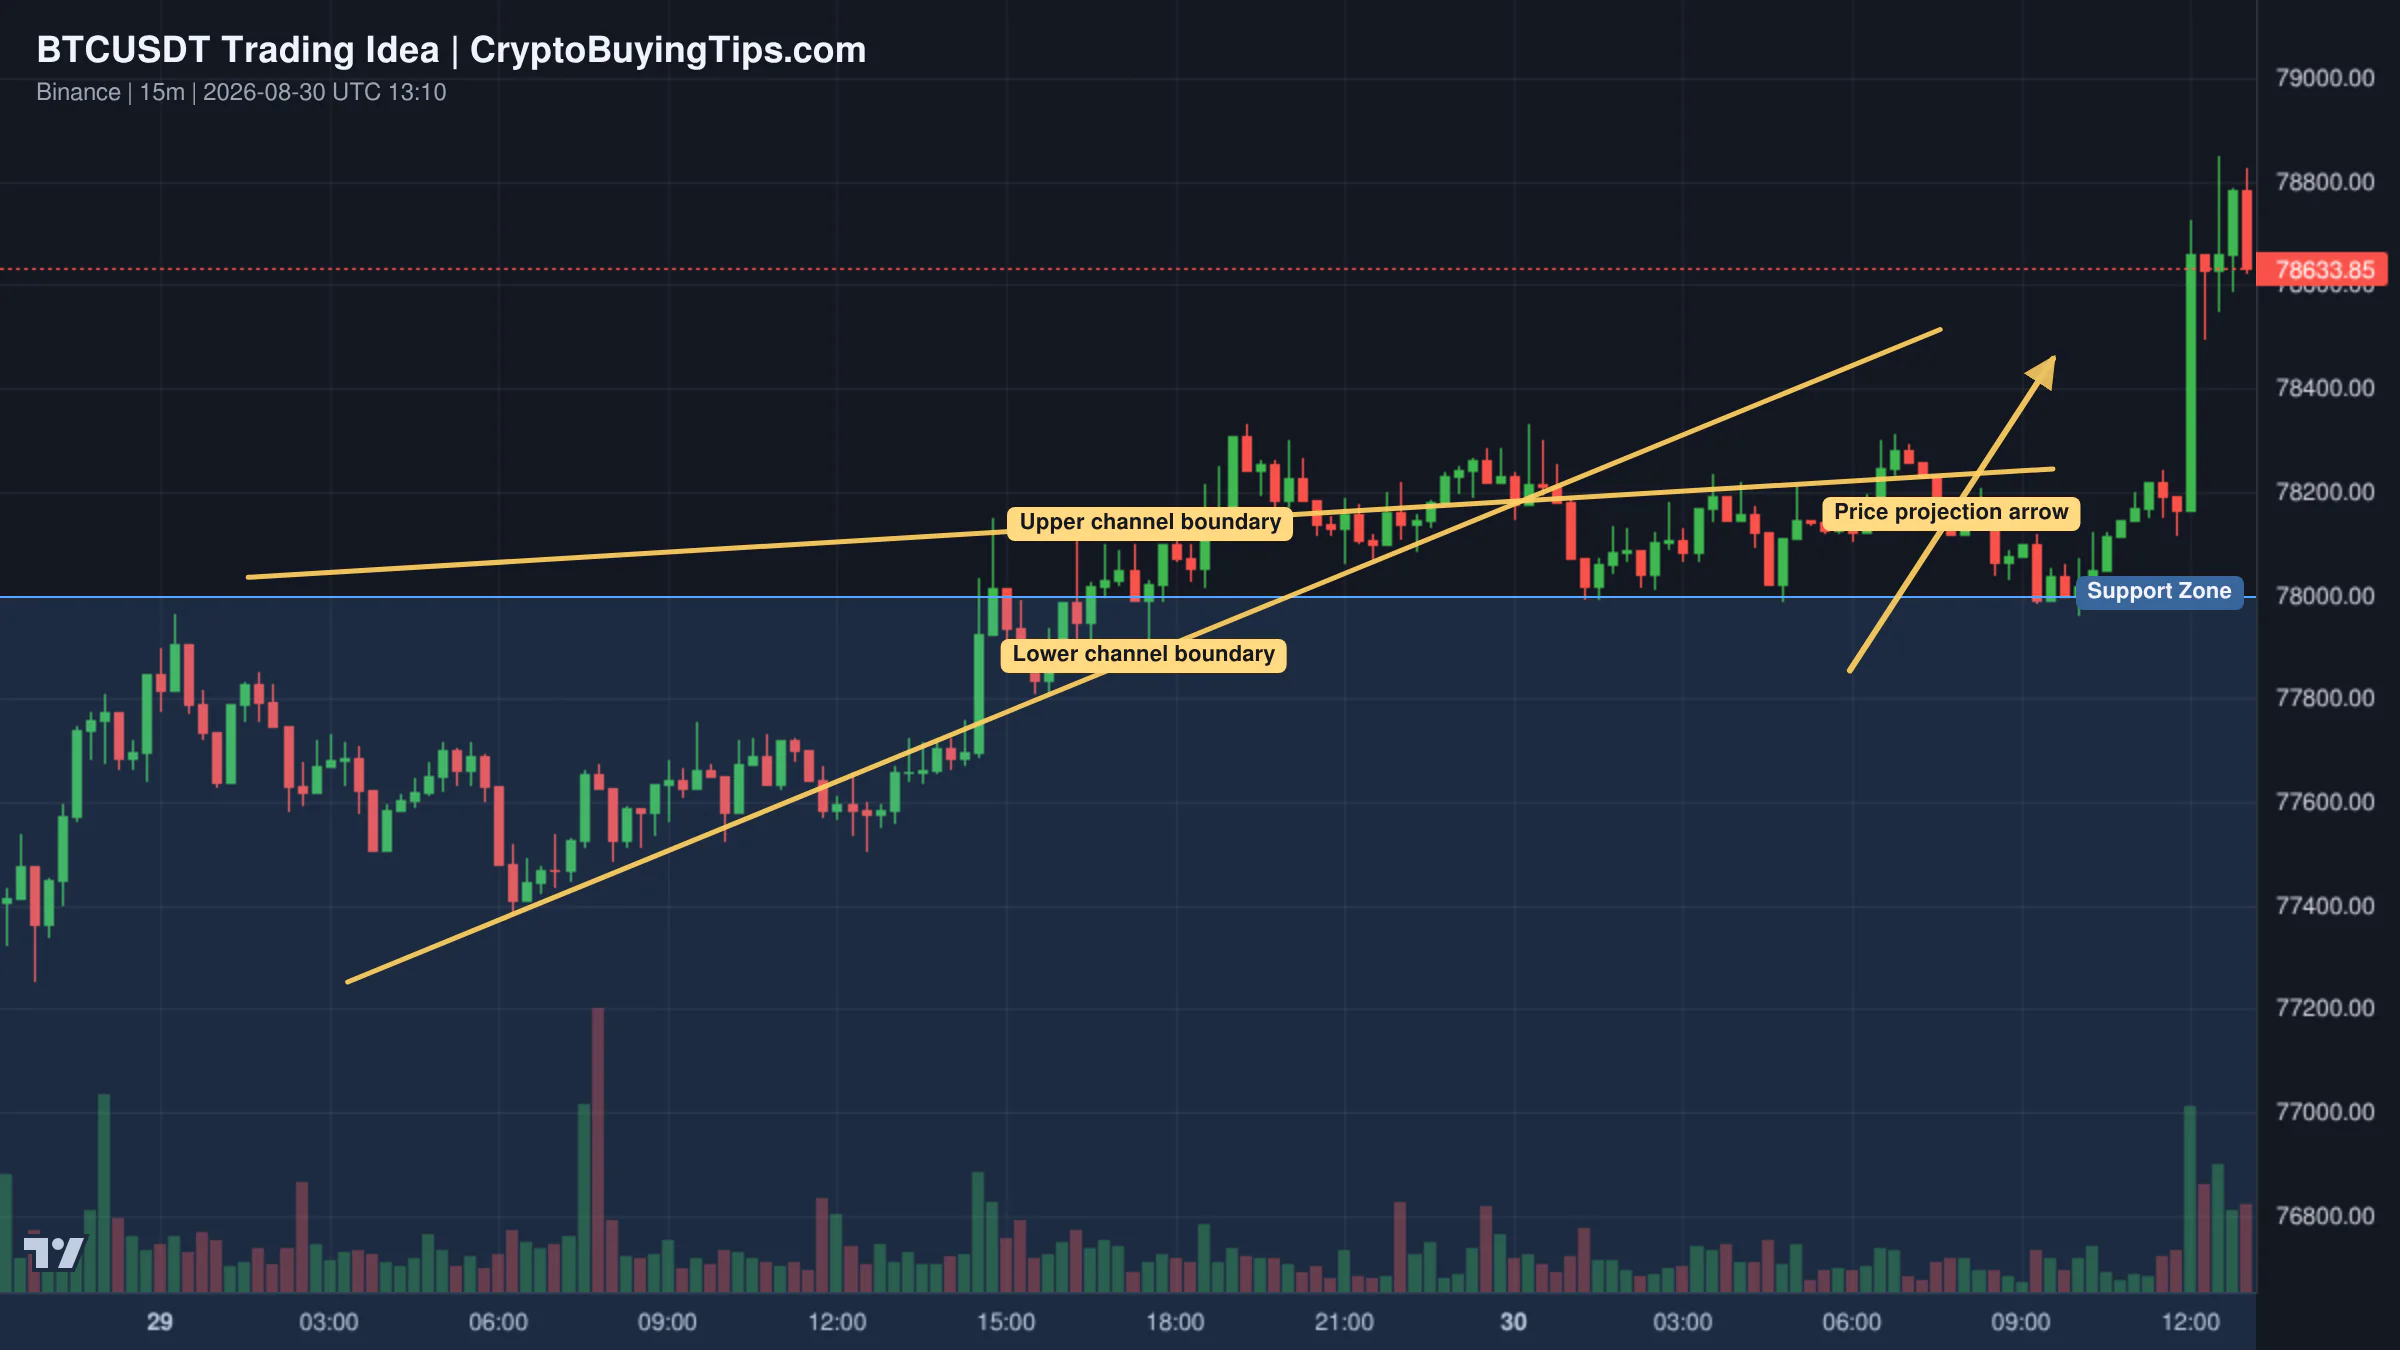
There is a sharp divide in Bitcoin analysis today. One bullish setup focuses on the support zone between $60,700 and $61,000. The read is that as long as this area holds, the path is open to $63,000 and $65,000. This is a short-term momentum play based on the recent rebound from the multi-year lows.

Trading idea chart: BTCUSD - BITCOIN The H&S blueprint that targets $50000.Redrawn BTCUSDT 240 trading idea chart for Bitcoin Holding Strong Support – Bulls Eye $63K and $65K

Conversely, a long-term bearish view suggests a Head and Shoulders pattern that mirrors the 2021-2022 crash. This analysis points to a target of $50,000, arguing that the current break below the weekly MA200 is a signal of a larger cycle bottom. The conflict between these two views is the essence of the current market. We have a short-term ETF-driven bid fighting a long-term structural decline.

For those looking at altcoins, Cardano is showing signs of a long-term recovery. After a brutal bearish cycle since 2021, ADA is now trading within a long-term support zone. The analysis suggests that a bottom was formed in June 2026, and the asset is now flipping old resistance into support. This is a slow-burn recovery play rather than a quick trade.

Smart Money Signals — Hyperliquid Leaderboard

Hyperliquid LONG BTC leaderboard chart

Our tracker for the Hyperliquid leaderboard shows a high-conviction move from a top trader. A wallet with a 13,829% 30-day ROI opened a long position in Bitcoin at $60,428. The notional value of the trade was $380,093. This entry point is well below the current price, suggesting the "smart money" was comfortable buying the dip before the relief rally began.

Altcoin Spotlight

Hyperliquid deserves a mention today. It has climbed into the top 10 by rank and is up 2.46% to $70.68. While most of the market is drifting, HYPE is maintaining strength. This reflects a broader trend where users are moving away from stagnant legacy chains and toward high-performance derivatives platforms that actually have a working product.

What to watch next

The market is in a fragile state. The relief rally is happening on low volume, which is the opposite of what you want to see for a sustainable bull move. We need to see if the ETF inflows can continue for another week or if they were just a momentary blip.

The MiCA enforcement phase will be the next big catalyst for the European market. We expect to see a wave of exits or fines as non-compliant firms are forced out. This could lead to a temporary drop in liquidity for EU-based traders.

Finally, keep an eye on the $61,000 level for Bitcoin. If that support fails, the "relief rally" will be remembered as a bull trap, and the path to $50,000 becomes much more likely. For now, the market is simply holding its breath.

Crypto Market Overview | price gains diverge from deep fear and falling volume | July 3, 2026
Sigrid Voss·

Crypto Market Overview | price gains diverge from deep fear and falling volume | July 3, 2026

Market overview

The market is currently performing a curious act of contradiction. On the surface, the numbers look mildly positive. The total crypto market cap sits at $2.23T, and the CMC20 and CMC100 indices are both up nearly 2%. Yet, the internal plumbing tells a different story. Trading volume is falling across the board, with spot and derivatives activity seeing double-digit percentage declines. This is the kind of rally that happens when there are simply no sellers left, rather than a surge of aggressive buyers.

The most glaring irony is the sentiment gap. The Fear and Greed Index is at 23, a reading of deep fear. Usually, this level of panic is accompanied by a price crash. Instead, we have prices drifting higher while the participants remain terrified. This divergence suggests a market in a state of fragile equilibrium. Capital is not flowing in with conviction; it is merely idling.

Liquidity is also skewed. Derivatives volume dominates the ecosystem at $698.81B, which makes the spot volume look like a rounding error. When the vast majority of activity is based on leverage and the volume is compressing, the risk of a sudden, disorderly move increases. We are seeing a market that is nominally bullish but fundamentally anxious.

Bitcoin and Ethereum

Bitcoin is trading at $61,864.88, up 1.10% over the last 24 hours. It continues to hold the lion's share of the market with a dominance figure between 50.9% and 57.79%, depending on the data source. The price is currently testing a resistance zone between $60,750 and $62,000. While the move is positive, the lack of volume suggests this is not a breakout. It is a slow climb.

Ethereum is the clear outperformers of the day, rising 6.05% to $1,743.66. This jump is likely tied to the flurry of tokenization news hitting the wires. However, the network itself is ghost-town quiet. Gas fees are exceptionally low, with fast transactions costing only 0.23 Gwei. This implies that while the price is rising, actual on-chain activity is not keeping pace.

There is also a notable volatility gap between the two. Ethereum's implied volatility is at 56.06%, significantly higher than Bitcoin's 40.14%. This suggests that traders are pricing in much more violent moves for ETH. It is a high-beta play right now. The market is betting on Ethereum as the primary rail for the new wave of institutional tokenization, even as its overall market dominance remains under pressure.

Top crypto prices

Bitcoin (BTC): $61,864.88 (+1.10%)

Ethereum (ETH): $1,743.66 (+6.05%)

BNB (BNB): $565.35 (+1.79%)

XRP (XRP): $1.1 (+2.72%)

Solana (SOL): $81.31 (+0.05%)

TRON (TRX): $0.3198 (+1.05%)

Hyperliquid (HYPE): $68.98 (+7.37%)

News driving today's market

The narrative of the week is the "corporate makeover" of the blockchain. We are seeing a shift from experimental DeFi to regulated, custodial tokenization. Ondo Finance has launched tokenized versions of BlackRock's IVV ETF and Micron shares. This is not a synthetic wrapper. It uses an SEC-registered transfer agent and a custodial model that fits within the existing U.S. securities system.

Securitize has also made headlines by debuting shares on the NYSE while simultaneously launching tokenized versions of those shares on Solana and Avalanche. This bridges the gap between the world's most famous stock exchange and smart contract platforms. We previously covered how tokenized stocks for investors could change the game, and the data now shows this is moving from theory to production.

At the same time, stablecoins are becoming official banking tools. Standard Chartered and Circle have launched direct USDC minting and redemption for institutions. This removes a massive layer of friction for traditional funds. When a global systemically important bank provides a direct rail to USDC, the "risk" of using stablecoins becomes a boardroom discussion rather than a regulatory nightmare.

However, this institutional polish is a double-edged sword. While it brings in capital, it also strips away the "wild west" appeal. We previously noted that Ethereum market share vanishes as it becomes a corporate utility. The current price jump in ETH reflects the optimism around these RWA (Real World Asset) developments, but it does not yet prove that the network is regaining its dominance.

Social intelligence

The mood on social media is a mix of institutional optimism and whale caution. An SEC official, Brian Daly, mentioned that the agency is building a more orderly ETF approval process. The possibility of confidential filings is the key detail here. This allows institutions to apply for products without tipping off the entire market, which could lead to a series of "surprise" approvals rather than the current public circus.

On the on-chain side, the data is more sobering. A wallet linked to venture capitalist Tim Draper recently deposited 1,000 BTC to Coinbase Prime. While 1,000 BTC is a drop in the bucket for the total market, deposits to exchanges from long-term holders are usually a signal of intent to sell.

There is also a lingering sense of cycle fatigue. Bitwise CIO Matt Hougan suggested that the current volatility reflects end-of-cycle dynamics. He believes the bottom is near and a new bull market will arrive in the fall. It is the classic analyst's hedge: "we are in a mess now, but the future is great."

Trading ideas worth watching

One technical setup for BTCUSDT suggests this current move is a bull trap. The analysis points to a Potential Reversal Zone between $61,880 and $62,760. From an Elliott Wave perspective, Bitcoin may be completing its main wave 5 with an expanding diagonal. If it fails to clear $63,500, the move could reverse sharply toward $60,180, with a deeper target of $58,300. This is a cautious read that aligns with the falling volume we are seeing.

Redrawn BTCUSDT 1D trading idea chart for Bitcoin—BTCUSDT 5X LONG with 1,410% profits potentialRedrawn BTCUSDT 240 trading idea chart for Bitcoin Pushed Higher After NFP_ But This Could Be the Bull Trap

On the opposite end of the spectrum, some traders are calling for a massive long-term rally. One high-conviction setup suggests a long entry for Bitcoin anywhere between $55,000 and $65,000, with targets stretching as high as $213,000. This is less of a trade and more of a religious conviction. It ignores the short-term data in favor of a "bottom is in" narrative.

For Ethereum, the bullish case is built on the "higher low" territory established over the last five months. The target for a long position is $2,015, with a stop loss if the monthly candle closes below $1,400. Given the current RWA news, this trade is betting on a fundamental shift in how ETH is used by institutions.

Smart Money Signals — Hyperliquid Leaderboard

Hyperliquid LONG BTC leaderboard chartHyperliquid SHORT HYPE leaderboard chart

The top traders on Hyperliquid are playing both sides of the volatility. One high-ROI trader (0x732f71) has opened a substantial long position in BTC at $60,428 with a notional value of $380,000. This suggests that the "smart money" sees the $60k level as a strong floor.

Conversely, there is a significant short position on HYPE. Trader "agen_men starcraft" opened a short at $63.54 with a notional value of $317,000. This is a bet that the recent rally in the Hyperliquid token is overextended and due for a correction.

Altcoin Spotlight

Hyperliquid (HYPE) deserves a mention today. It has climbed 7.37% to $68.98, landing it in the top 10 by market cap. The token is benefiting from the general appetite for high-performance trading infrastructure. However, as noted in the Smart Money section, some of the most successful traders are already betting on a price drop. It is a classic battle between momentum buyers and mean-reversion shorts.

What to watch next

The immediate focus is the macro correlation. The S&P 500 is down 0.13% and the NASDAQ is down 1.73%. Crypto is currently ignoring the traditional tech slump, which is unusual. If the NASDAQ continues to slide, the "fear" currently reflected in the sentiment index may finally manifest in the price action.

We also need to watch the $63,500 level for Bitcoin. If it cannot break through that resistance on increasing volume, the "bull trap" narrative becomes the dominant one. The market is essentially waiting for a catalyst that is more powerful than a few tokenization press releases. Until we see a genuine surge in spot volume, this rally remains a house of cards.