Market Overviews

Daily crypto market overviews, trend analysis, and key updates from our editorial team.

Crypto Market Overview | Derivatives volume dwarfs spot trading amid ETF flow divergence | August 29, 2026
Sigrid Voss·

Crypto Market Overview | Derivatives volume dwarfs spot trading amid ETF flow divergence | August 29, 2026

Market overview

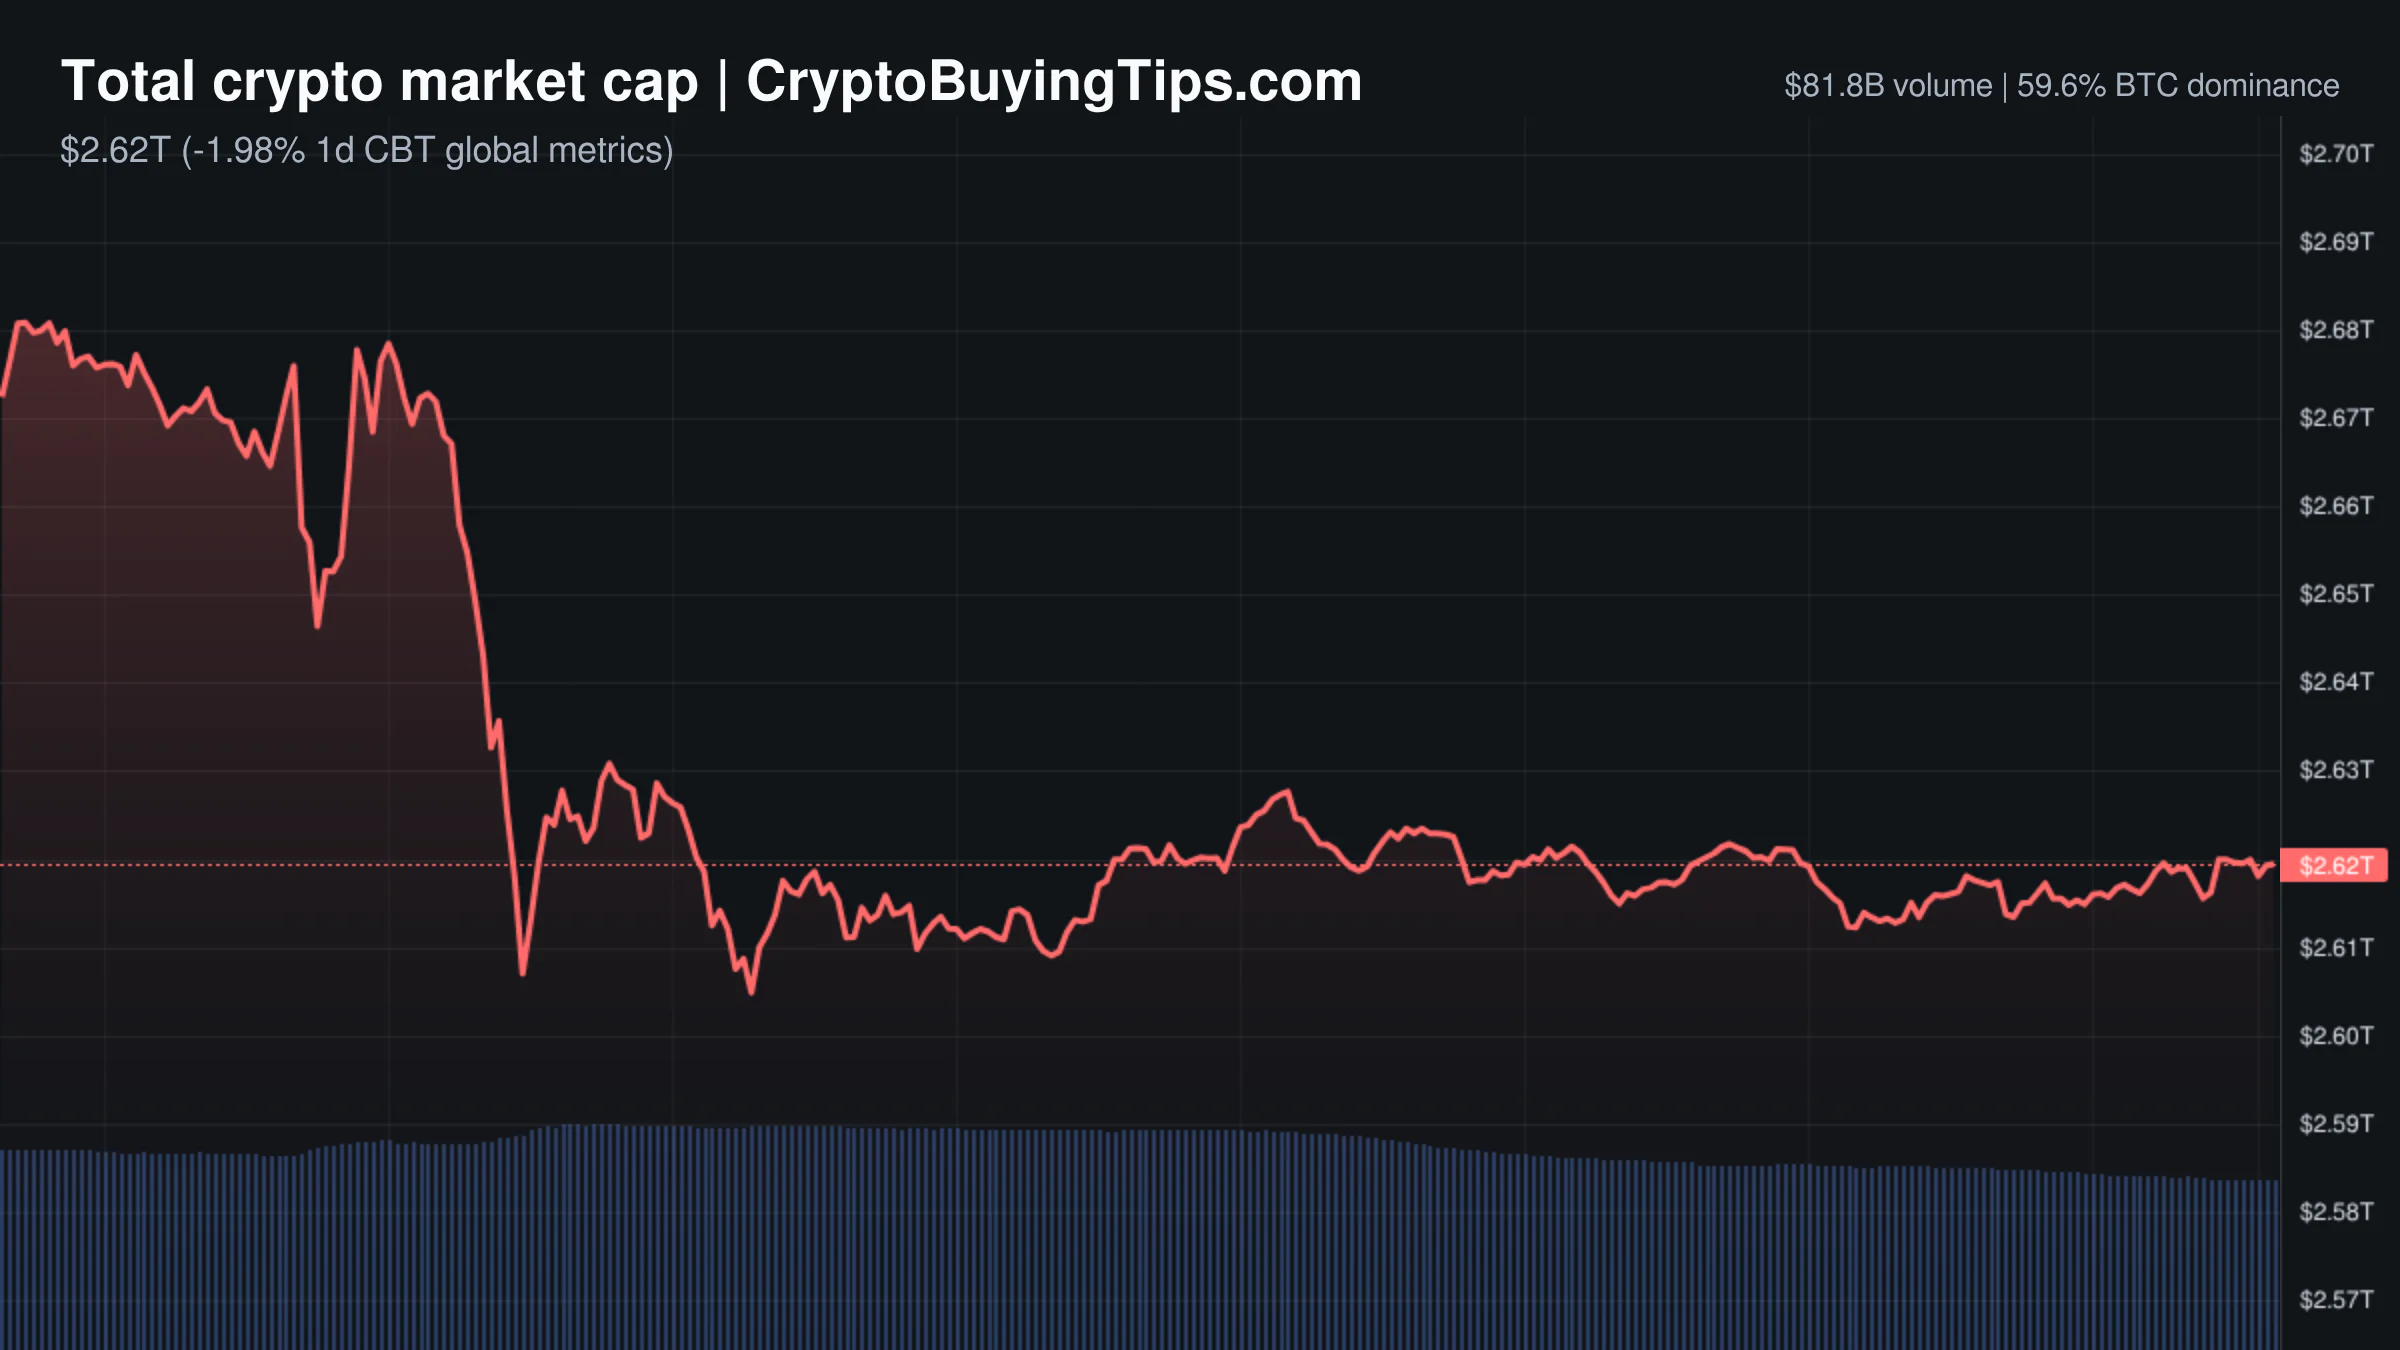
The market is currently operating in a state of cognitive dissonance. The Fear and Greed Index sits at 77, firmly in Greed territory, yet the total crypto market cap has slipped to $2.62T, a drop of over 5% in the last 24 hours. It is a classic display of the market's ability to remain optimistic while the actual price action suggests a collective retreat. This disconnect is further highlighted by the volume split. Spot volume is a modest $81.92B, while derivatives volume has ballooned to $715.84B.

When derivatives volume is nearly nine times higher than spot volume, the market is not being driven by people buying assets to hold them. It is being driven by leverage. This creates a fragile environment where price moves are often the result of liquidations rather than fundamental shifts. Bitcoin dominance has climbed to 59.51%, confirming that we are firmly in a Bitcoin season. Capital is consolidating into the largest asset, leaving the rest of the market to fight for scraps. The Altcoin Season Index at 30 indicates that the rotation into smaller assets is not happening, and the current trend favors the safest bet in a risky room.

Bitcoin and Ethereum

Bitcoin is currently trading at $77,720.97, down 2.20% over the last day. The asset has struggled to maintain momentum after facing repeated rejection at the $81,400 level. This suggests a ceiling of selling pressure that the current bid side cannot overcome. While the institutional narrative remains the primary driver, the immediate price action looks like a cooling-off period after a strong rally.

Ethereum is priced at $2,436.14, falling 2.54%. There is a striking gap between the price action and the institutional flow data. Ethereum ETFs have logged ten consecutive days of net inflows, with BlackRock's ETHA fund accounting for the vast majority of this buying. Despite this, the price has not ripped higher. The implied volatility for Ethereum is 52.43%, significantly higher than Bitcoin's 39.57%, which tells us that traders expect much larger swings for ETH. We have seen this pattern before where the dominance data agrees that institutional interest in the ecosystem does not always translate to immediate price strength when Bitcoin is sucking the air out of the room.

Top crypto prices

The top assets are largely trading in the red today. Bitcoin leads the majors at $77,720.97. Ethereum follows at $2,436.14. BNB is down 2.39% to $689.45, and XRP has slipped 2.16% to $1.38. Solana is trading at $103.52, down 2.20%. TRON has shown more resilience, falling only 0.56% to $0.3386. Hyperliquid is priced at $81.4, down 2.07%.

News driving today's market

The regulatory environment remains a mixed bag of progress and setbacks. A recent U.S. appeals court ruling against Kalshi has introduced fresh uncertainty regarding prediction markets. This is a bearish signal for the broader derivatives space as it suggests federal courts are still undecided on the legality of event contracts. This regulatory friction often leads to a risk-off sentiment among institutional traders. Similarly, the head of the Bank for International Settlements has questioned whether stablecoins are actually credible for payments at scale. Given that stablecoins are the primary liquidity rails for the entire industry, any high-level skepticism from central bankers tends to weigh on market sentiment.

On the bullish side, institutional adoption is hitting new milestones. The Bitwise Solana Staking ETF has crossed $1 billion in assets under management in less than a year. This provides a strong floor of legitimacy for Solana. We are also seeing progress for XRP, as the SEC cleared the paperwork for Evernorth, an XRP treasury company, to move toward a Nasdaq listing. While the SEC has not endorsed the asset itself, the removal of paperwork hurdles is a necessary step for institutional liquidity.

We are also seeing a shift in how yield is generated. Ethena is looking to move beyond crypto derivatives and squeeze yield from equity perpetuals. This move into real-world assets suggests that the industry is searching for more stable sources of return as crypto-native yields fluctuate. We previously noted that Ethereum market share vanishes even as its corporate image improves, and these shifts toward RWA may be a way for protocols to hedge against that volatility.

Social intelligence

The most significant data point from social channels is the divergence in ETF flows. Spot Bitcoin ETFs have finally broken a nine-day winning streak, recording $202 million in outflows. Meanwhile, Ethereum ETFs have extended their streak to ten days. This suggests a subtle rotation where institutional money is taking profits in Bitcoin and rotating into Ethereum. It is a curious trend given that Bitcoin dominance is still rising.

Beyond the numbers, the tech sector is providing a backdrop of volatility. The public conflict between Elon Musk and Sam Altman regarding OpenAI has reintroduced a level of noise into the AI narrative. Since crypto often trades as a high-beta play on AI and general tech sentiment, these high-profile disputes can cause sudden shifts in risk appetite. When the leaders of the AI revolution start calling each other untrustworthy, the "risk-on" mood usually takes a hit.

Trading ideas worth watching

The technical outlook for Bitcoin suggests a short-term correction. The asset was rejected twice at the $81,400 seller zone, which indicates a strong wall of resistance. As long as the price remains below this level, the path of least resistance is downward. A move toward the $78,000 buyer zone is the most likely scenario. If Bitcoin closes above $81,400 with significant volume, the bearish view is invalidated, but for now, the momentum favors the sellers.
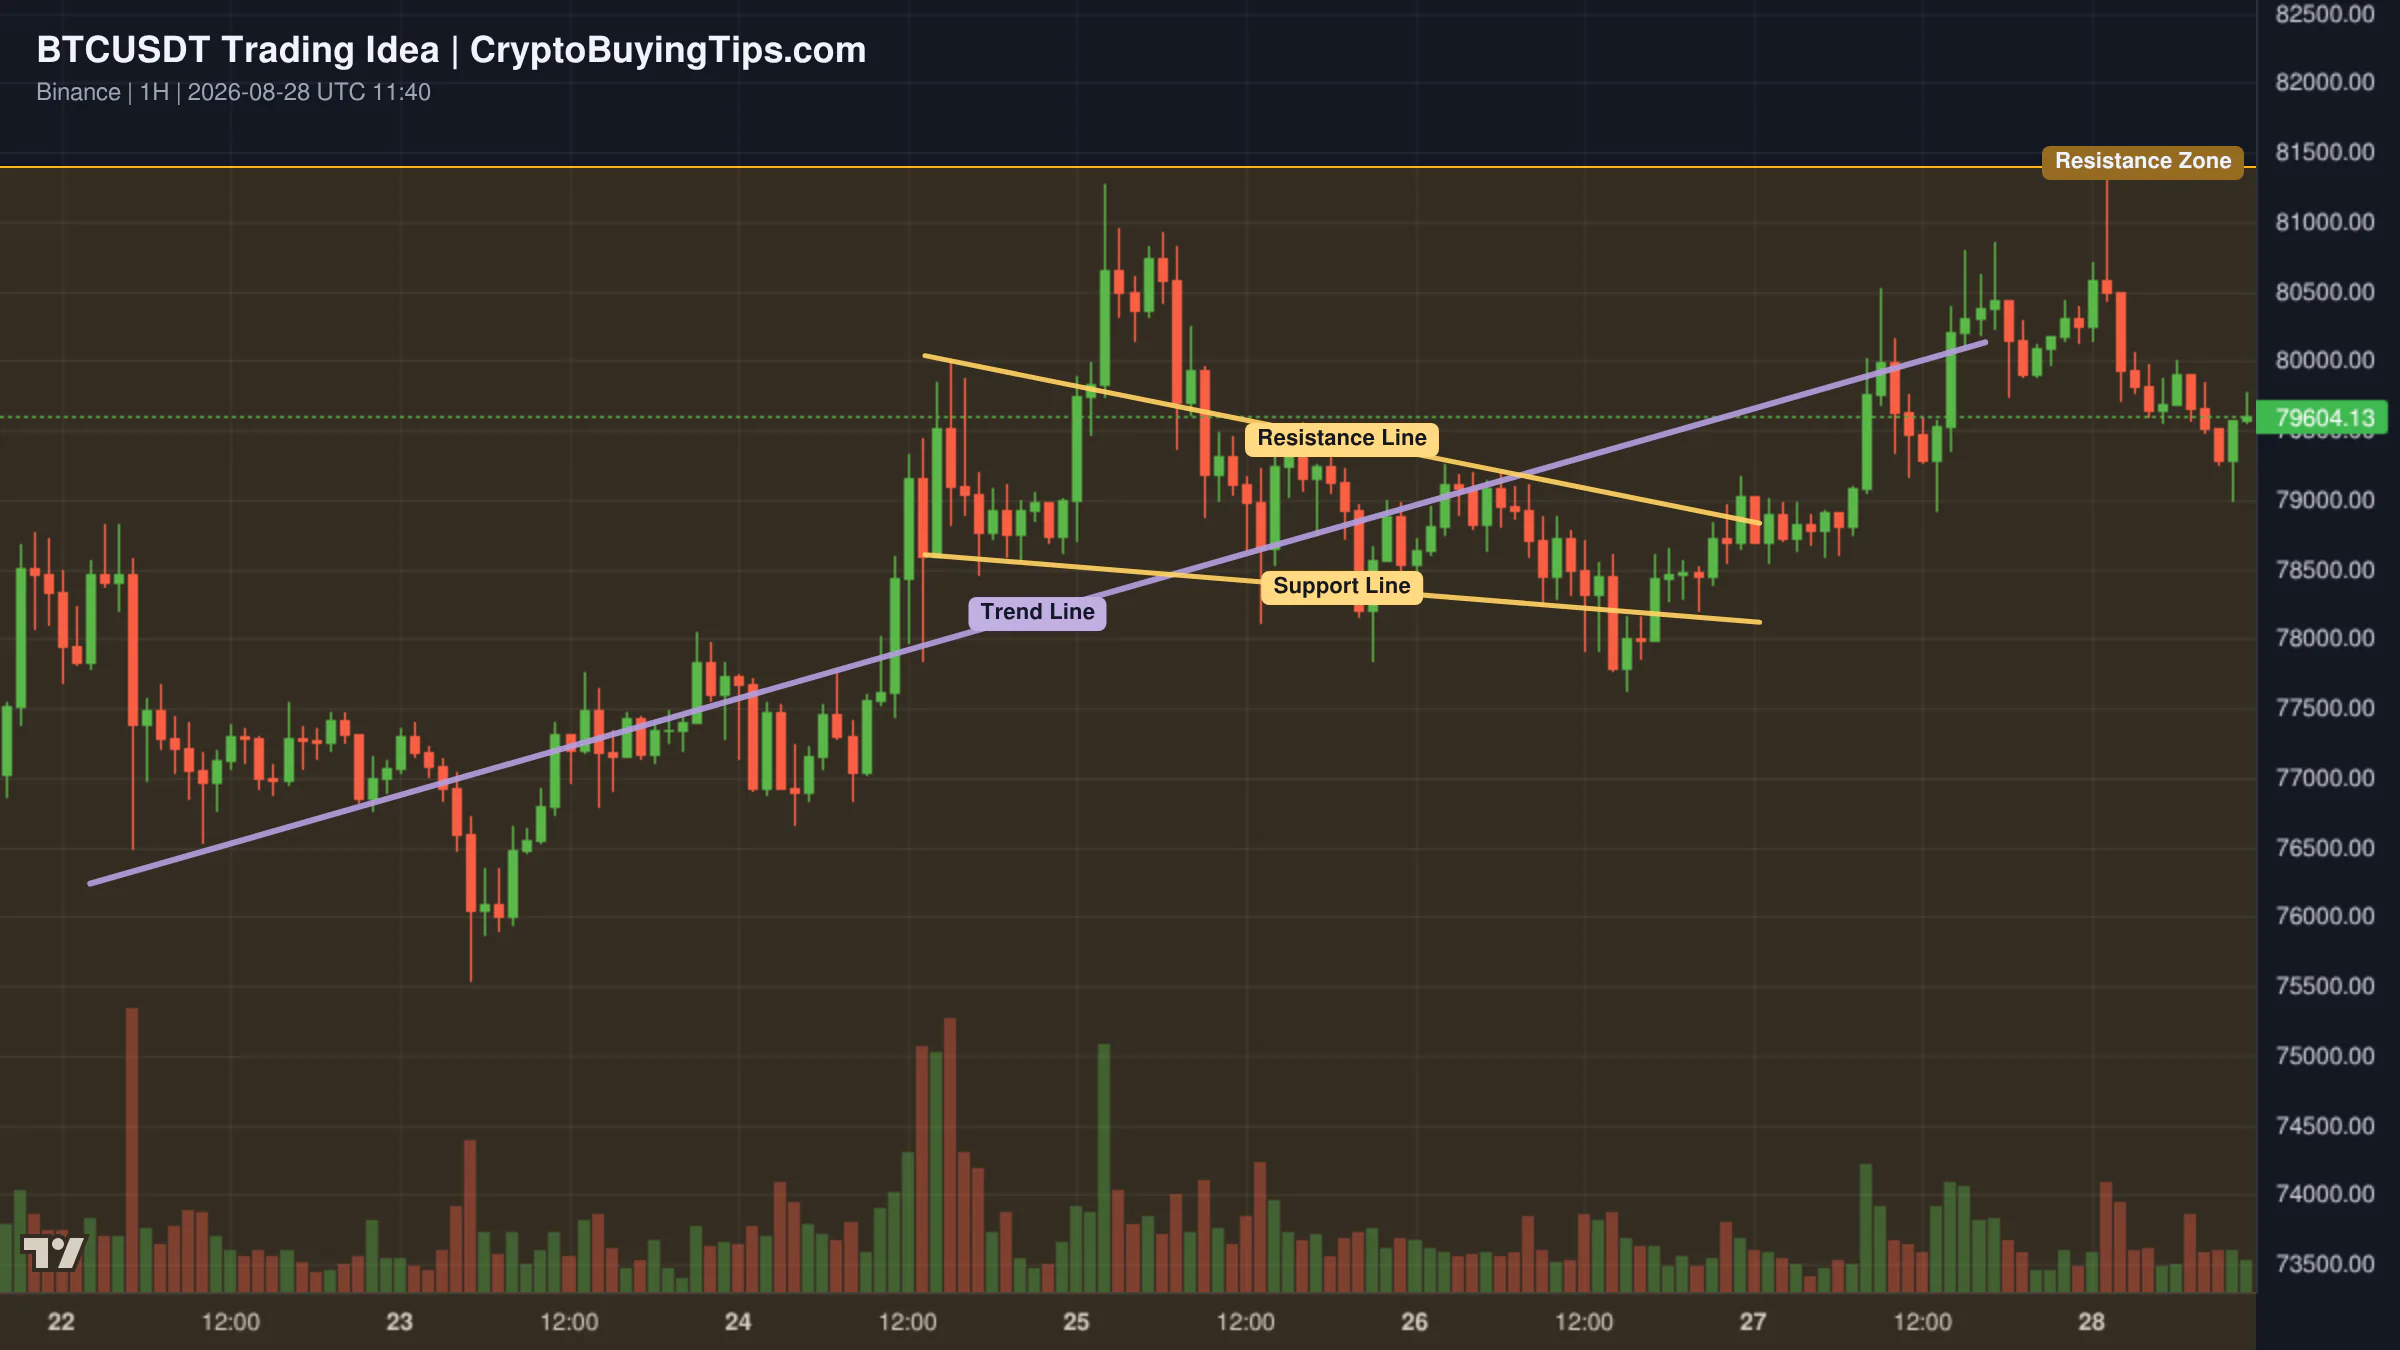
Redrawn BTCUSDT 180 trading idea chart for BTCUSDT Rejected at 81,400 — Correction Toward 78,000 in Focus

For those looking at altcoins, GRAM is showing a classic breakout and retest pattern. After consolidating between $1.30 and $1.37, the price broke higher to $1.55 before correcting. It has now returned to the $1.37 to $1.38 area, which should now act as support. If this level holds, a second leg higher toward $1.48 and $1.63 is possible.
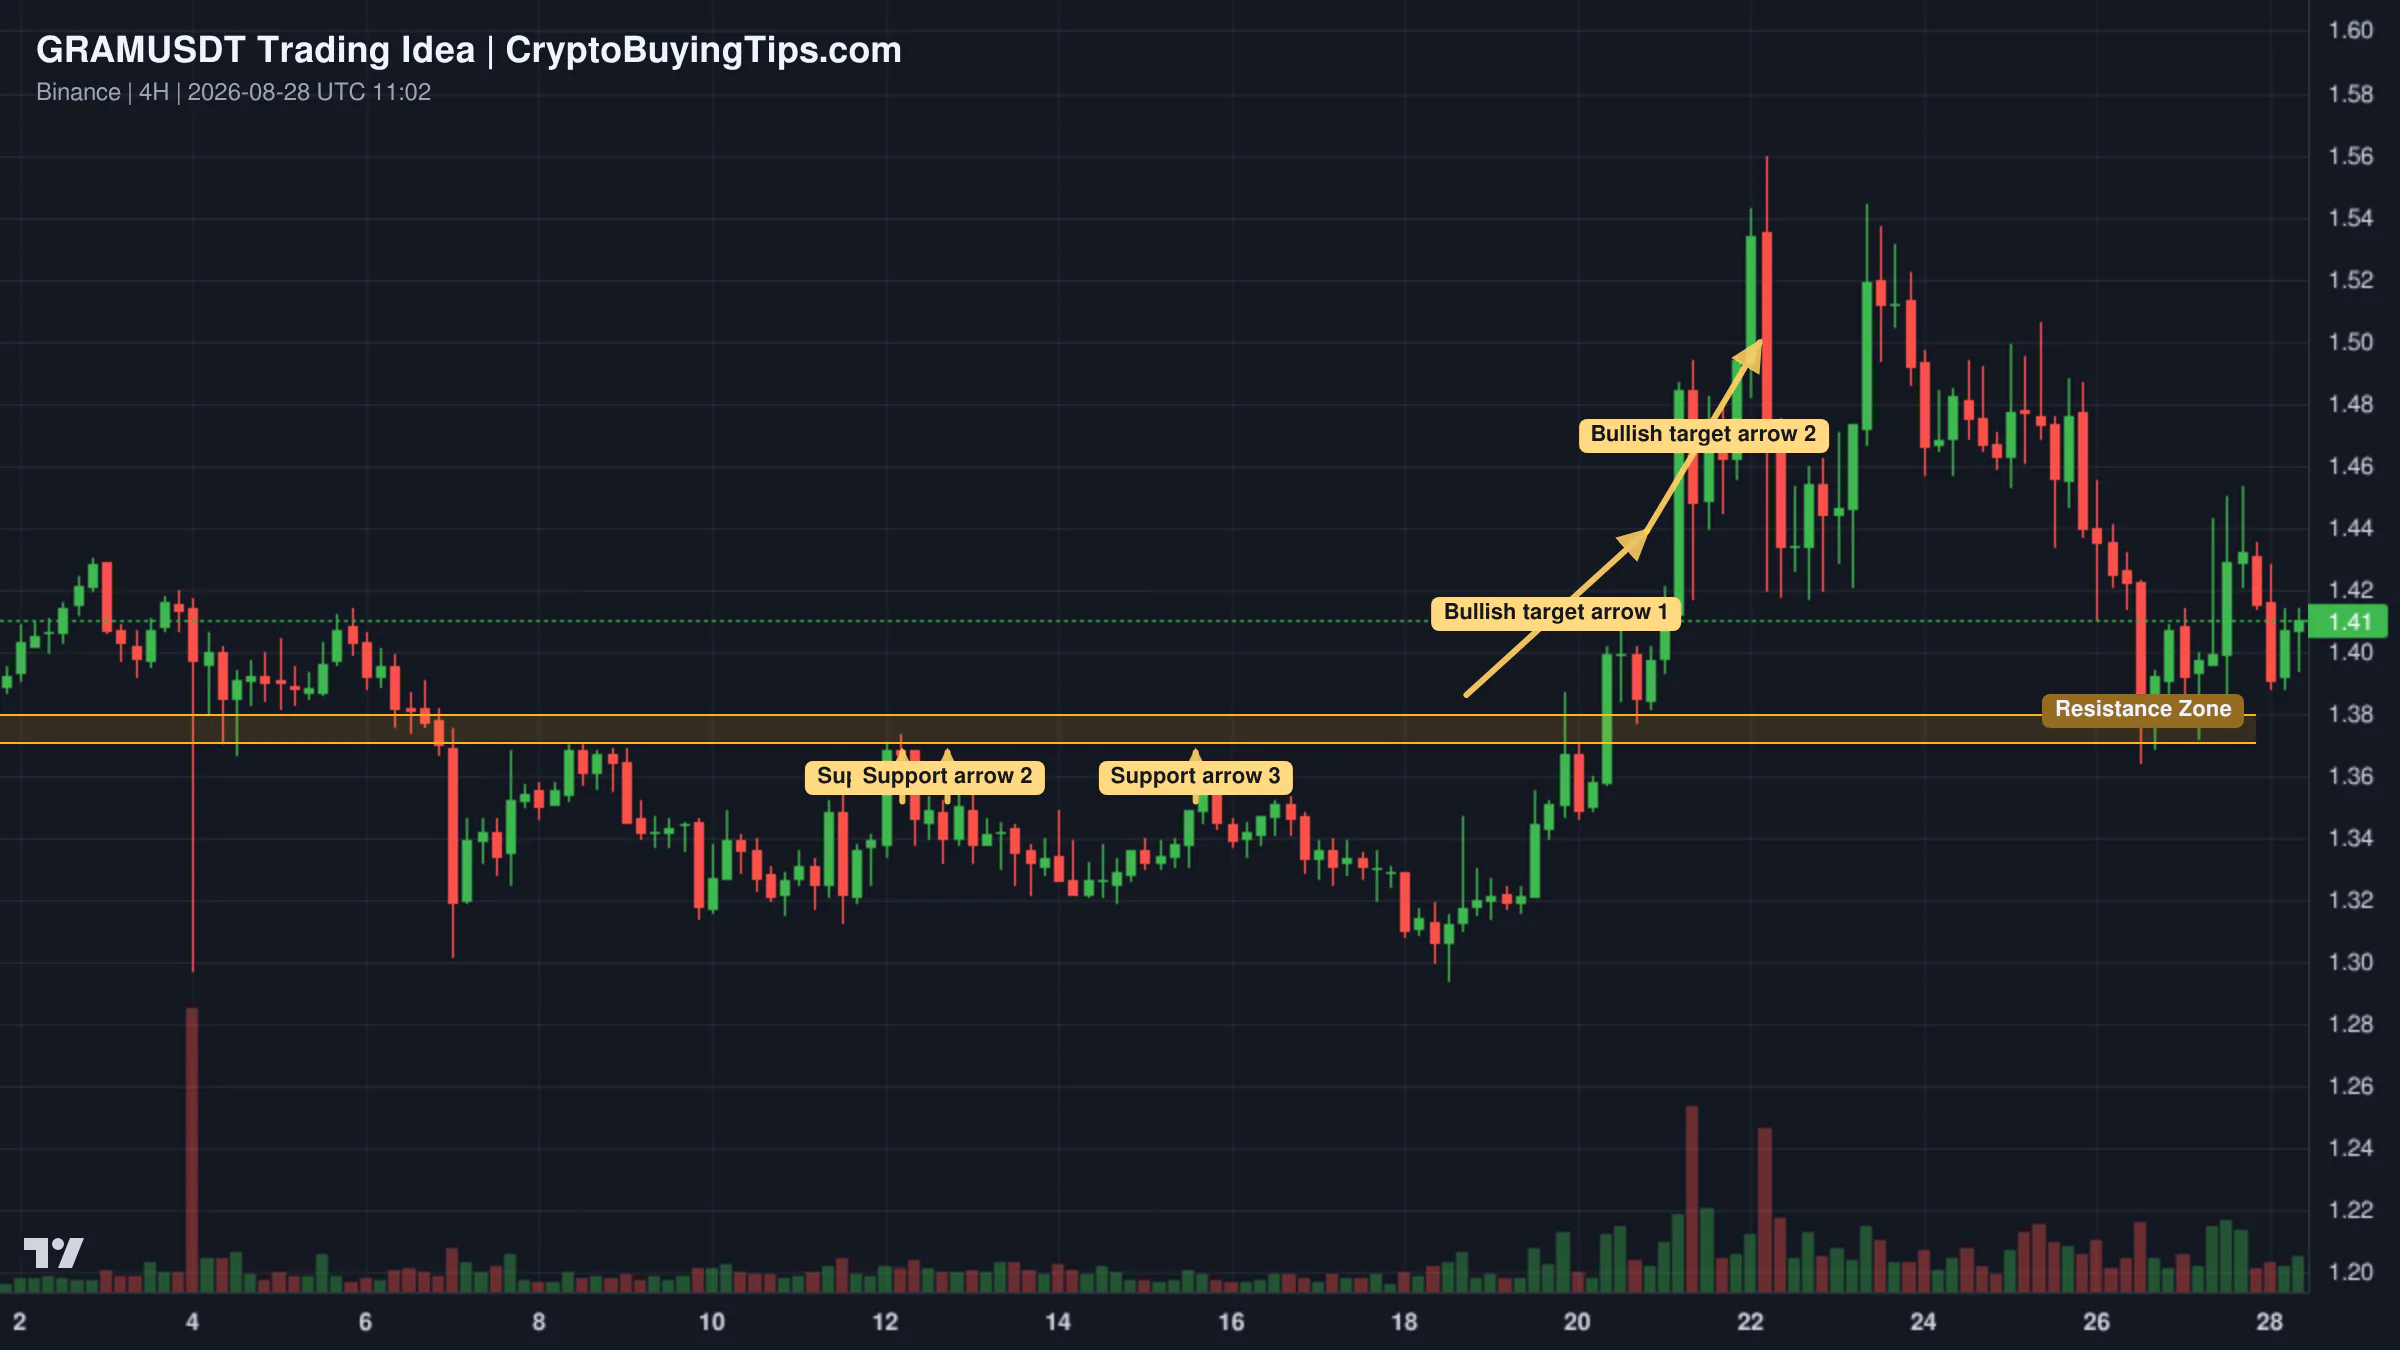
Redrawn GRAMUSDT 240 trading idea chart for GRAM: Breakout, Retest & Potential Next Leg Higher

Chainlink is currently in a liquidity-hunting phase. The price is consolidating between $11.00 and $12.00. Technical analysis suggests a potential long squeeze toward the $10.90 zone to clear out leveraged positions before a move back toward $12.00. This is a common pattern in consolidation phases where the market shakes out weak hands before choosing a direction.

Smart Money Signals — Hyperliquid Leaderboard
Hyperliquid LONG ETH leaderboard chartHyperliquid SHORT SOL leaderboard chart

Our tracker of top traders on Hyperliquid shows a divergence in high-conviction bets. One top trader, with a 103% 30-day ROI, has opened a long position in ETH at $2,434.7 with a notional value of $50,000. This aligns with the institutional ETF inflow data and suggests that smart money is betting on Ethereum's resilience despite the current price dip.

Conversely, another trader with a 139% 30-day ROI has taken a short position in SOL at $114.88, with a notional value of over $114,000. This is a bold bet against the Solana ETF momentum. It suggests that some of the most successful traders on the platform believe the Solana rally has overextended and is due for a correction.

What to watch next

The primary level to watch is the $80,000 mark for Bitcoin. A failure to reclaim this level quickly could accelerate the move toward $78,000. We also need to see if the Ethereum ETF inflow streak can actually translate into price action. Ten days of buying is impressive, but if the price continues to slide, it suggests that the inflows are merely absorbing selling pressure rather than creating new demand.

Finally, keep an eye on the derivatives to spot volume ratio. If the 8.7x gap widens further, the risk of a flash crash increases. The market is currently a house of cards built on leverage, and the first significant piece of bad macro news could bring the whole thing down. For now, the greed index remains high, which usually means the market is ignoring the risks right in front of it.

Crypto Market Overview | extreme greed meets spot ownership signals despite flat price action | August 28, 2026
Sigrid Voss·

Crypto Market Overview | extreme greed meets spot ownership signals despite flat price action | August 28, 2026

Market overview

The market is currently experiencing a strange sort of paralysis. The Fear and Greed Index sits at 81, placing us firmly in the territory of extreme greed, yet price action remains stubbornly flat. It is the classic crypto contradiction: everyone is convinced of a moonshot, but nobody is actually pushing the button. We see a total market cap of approximately $2.69T, which has dipped by 3.15% over the last 24 hours. While the sentiment suggests a frenzy, the actual movement is a quiet drift.

The most telling data lies in the volume divergence. Spot volume is up over 6%, while derivatives volume has fallen by nearly 7%. This suggests a rotation away from high-leverage gambling and toward actual ownership, or perhaps a cautious move into the sidelines. Stablecoin volume is rising, which usually means capital is being positioned for a move, but the Altcoin Season Index remains neutral at 31. Money is not rotating into the broader market; it is huddling in the safest corners.

This concentration is reflected in Bitcoin dominance, which is holding steady around 59%. The market is essentially in a holding pattern. We have a high-sentiment phase where the crowd is bullish, but the liquidity is not flowing into altcoins. It is a state of extreme greed without the corresponding aggression.

Bitcoin and Ethereum

Bitcoin is currently hovering at $79,382, just below the psychological $80,000 barrier. The asset has recently posted its largest weekly dollar gain in history, according to Galaxy Research, yet it is struggling to find the final push needed to clear the current resistance. Much of the focus is on the Jackson Hole symposium. For the first time in four decades, the Fed is discussing payments and financial infrastructure, which is effectively Bitcoin's home turf. The fact that the Fed is even acknowledging this space is a structural win, even if the immediate price reaction is a yawn.

Ethereum is in a more precarious position, trading at $2,496. The network state is particularly quiet; gas fees have plummeted to 0.1 Gwei. While low fees are great for the user, they indicate a ghost town of on-chain activity. This lack of congestion suggests that the current price stability is not driven by network utility but by passive holding. We have previously noted how dominance data agrees that capital is consolidating into Bitcoin. Ethereum is currently the passenger in this regime.

Top crypto prices

The leaderboard shows a market that is largely idling. Bitcoin leads at $79,382, while Ethereum sits at $2,496. BNB is holding steady at $706.26. XRP has slipped slightly to $1.41.

There are a few outliers showing strength. Solana is up 1.67% to $105.82, and TRON has gained 1.32% to reach $0.3404. Hyperliquid continues its climb, trading at $83.05. The strength in Solana is particularly interesting given the institutional products now orbiting the asset.

News driving today's market

Institutional validation is arriving in waves, though it is not yet translating into a vertical price move. The Bank of England has been handed a legal duty to support stablecoin innovation. This is a significant shift for a central bank known for its conservatism. When the BoE is legally mandated to promote digital money, the regulatory risk for the entire sector drops. This aligns with the broader trend of active crypto management becoming a viable institutional strategy.

Visa is also expanding its footprint, partnering with Dunamu to explore stablecoin payments and AI commerce. The inclusion of Open Standard's OUSD in these reviews shows that the industry is moving toward standardized, compliant rails. Similarly, Charles Schwab adding Solana, Avalanche, and Chainlink to its platform suggests that the "BTC and ETH only" era for retail brokers is over.

Not everything is bullish. Nvidia's reported acquisition of Hugging Face is a concern for the decentralization narrative. Concentrating the open-source AI pipeline under one hardware giant creates a choke point that could hinder independent builders. On the legal front, a Polish Olympic chief was arrested over suspected crypto-linked bribes. These types of stories rarely move the needle on price, but they keep the regulatory spotlight firmly on the industry.

Social intelligence

On-chain data is flashing some interesting signals for specific assets. Hyperliquid is seeing significant whale activity. A new wallet recently received 440,000 HYPE, worth about $37.25M, from FalconX. Simultaneously, Multicoin Capital has deposited nearly $60M worth of HYPE into Coinbase Prime over the last ten days. This level of movement suggests that institutional players are actively managing their positions in HYPE, which often precedes a volatility event.

Solana is also seeing a surge in institutional product adoption. The BSOL ETF has seen record-breaking single-day trading volume, totaling $500M over its first seven sessions. This provides a consistent bid for the asset that is independent of retail sentiment.

We are also seeing a reminder of the geopolitical risks that haunt the space. X's safety team uncovered a Chinese bot farm using AI to manipulate debates around US energy and AI policy. While this is not a crypto-specific event, it highlights the volatility of the information environment that drives market sentiment.

Trading ideas worth watching

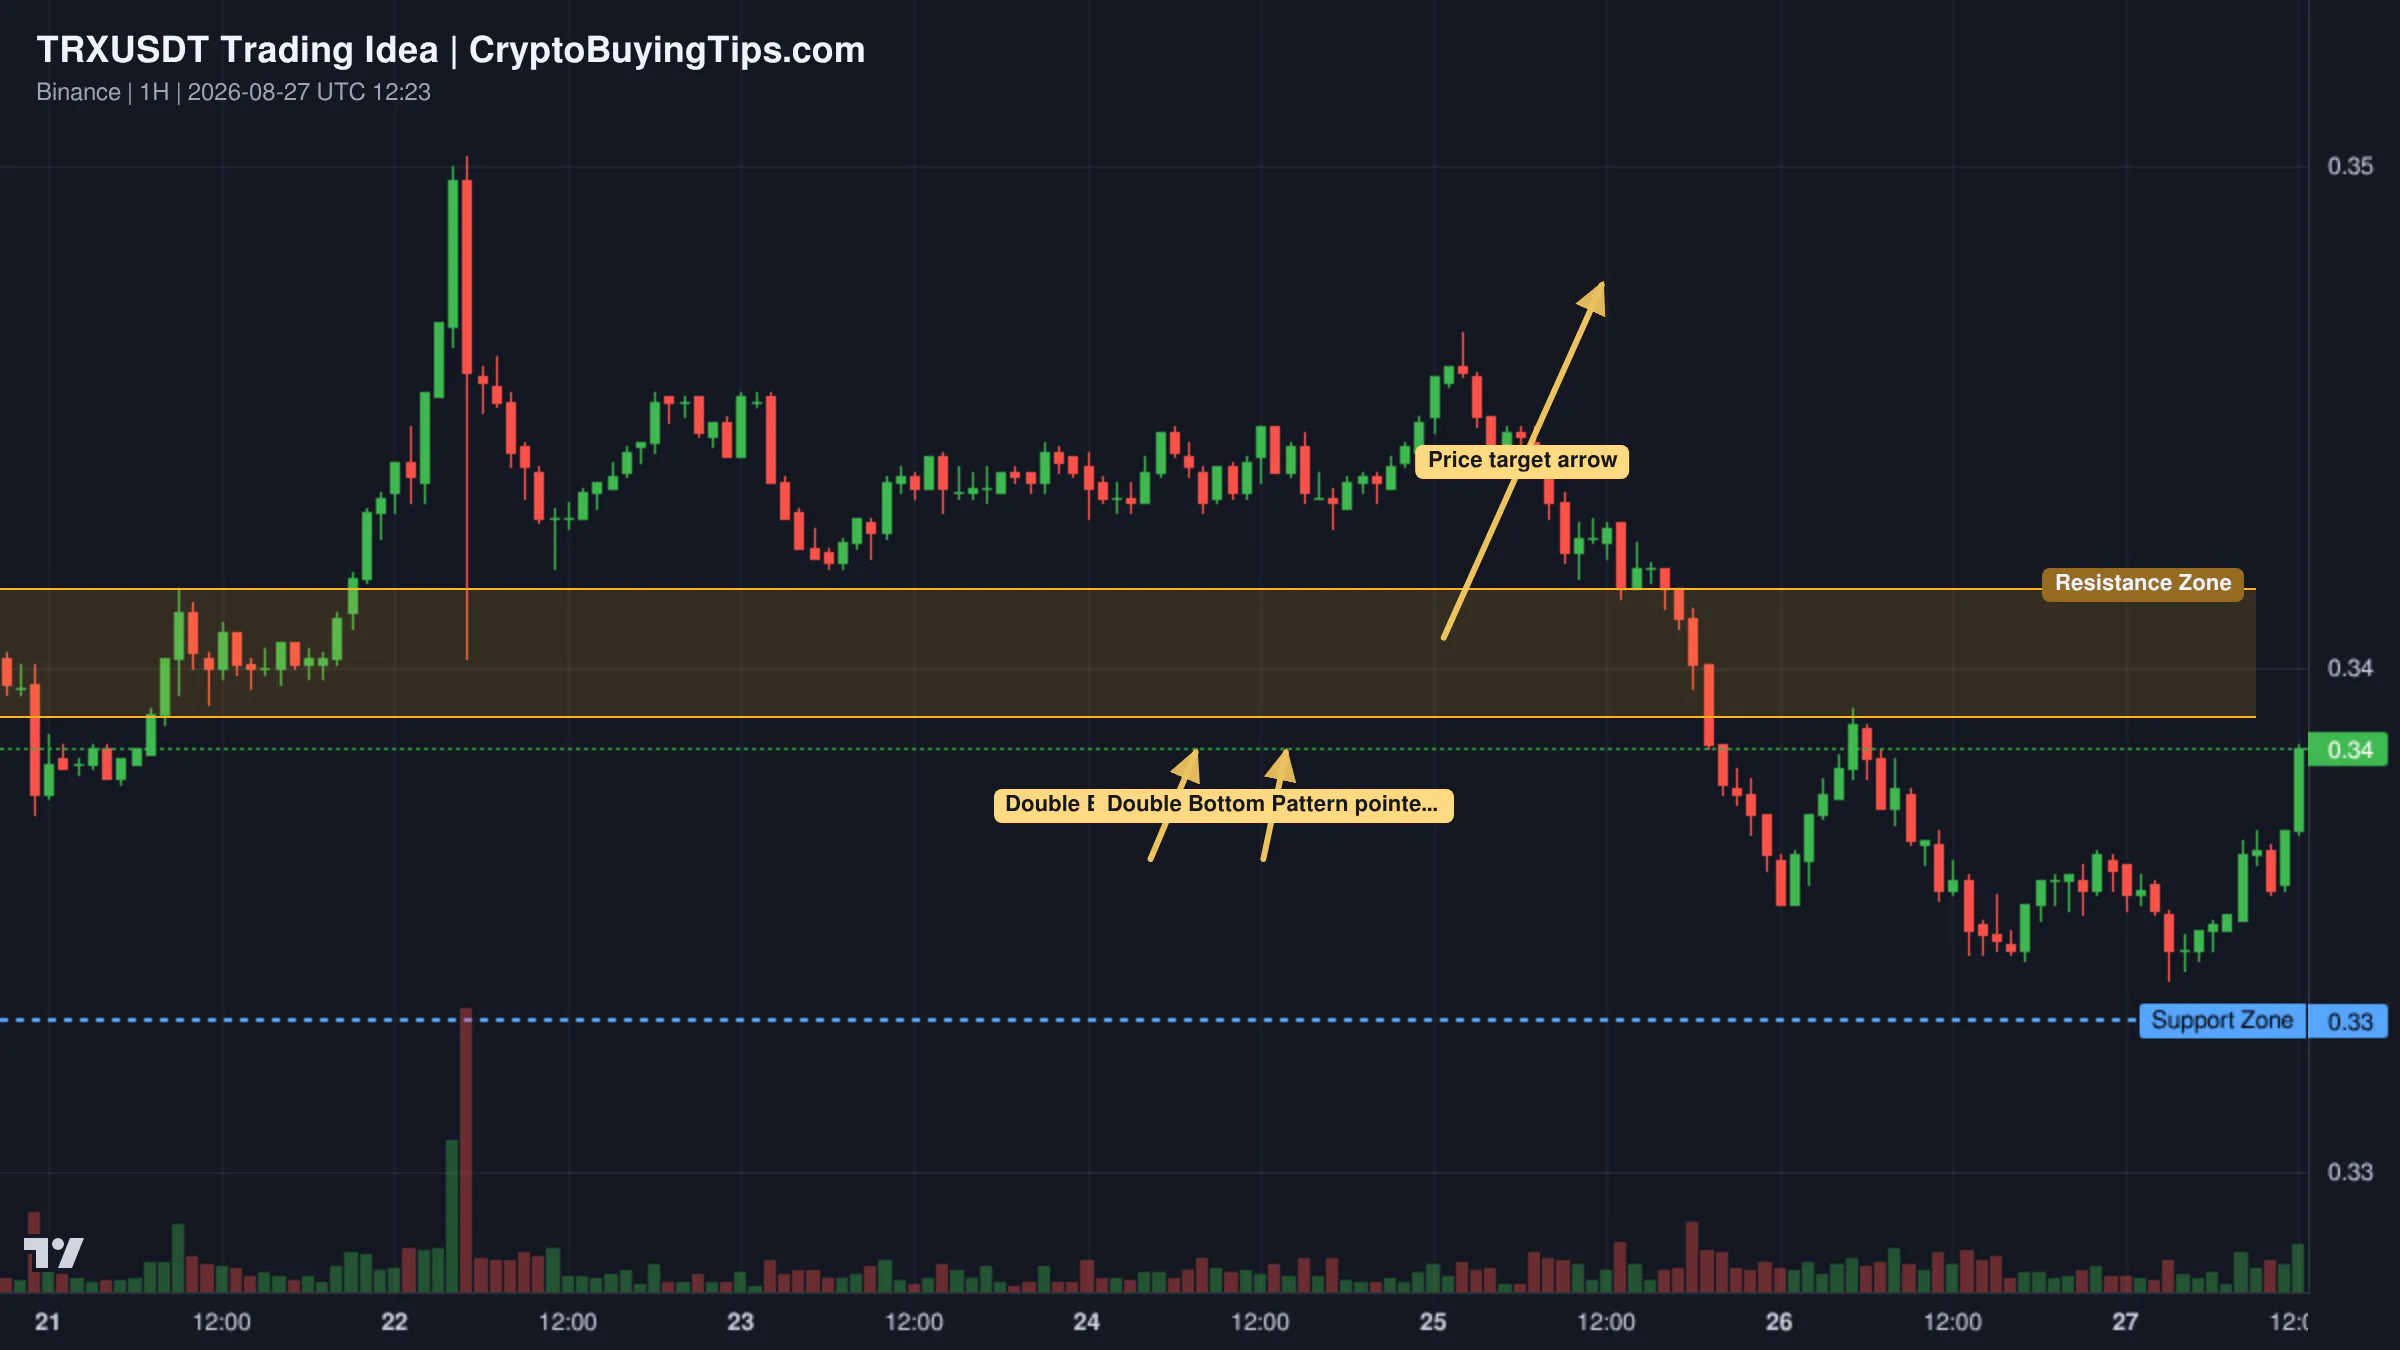
TRON is currently presenting a bullish reversal setup. On the one-hour chart, a double bottom pattern has formed after a prolonged downtrend. The price rebounded from support near 0.3330 and has already broken above the neckline at 0.3390. If this pattern holds, we expect a move toward resistance levels at 0.3416 and 0.3442. It is a classic reversal play, though it requires a sustained break above the neckline to confirm the shift in momentum.

Redrawn TRXUSDT 60 trading idea chart for TRX: Bullish Reversal in Play - Double Bottom Pattern

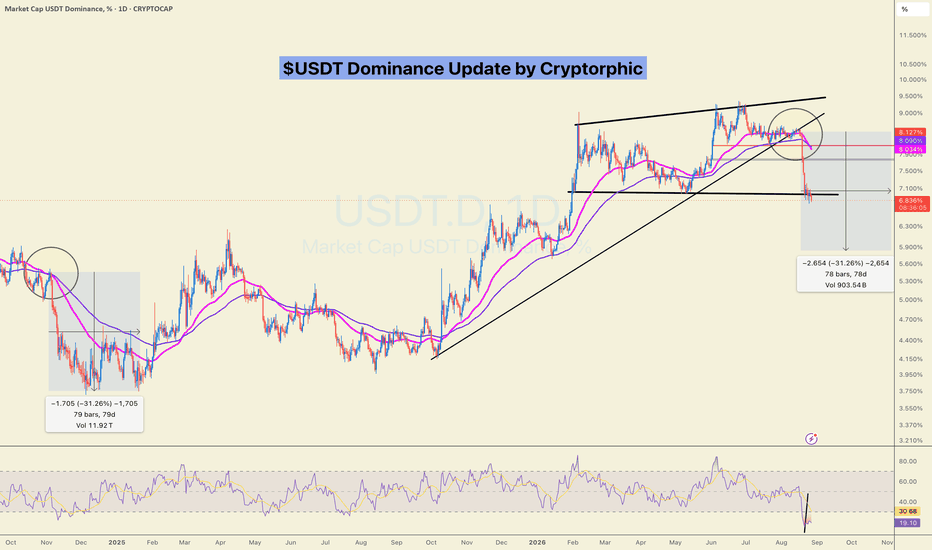
For those looking at the broader market, the USDT Dominance (USDT.D) chart is a key indicator. The dominance index has broken below a rising trendline and the 7.0% support level, currently sitting around 6.83%. When stablecoin dominance falls, it typically means capital is rotating into risk assets. If USDT.D continues to bleed toward the 5.9% to 6.0% range, we could see the actual start of an altcoin expansion.

Trading idea chart: USDT.D - $USDT Dominance Update! Urgent!

Solana is in a neutral pivot zone. The key level to watch is $97. As long as the price stays above this mark, the path toward $156 remains open. However, a daily close below $97 would shift the narrative, likely sending the price back toward the $77 support zone. It is a binary setup; the market is simply waiting for the price to pick a side.

Smart Money Signals — Hyperliquid Leaderboard
Hyperliquid LONG ETH leaderboard chart

Our leaderboard tracker has flagged a high-conviction move in Ethereum. A top trader with a 202% 30-day ROI has opened a long position at $2,695.1 with a notional value of $1.35M. This trader has a track record of $757K in all-time PnL, suggesting this is not a random bet. Given that the current price is lower, this position is currently underwater, but the size of the bet indicates a strong belief in a recovery for ETH.

Altcoin Spotlight

Hyperliquid deserves attention today. It has climbed into the top ten by market cap, currently ranked ninth with a valuation of $20.91B. Beyond the price action, the whale movements from FalconX and Multicoin Capital are the real story. When you see tens of millions of dollars moving into new wallets or prime brokerages, it suggests the asset is being treated as a core institutional holding rather than a speculative altcoin.

What to watch next

The immediate focus is the $80,000 level for Bitcoin. A clean break above this could trigger a FOMO-driven rally, especially given the extreme greed already present in the sentiment data. Conversely, if the Jackson Hole symposium fails to produce a concrete catalyst, we may see a correction as the "extreme greed" becomes a liability.

We are also watching the USDT Dominance chart. The current dip below 7% is the first real sign that capital might be ready to leave the sidelines. If this rotation begins, the neutral Altcoin Season Index could shift rapidly. Finally, the divergence between Ethereum gas fees and its price suggests a fragility in the ETH bid. We want to see on-chain activity return before we believe in a sustainable recovery for the second-largest asset.

Crypto Market Overview | leverage drives action amid institutional regulatory shifts | August 27, 2026
Sigrid Voss·

Crypto Market Overview | leverage drives action amid institutional regulatory shifts | August 27, 2026

Market overview

The market is currently operating in a state of extreme greed, with the Fear and Greed Index sitting at 81. While price action remains bullish in the short term, the underlying plumbing suggests a precarious setup. The most striking data point is the massive divergence between spot and derivatives activity. Derivatives volume has hit $860 billion, which is roughly 9.7 times higher than the $88.51 billion seen in spot trading. This indicates the current move is being propelled by leverage rather than organic accumulation.

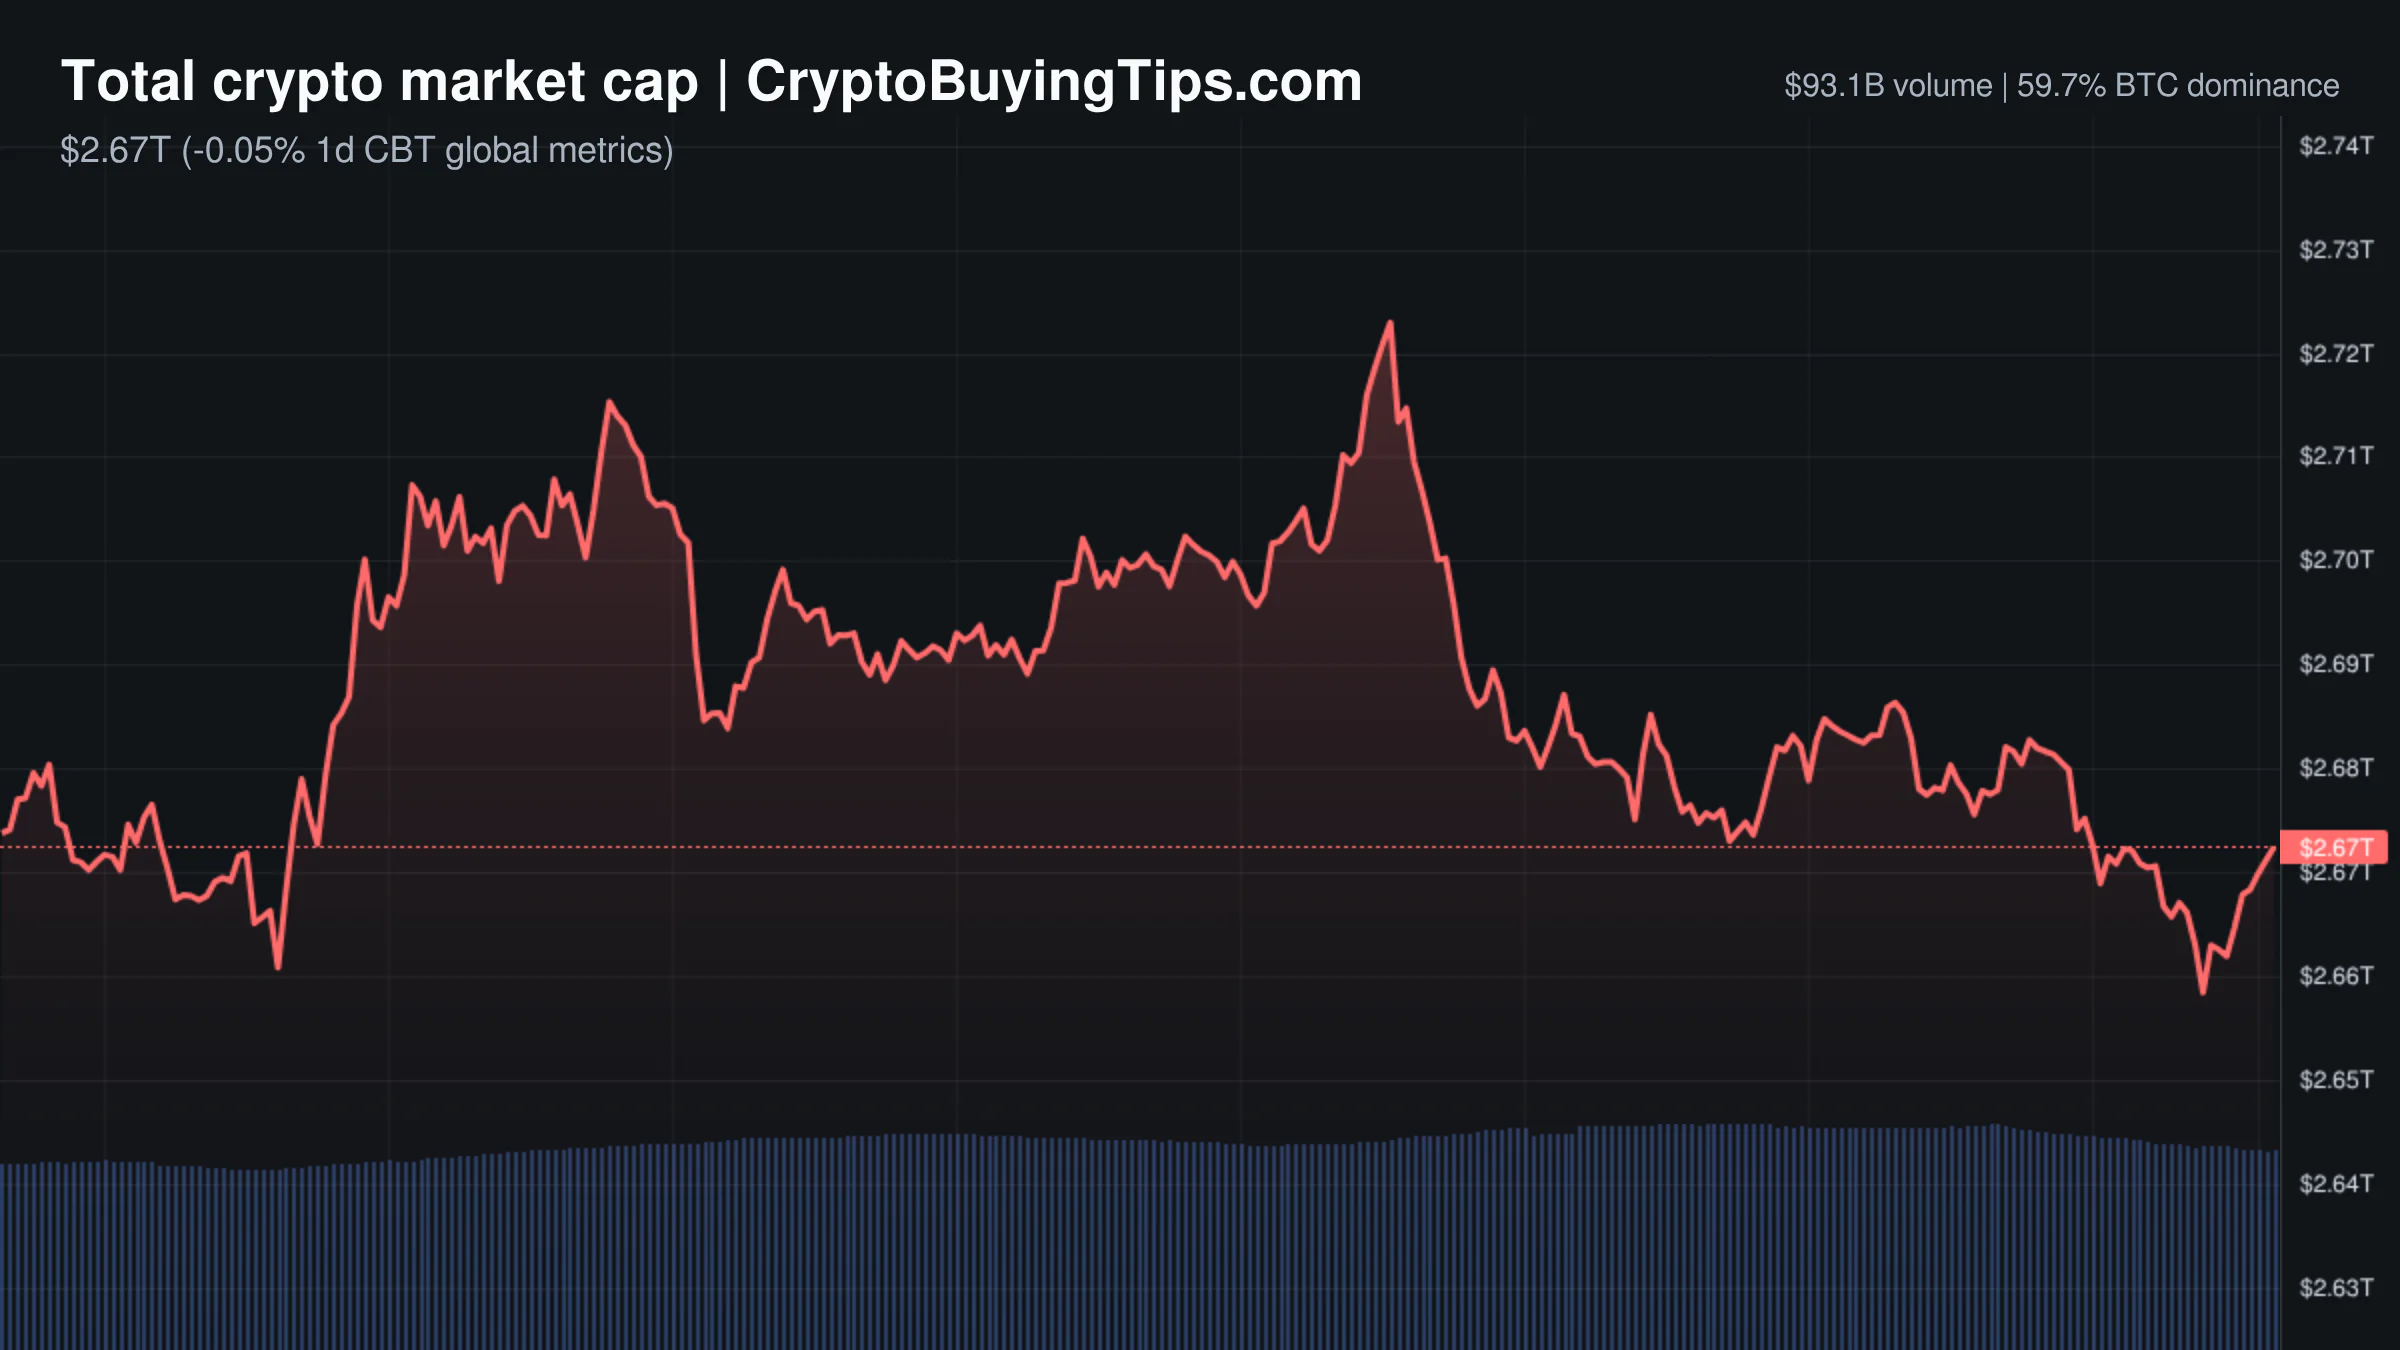
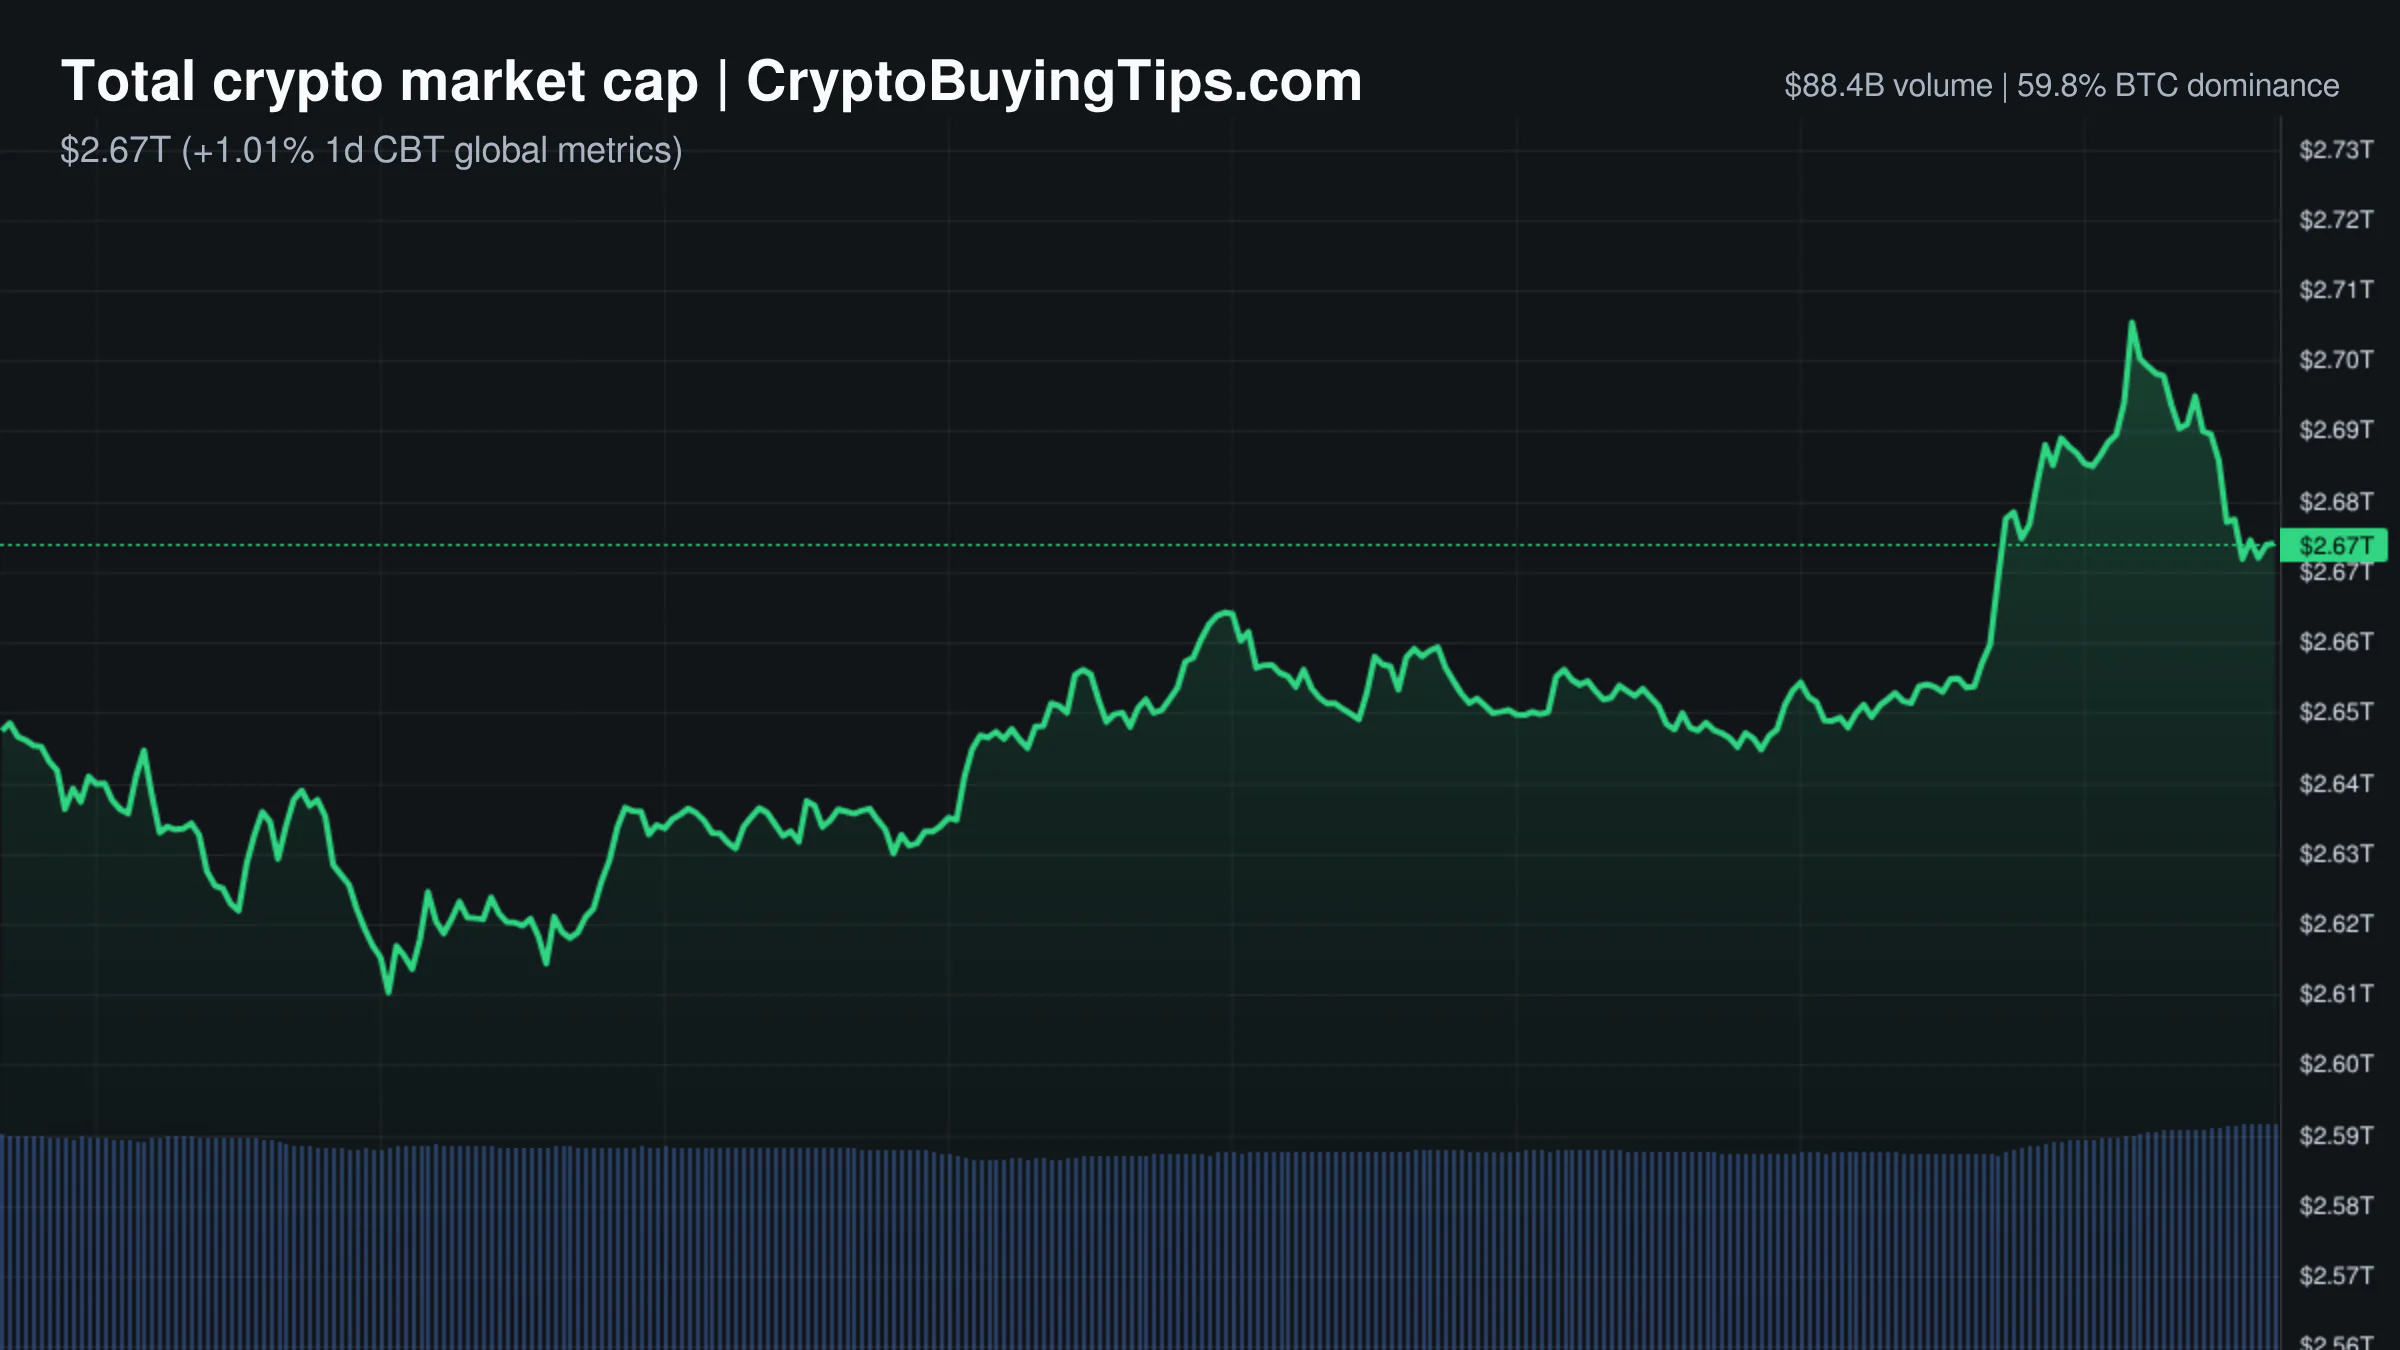
Bitcoin dominance remains high at 59.76%, confirming that we are firmly in a Bitcoin season. The Altcoin Season Index is neutral at 35, meaning capital has not yet rotated meaningfully into smaller assets. With the total market cap hovering around $2.67 trillion, the market is essentially a giant leverage bet. The high momentum is apparent, but the reliance on derivatives often precedes a flush out event when sentiment reaches these levels of euphoria.

Bitcoin and Ethereum

Bitcoin is trading at $79,556.58, continuing its push toward the psychological $80,000 barrier. The price action is supported by a narrative of increasing utility, such as the launch of BTC-backed mortgages via Better and Coinbase. However, the heavy derivatives skew suggests that the move is fragile. If Bitcoin fails to reclaim $80,000, the concentrated long positions could trigger a sharp correction.

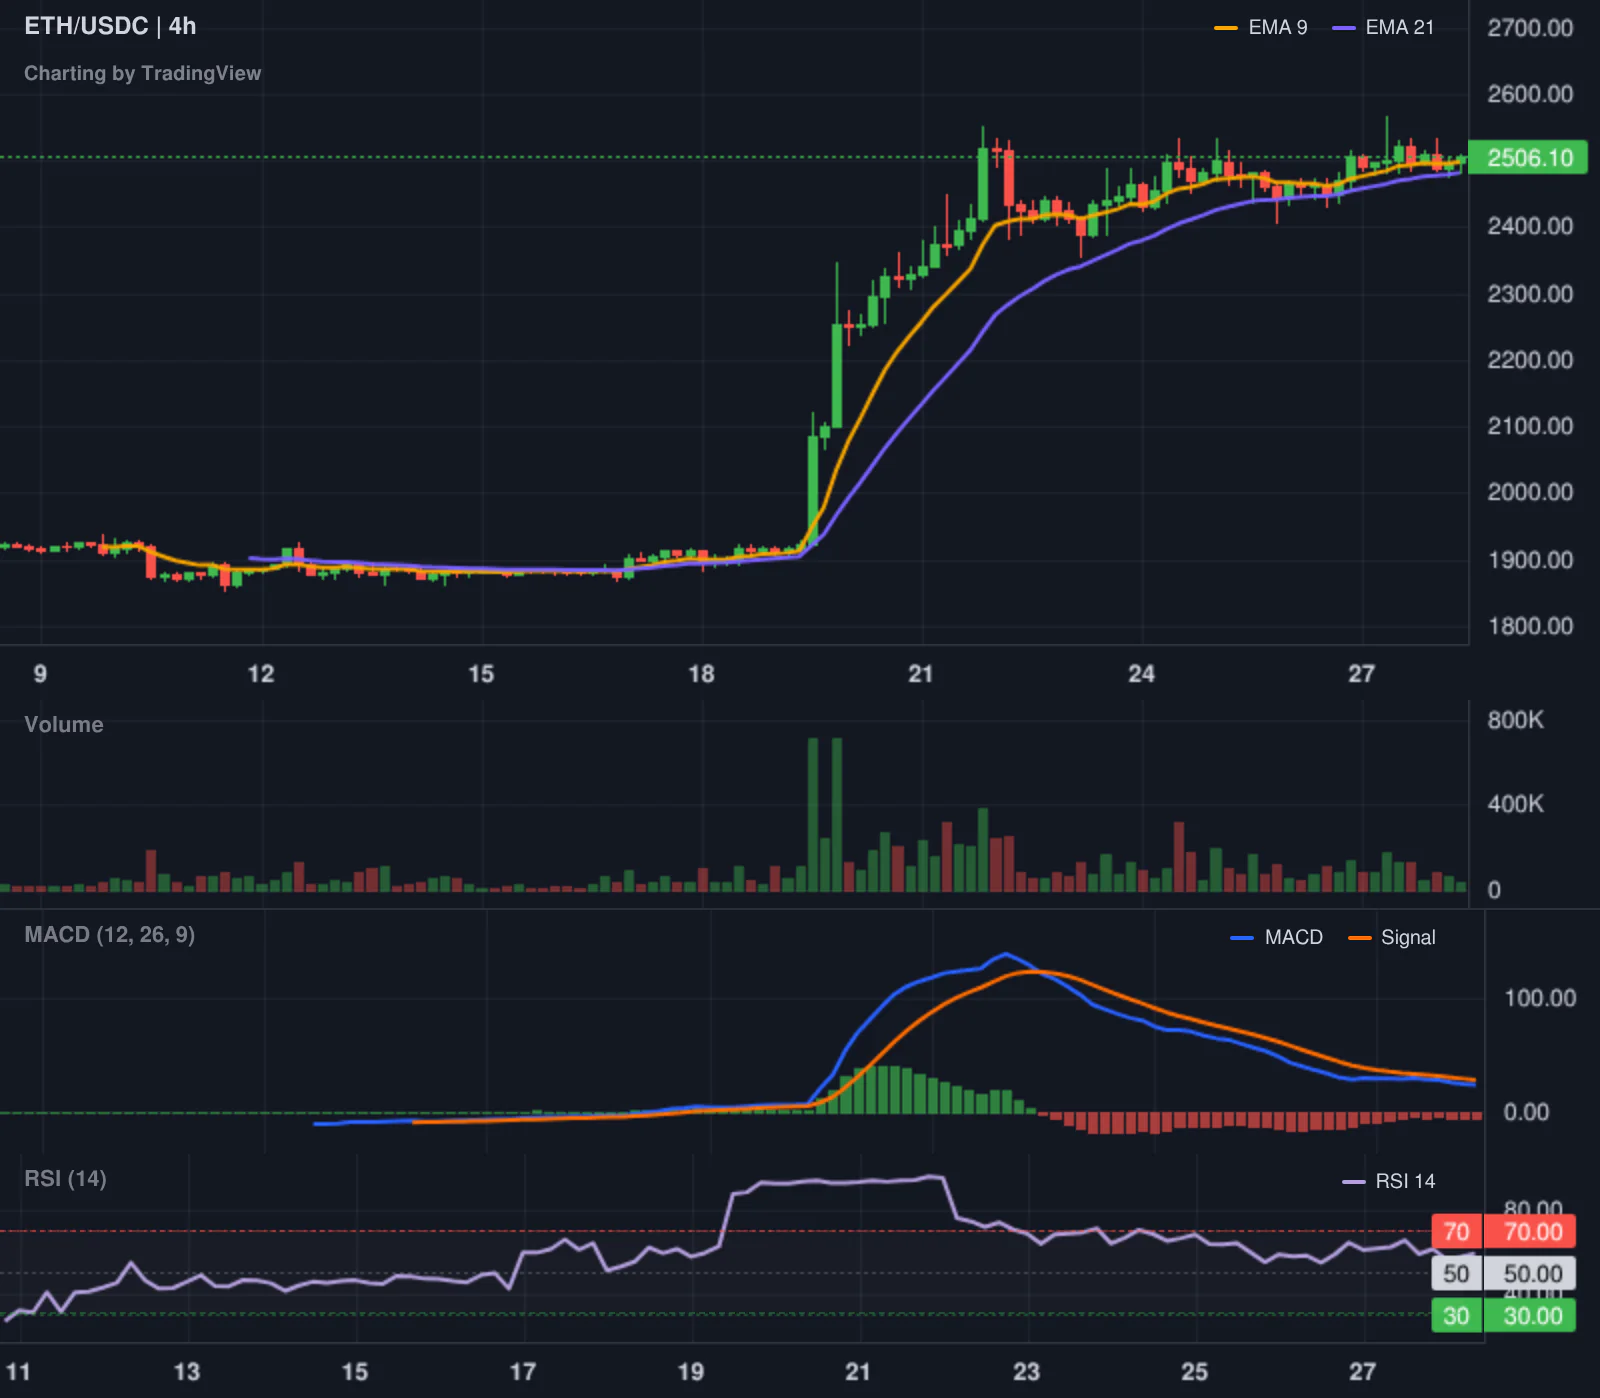
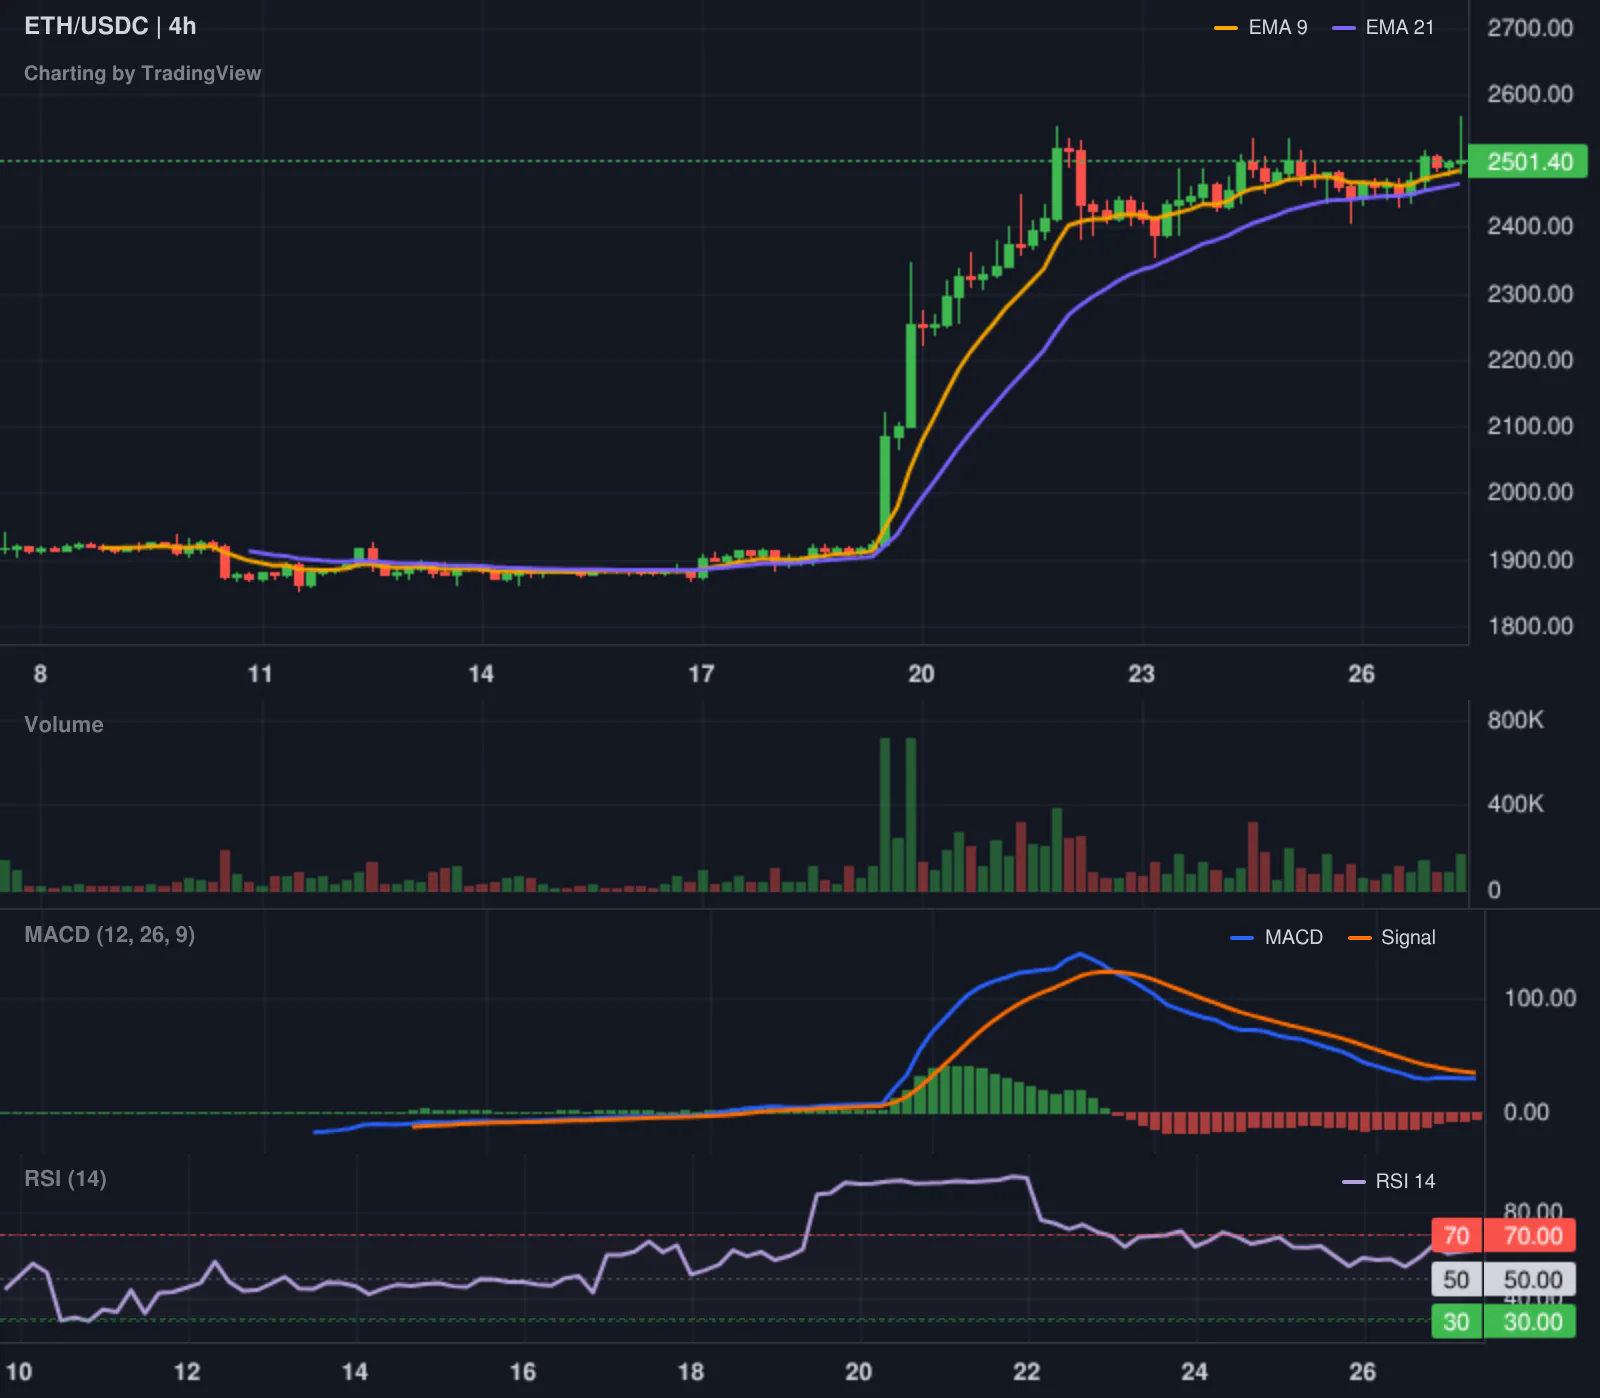
Ethereum is priced at $2,504.52, showing a modest 24h gain of 1.45%. There is a strange contradiction in the data. While the price is rising, network activity is nearly nonexistent. Gas fees are exceptionally low, ranging between 0.11 and 0.18 Gwei. This suggests that the price increase is not being driven by actual DeFi usage or on-chain activity, but rather by broader market momentum and speculative positioning.

Top crypto prices

The top assets show a mixed but generally positive trend. Bitcoin leads at $79,556.58, while Ethereum sits at $2,504.52. BNB is flat at $706.54, and XRP has dipped slightly to $1.42. Solana is the standout performer among the majors, climbing 6.37% to $103.99. TRON is trading at $0.3357, and Hyperliquid has seen a small decline to $82.13.

News driving today's market

Regulatory movement is the primary driver today. The SEC has sent a crypto custody rule overhaul to the White House for review. This is a significant step toward institutional clarity, as it may finally define how investment advisers hold digital assets for clients. Similarly, the Bank of England is planning a new objective for stablecoins, signaling that G7 central banks are moving past the "experiment" phase and into formal integration. We previously covered tokenizing stocks trap for more background.

There is a growing tension between the Federal Reserve and the tokenization trend. Dallas Fed economists warned that the tokenized deposits concept could drain $700 billion from bank lending capacity by making deposits less sticky. In a reflexive response, thirty-nine state banking associations have formed the BankChain Alliance to build their own regulated blockchain infrastructure. The banks are essentially trying to build a walled garden to prevent the very liquidity drain the Fed is worried about.

Institutional adoption is also appearing in the plumbing. Taurus has linked digital asset platforms to the Swift blockchain ledger, which allows institutional clients to move assets through the world's most established financial messaging system. This removes a layer of friction for the traditional finance sector.

Social intelligence

On-chain and social data show a mix of whale aggression and operational risk. Grant Cardone has announced an increase in BTC allocation for a real estate project, moving from 350 to 900 tokens. This is a classic "risk-on" signal from a high-profile investor. Geopolitically, a deal between Iran and Oman regarding the Strait of Hormuz has reduced immediate tensions around a global shipping chokepoint, which generally supports a higher risk appetite across all assets.

However, there are technical warnings. Core Lightning maintainers have told node operators to upgrade or go offline due to vulnerabilities reported by AI. It is a bit ironic that AI is now finding bugs faster than humans can patch them. In the derivatives space, the "pension-usdt.eth" whale suffered a $23.9 million loss after a massive ETH short was liquidated. The whale has already pivoted, opening a 2x long on ENA, proving that in this market, the only thing faster than a liquidation is the desire to bet again.

Trading ideas worth watching

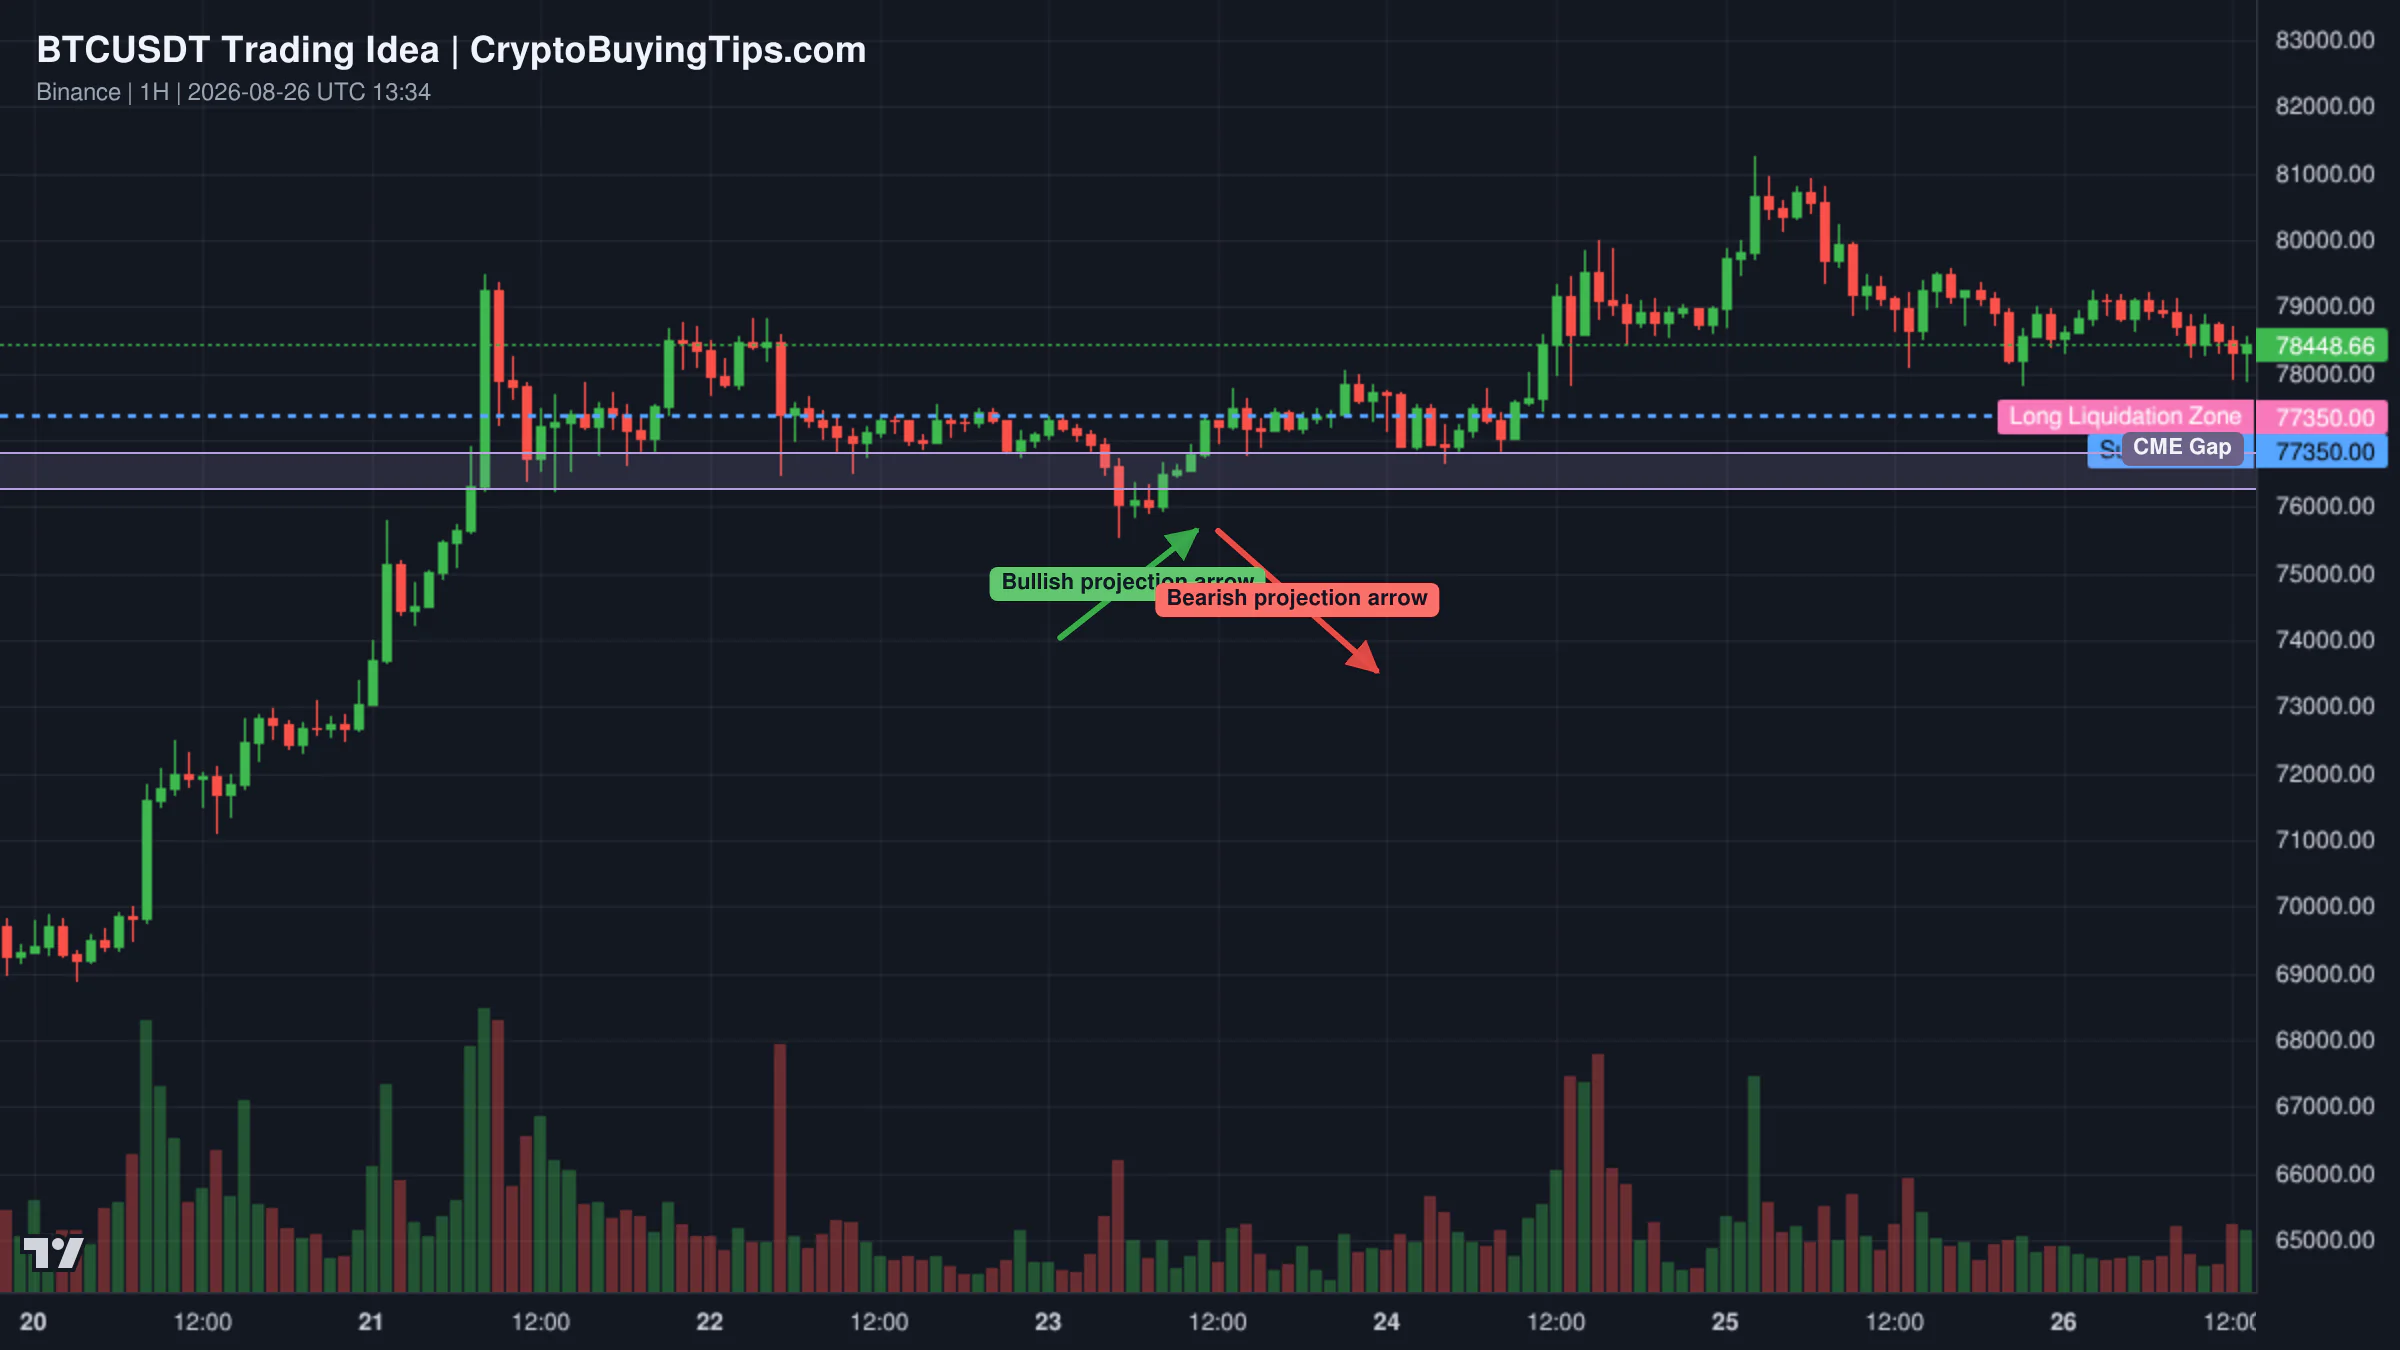
Bitcoin is currently testing a support confluence at $77,350, which aligns with cumulative long liquidation levels. The setup is bullish if the price can hold this zone and push back toward $80,000. The risk is that this area acts as a liquidity magnet, pulling the price down to fill the CME gap between $76,810 and $76,255 before any real recovery happens.

Redrawn BTCUSDT 60 trading idea chart for Bitcoin Rejected Again — Can Bulls Reclaim $80K?

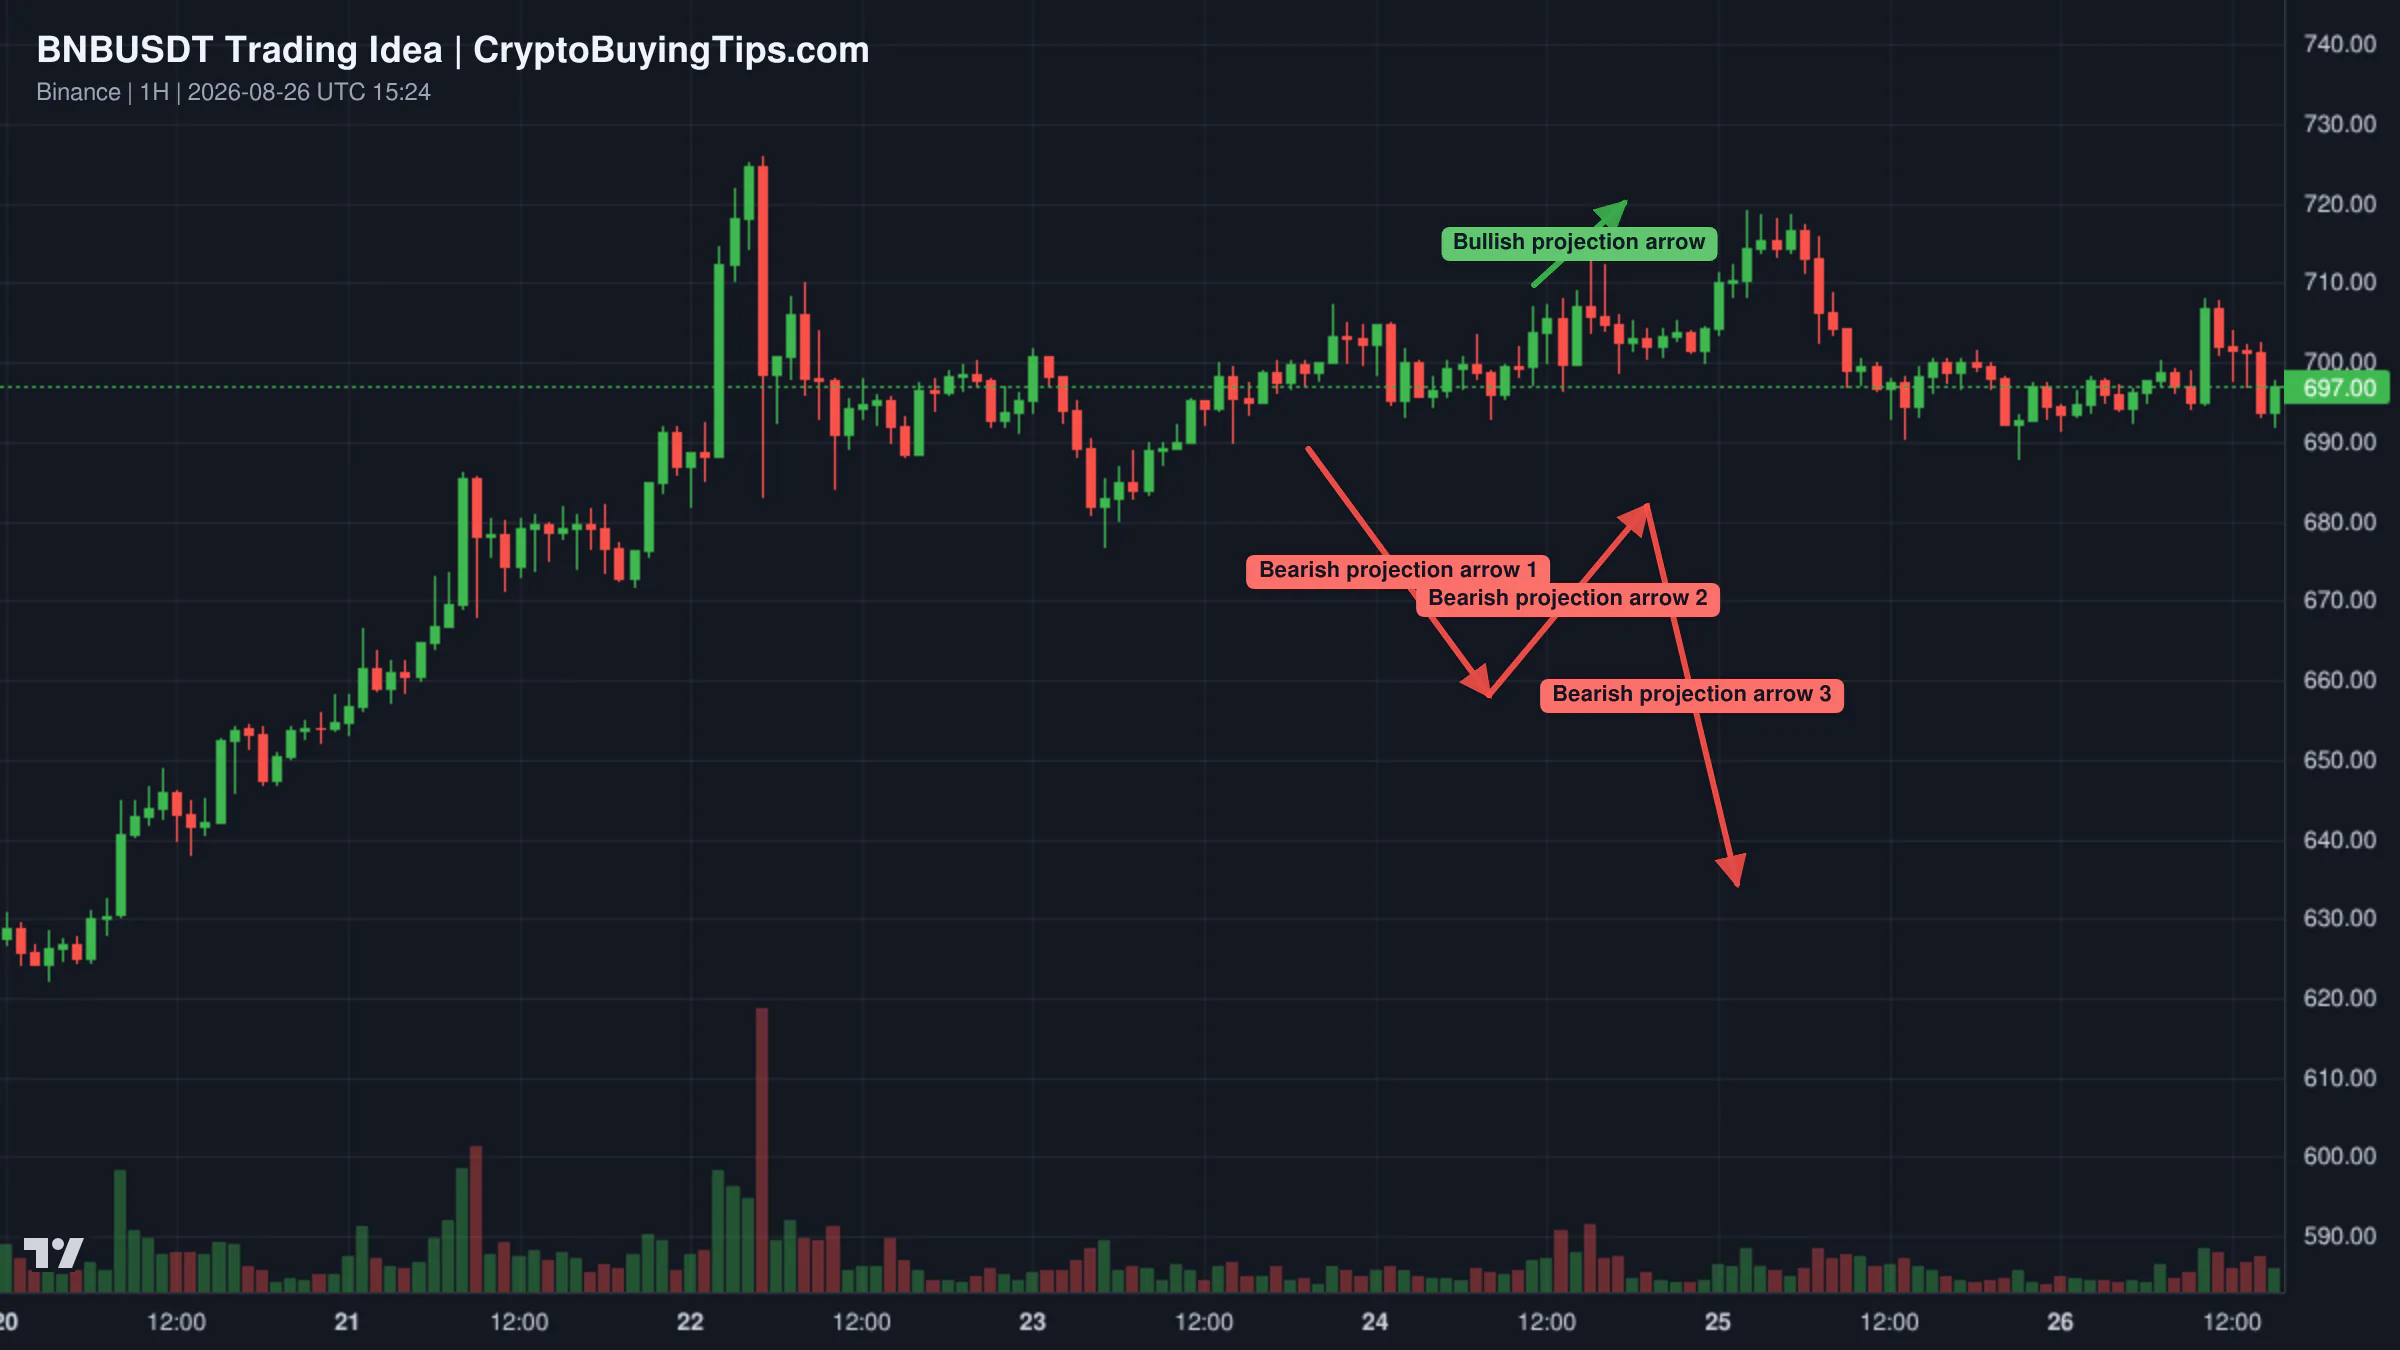
BNB looks like it may be a bull trap. On the one-hour timeframe, the price is forming a head and shoulders pattern and has shown a bearish change of character. While the daily trend is still up, the move is overstretched. Traders are watching for a pullback toward $676.56 or $663.44. A reclaim of the recent resistance would invalidate this bearish view.

Redrawn BNBUSDT 60 trading idea chart for BNBUSDT: BULLS ABOUT TO GET TRAPPED?

Zcash is reacting to the launch of the ZCSH ETF on the NYSE Arca. The technical outlook suggests one final push toward a new all-time high around $940 to $950. However, historical data from BTC and ETH ETF launches suggests a significant "sell the news" correction often follows the initial hype. A drop toward $380 is a possibility once the ETF excitement fades.

Smart Money Signals — Hyperliquid Leaderboard

Hyperliquid LONG ETH leaderboard chart

Our tracker has flagged a significant move from trader 0xe10aec, who has a 202% 30-day ROI. This trader has opened a long position in ETH at $2,695.1 with a notional value of $1.35 million. Given the trader's track record and the size of the position, this suggests a high-conviction bet that Ethereum will break out of its current range despite the lack of on-chain activity.

Altcoin Spotlight

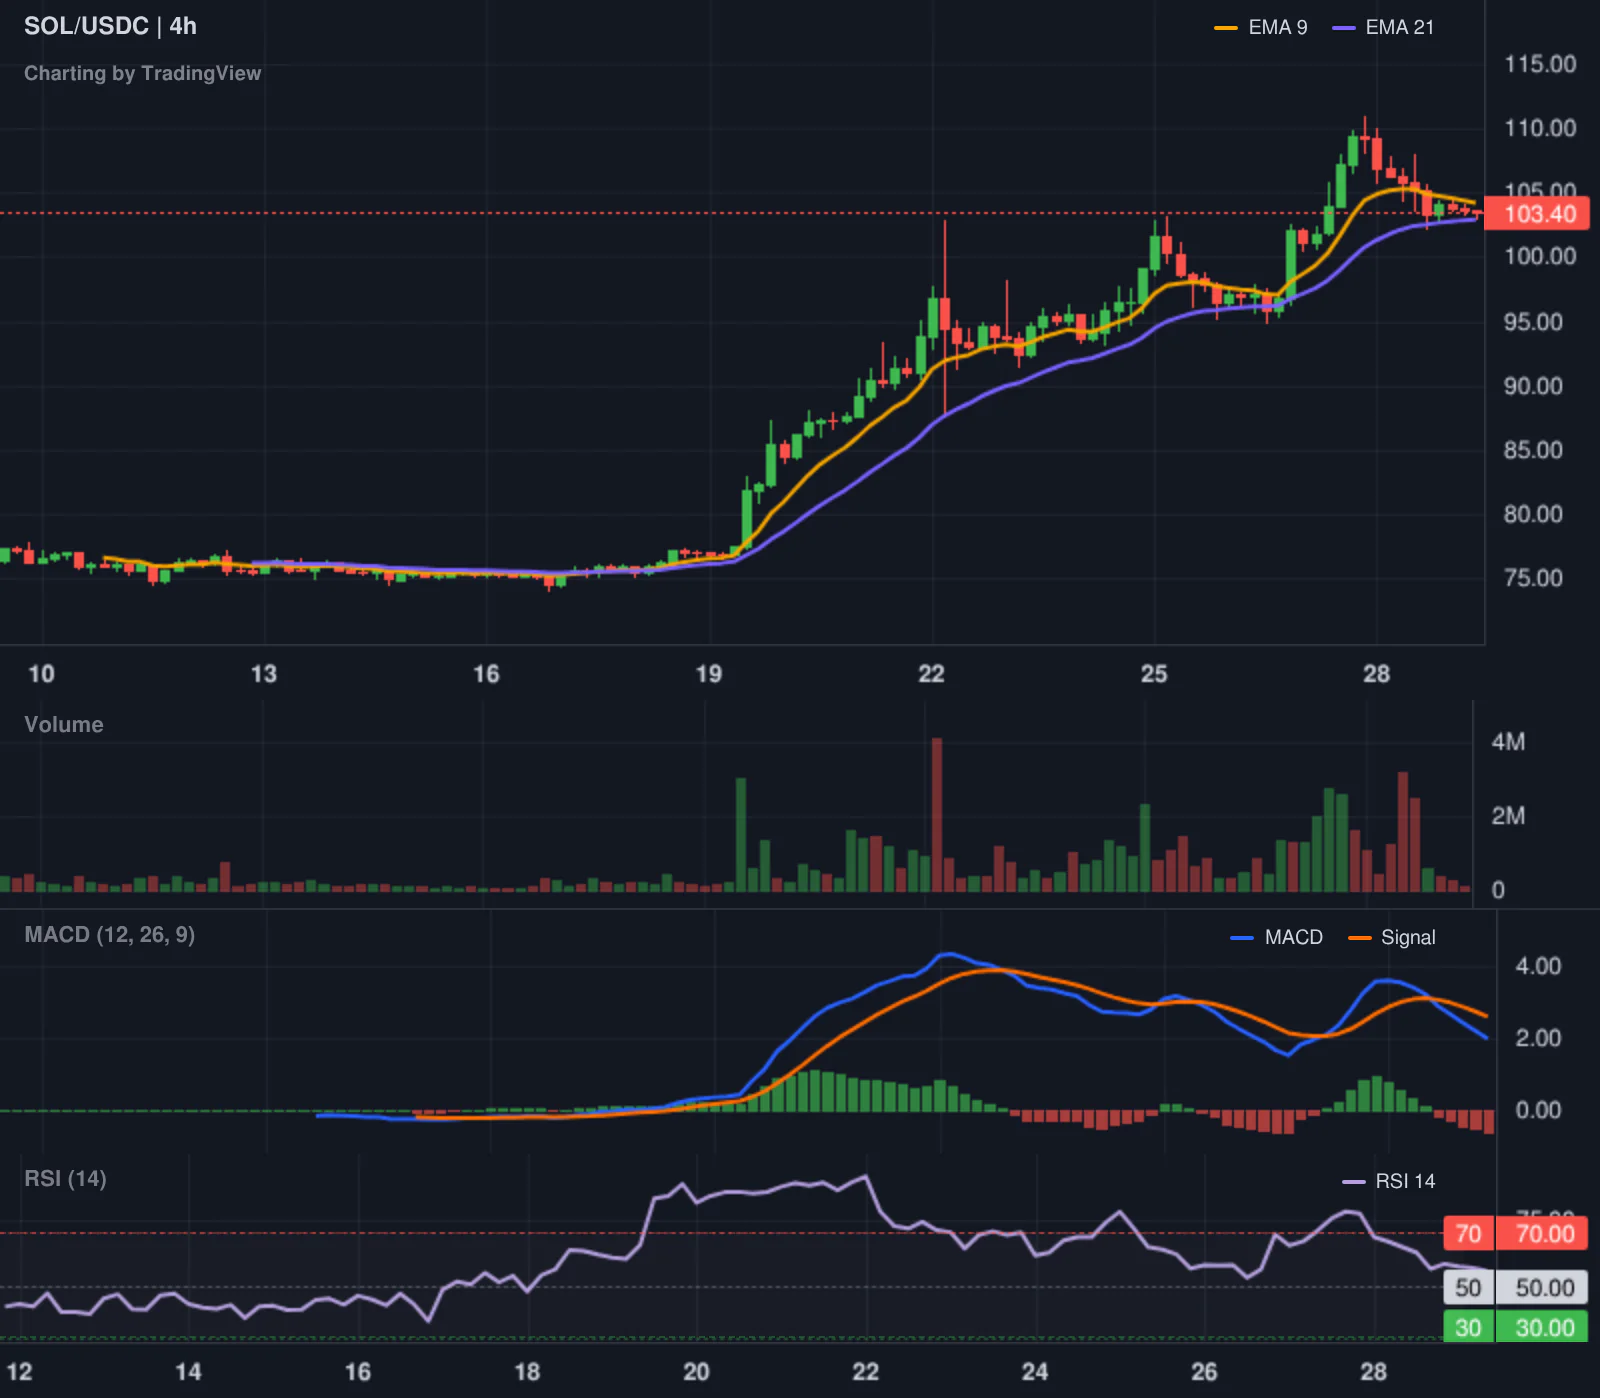
Solana is the clear winner of the day, gaining 6.37% to reach $103.99. While Bitcoin and Ethereum are grinding slowly, SOL is showing genuine strength. This move suggests that some capital is finally starting to rotate out of the flagship assets and into high-beta layer ones. If SOL can maintain this momentum, it may lead a broader altcoin recovery.

What to watch next

The immediate focus is the $80,000 level for Bitcoin. A clean break above this would likely trigger a fresh wave of FOMO, but a rejection here could lead to a violent deleveraging event given the $860 billion in derivatives. We are also watching the White House for any leaks regarding the SEC's custody rule changes. Any confirmation that institutional custody is becoming easier will provide a fundamental floor for the market. Finally, keep an eye on Ethereum gas fees. If the price continues to rise while the network remains a ghost town, the disconnect between value and utility will become impossible to ignore.