Market Overviews

Daily crypto market overviews, trend analysis, and key updates from our editorial team.

Crypto Market Overview | leverage drives action amid institutional regulatory shifts | August 27, 2026
Sigrid Voss·

Crypto Market Overview | leverage drives action amid institutional regulatory shifts | August 27, 2026

Market overview

The market is currently operating in a state of extreme greed, with the Fear and Greed Index sitting at 81. While price action remains bullish in the short term, the underlying plumbing suggests a precarious setup. The most striking data point is the massive divergence between spot and derivatives activity. Derivatives volume has hit $860 billion, which is roughly 9.7 times higher than the $88.51 billion seen in spot trading. This indicates the current move is being propelled by leverage rather than organic accumulation.

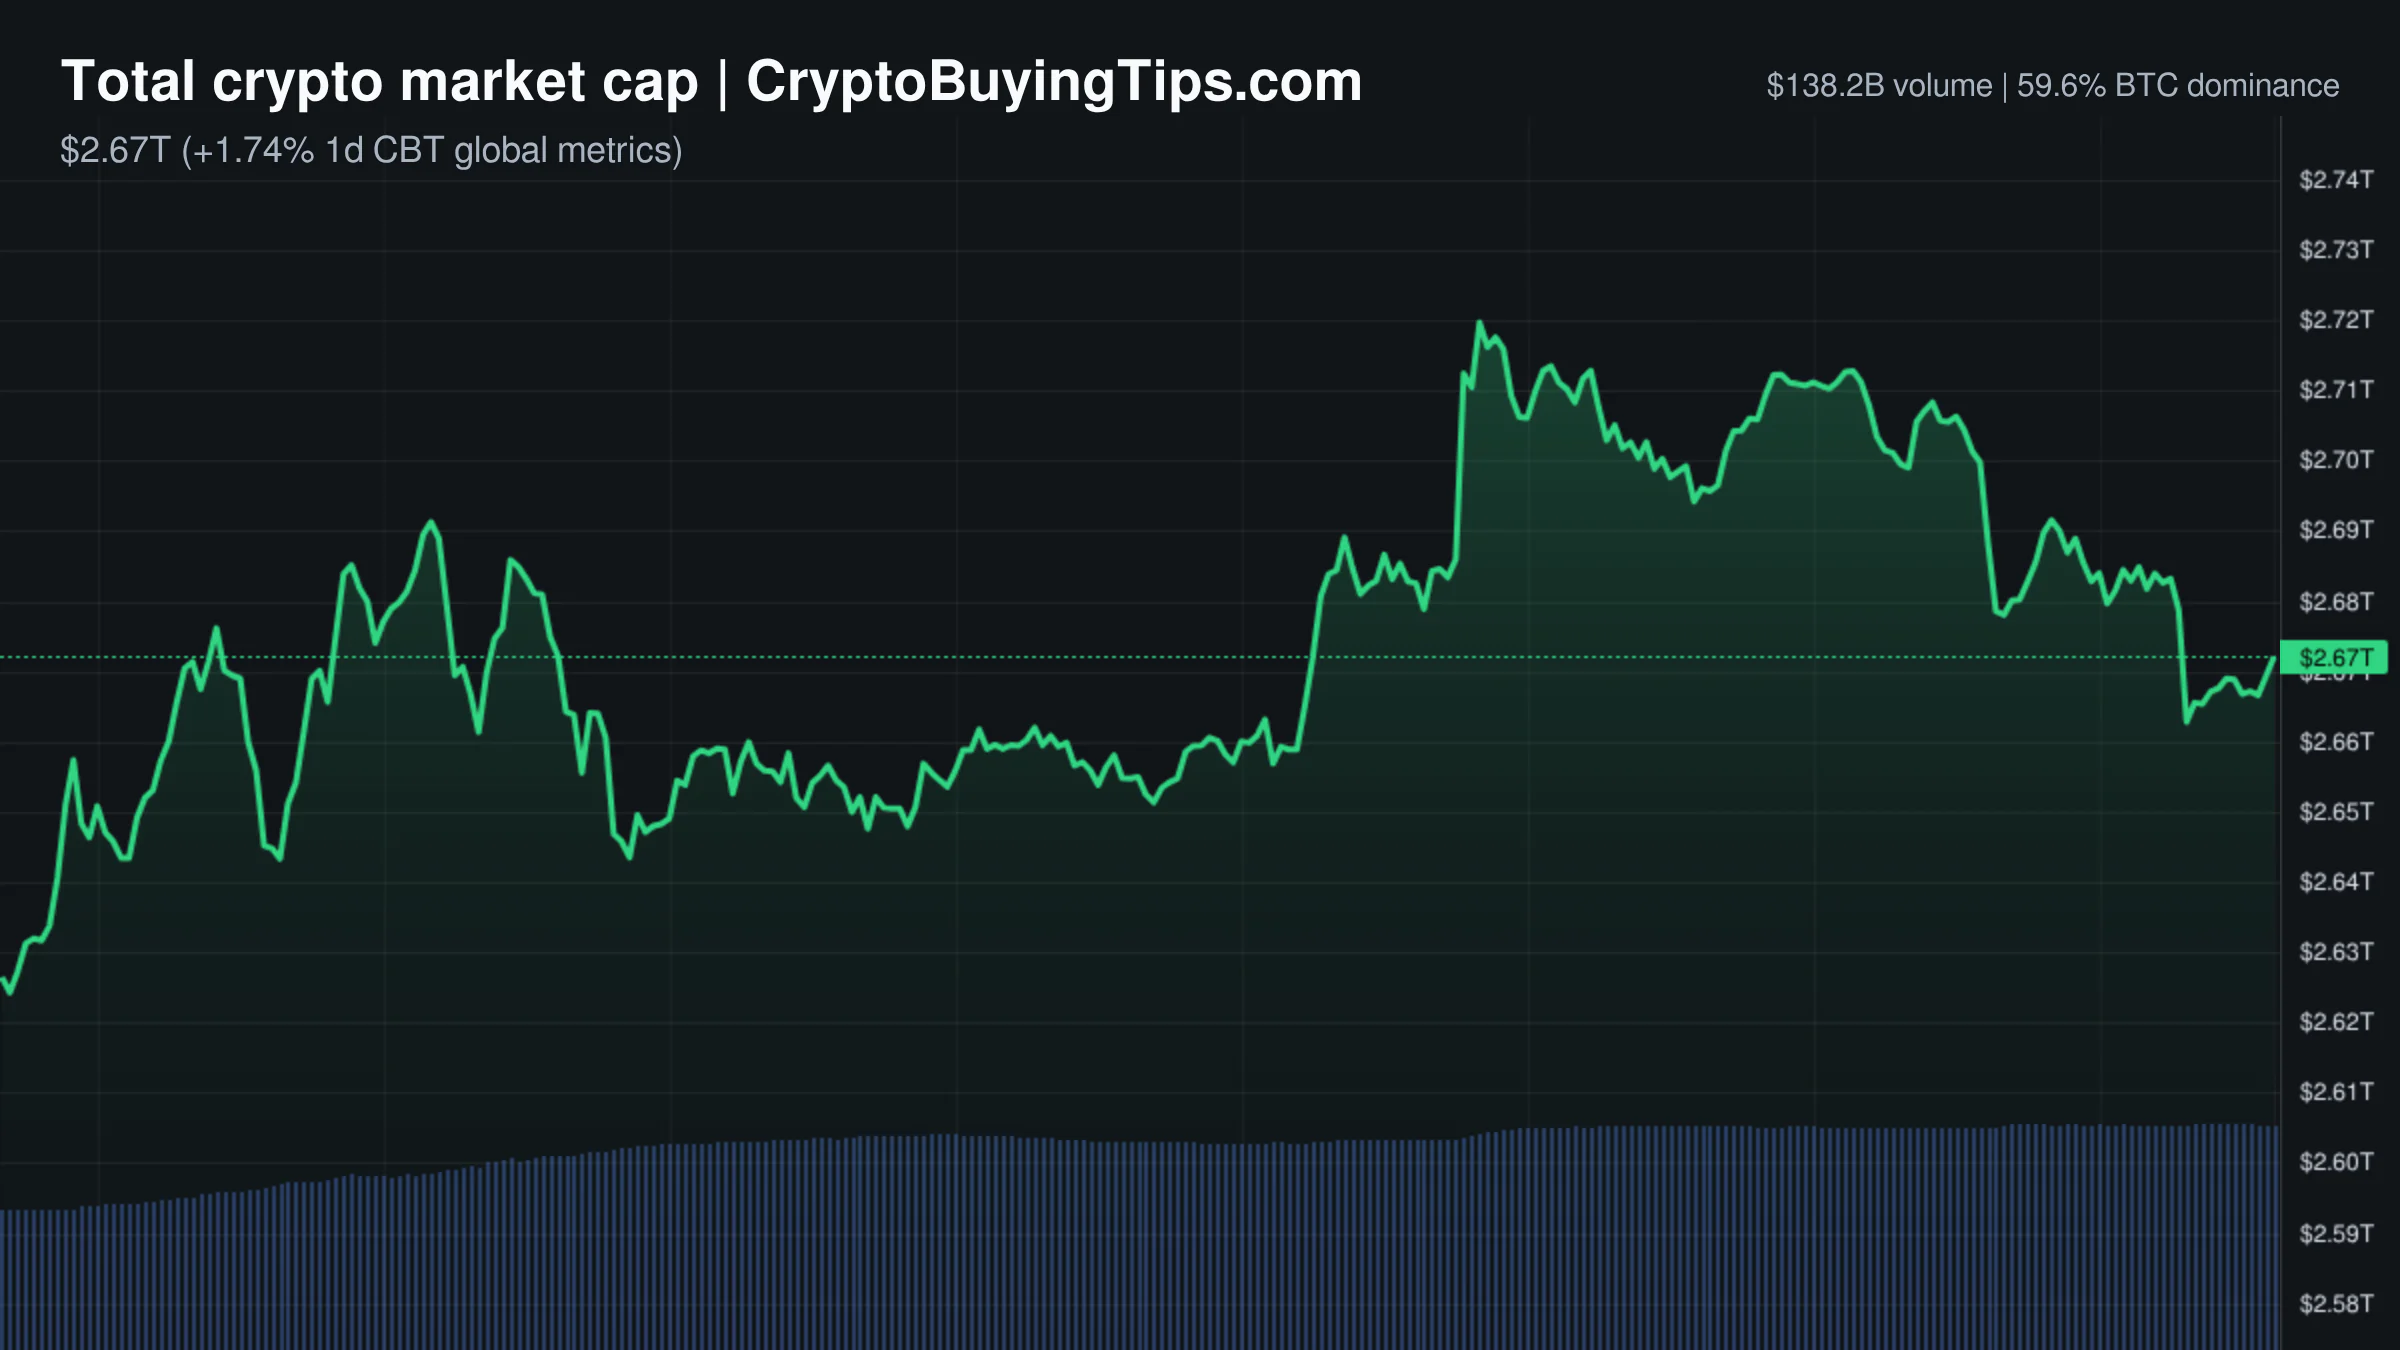
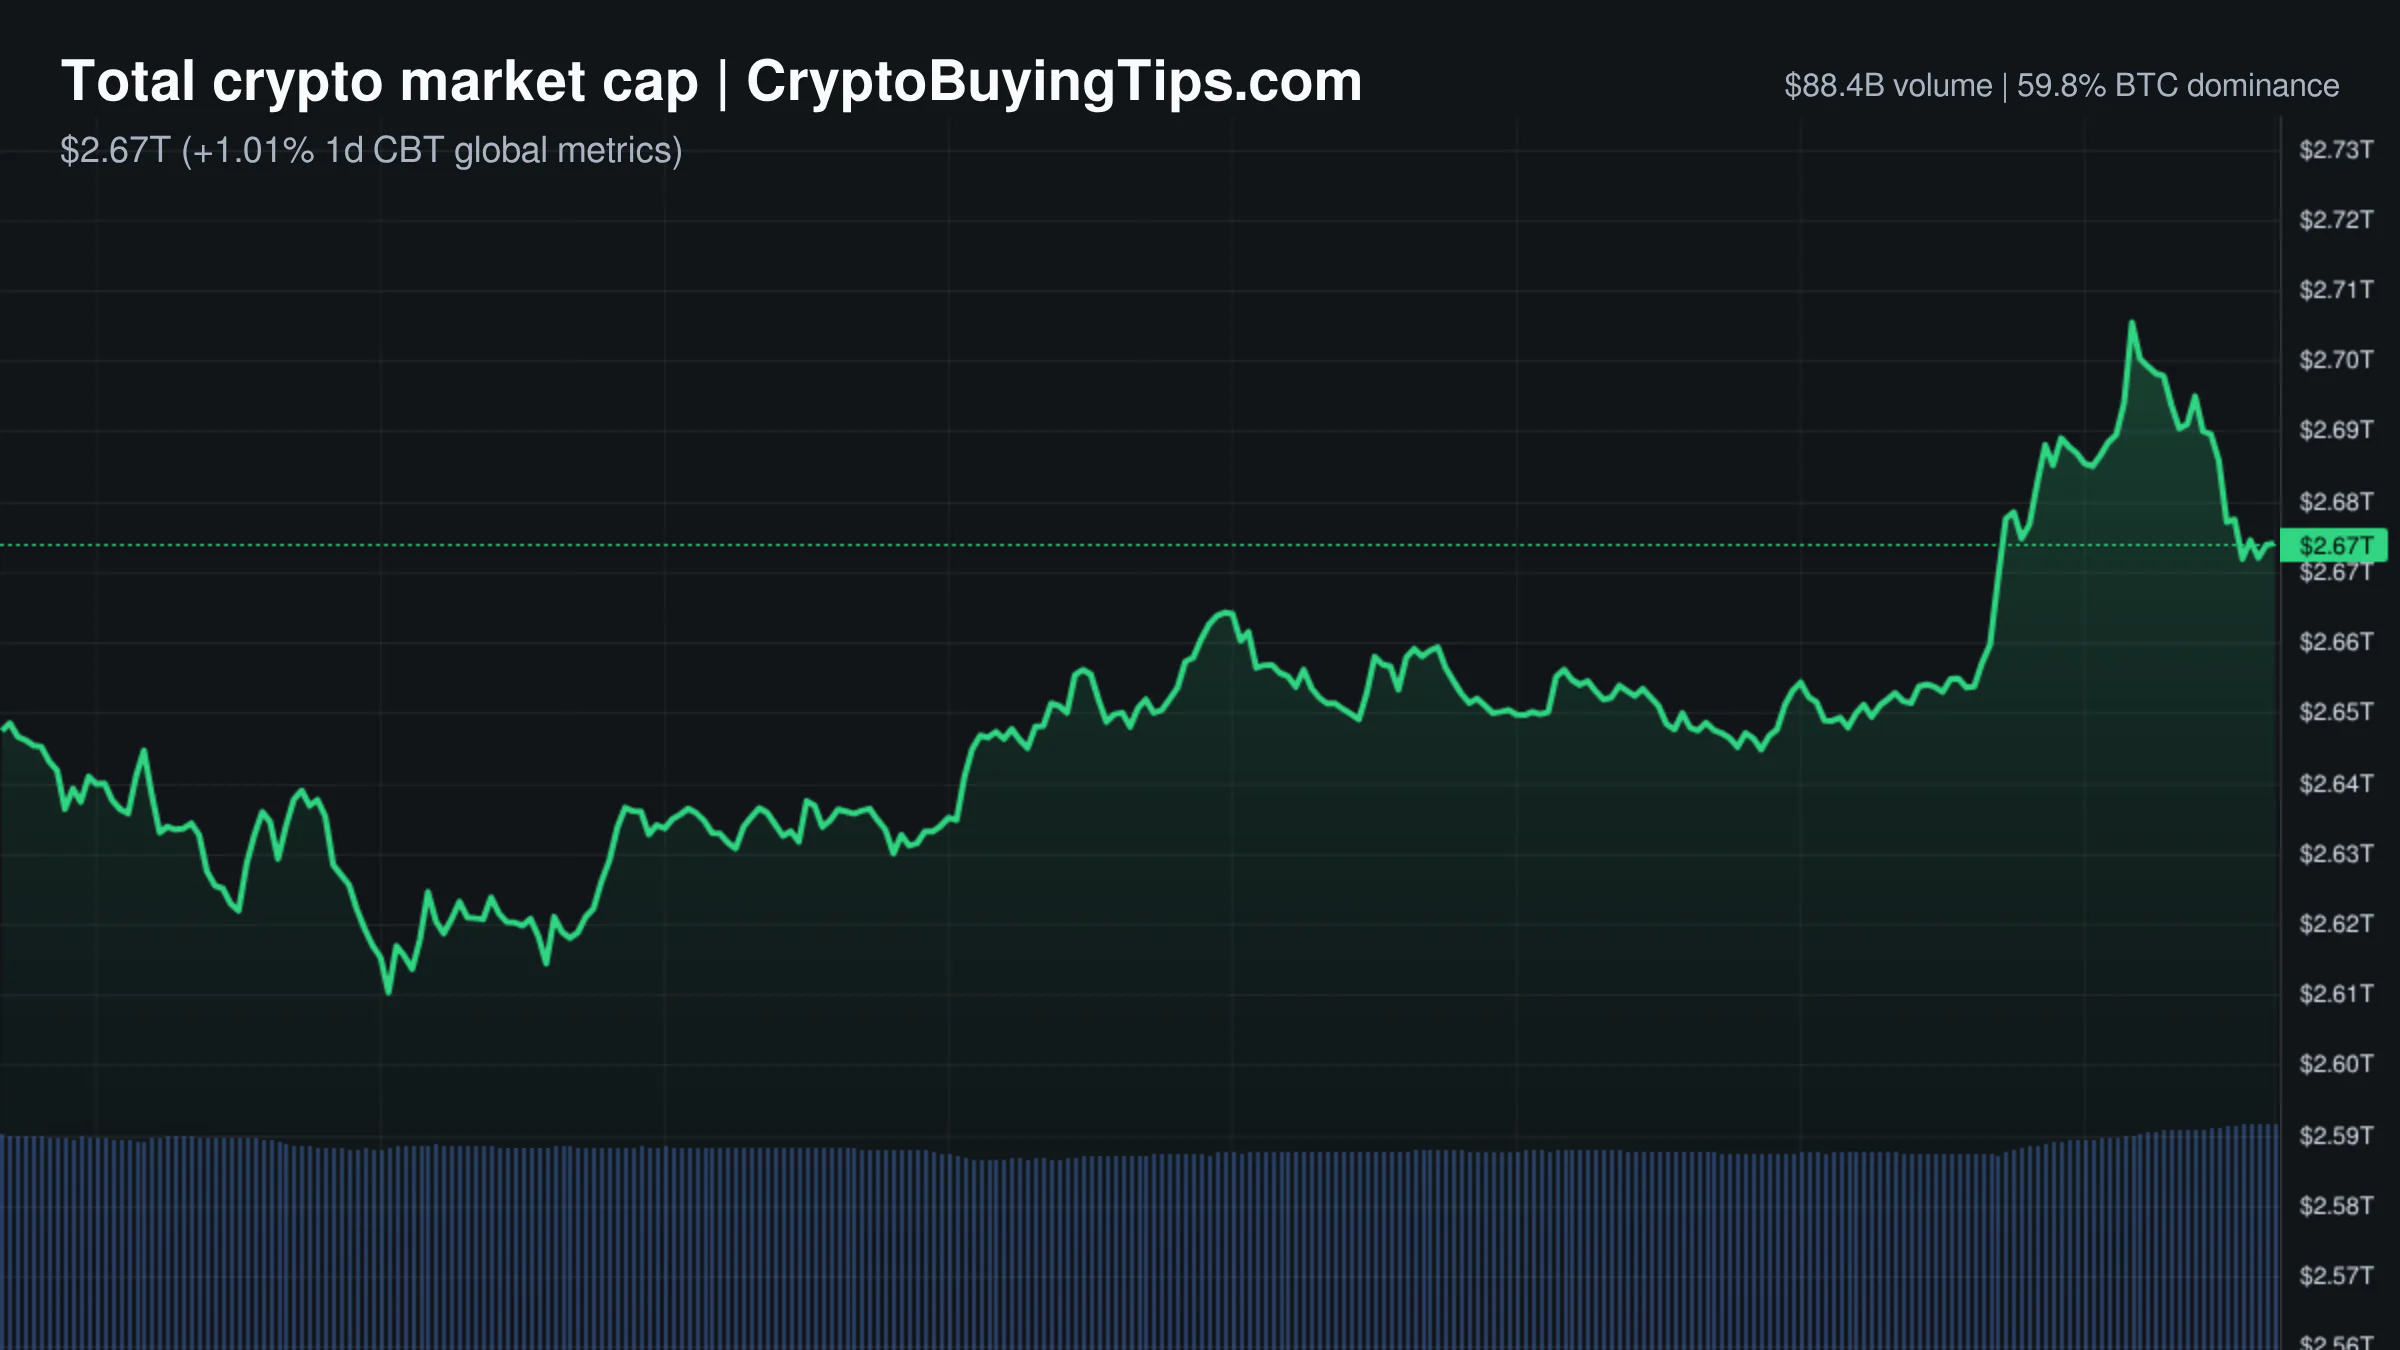
Bitcoin dominance remains high at 59.76%, confirming that we are firmly in a Bitcoin season. The Altcoin Season Index is neutral at 35, meaning capital has not yet rotated meaningfully into smaller assets. With the total market cap hovering around $2.67 trillion, the market is essentially a giant leverage bet. The high momentum is apparent, but the reliance on derivatives often precedes a flush out event when sentiment reaches these levels of euphoria.

Bitcoin and Ethereum

Bitcoin is trading at $79,556.58, continuing its push toward the psychological $80,000 barrier. The price action is supported by a narrative of increasing utility, such as the launch of BTC-backed mortgages via Better and Coinbase. However, the heavy derivatives skew suggests that the move is fragile. If Bitcoin fails to reclaim $80,000, the concentrated long positions could trigger a sharp correction.

Ethereum is priced at $2,504.52, showing a modest 24h gain of 1.45%. There is a strange contradiction in the data. While the price is rising, network activity is nearly nonexistent. Gas fees are exceptionally low, ranging between 0.11 and 0.18 Gwei. This suggests that the price increase is not being driven by actual DeFi usage or on-chain activity, but rather by broader market momentum and speculative positioning.

Top crypto prices

The top assets show a mixed but generally positive trend. Bitcoin leads at $79,556.58, while Ethereum sits at $2,504.52. BNB is flat at $706.54, and XRP has dipped slightly to $1.42. Solana is the standout performer among the majors, climbing 6.37% to $103.99. TRON is trading at $0.3357, and Hyperliquid has seen a small decline to $82.13.

News driving today's market

Regulatory movement is the primary driver today. The SEC has sent a crypto custody rule overhaul to the White House for review. This is a significant step toward institutional clarity, as it may finally define how investment advisers hold digital assets for clients. Similarly, the Bank of England is planning a new objective for stablecoins, signaling that G7 central banks are moving past the "experiment" phase and into formal integration. We previously covered tokenizing stocks trap for more background.

There is a growing tension between the Federal Reserve and the tokenization trend. Dallas Fed economists warned that the tokenized deposits concept could drain $700 billion from bank lending capacity by making deposits less sticky. In a reflexive response, thirty-nine state banking associations have formed the BankChain Alliance to build their own regulated blockchain infrastructure. The banks are essentially trying to build a walled garden to prevent the very liquidity drain the Fed is worried about.

Institutional adoption is also appearing in the plumbing. Taurus has linked digital asset platforms to the Swift blockchain ledger, which allows institutional clients to move assets through the world's most established financial messaging system. This removes a layer of friction for the traditional finance sector.

Social intelligence

On-chain and social data show a mix of whale aggression and operational risk. Grant Cardone has announced an increase in BTC allocation for a real estate project, moving from 350 to 900 tokens. This is a classic "risk-on" signal from a high-profile investor. Geopolitically, a deal between Iran and Oman regarding the Strait of Hormuz has reduced immediate tensions around a global shipping chokepoint, which generally supports a higher risk appetite across all assets.

However, there are technical warnings. Core Lightning maintainers have told node operators to upgrade or go offline due to vulnerabilities reported by AI. It is a bit ironic that AI is now finding bugs faster than humans can patch them. In the derivatives space, the "pension-usdt.eth" whale suffered a $23.9 million loss after a massive ETH short was liquidated. The whale has already pivoted, opening a 2x long on ENA, proving that in this market, the only thing faster than a liquidation is the desire to bet again.

Trading ideas worth watching

Bitcoin is currently testing a support confluence at $77,350, which aligns with cumulative long liquidation levels. The setup is bullish if the price can hold this zone and push back toward $80,000. The risk is that this area acts as a liquidity magnet, pulling the price down to fill the CME gap between $76,810 and $76,255 before any real recovery happens.
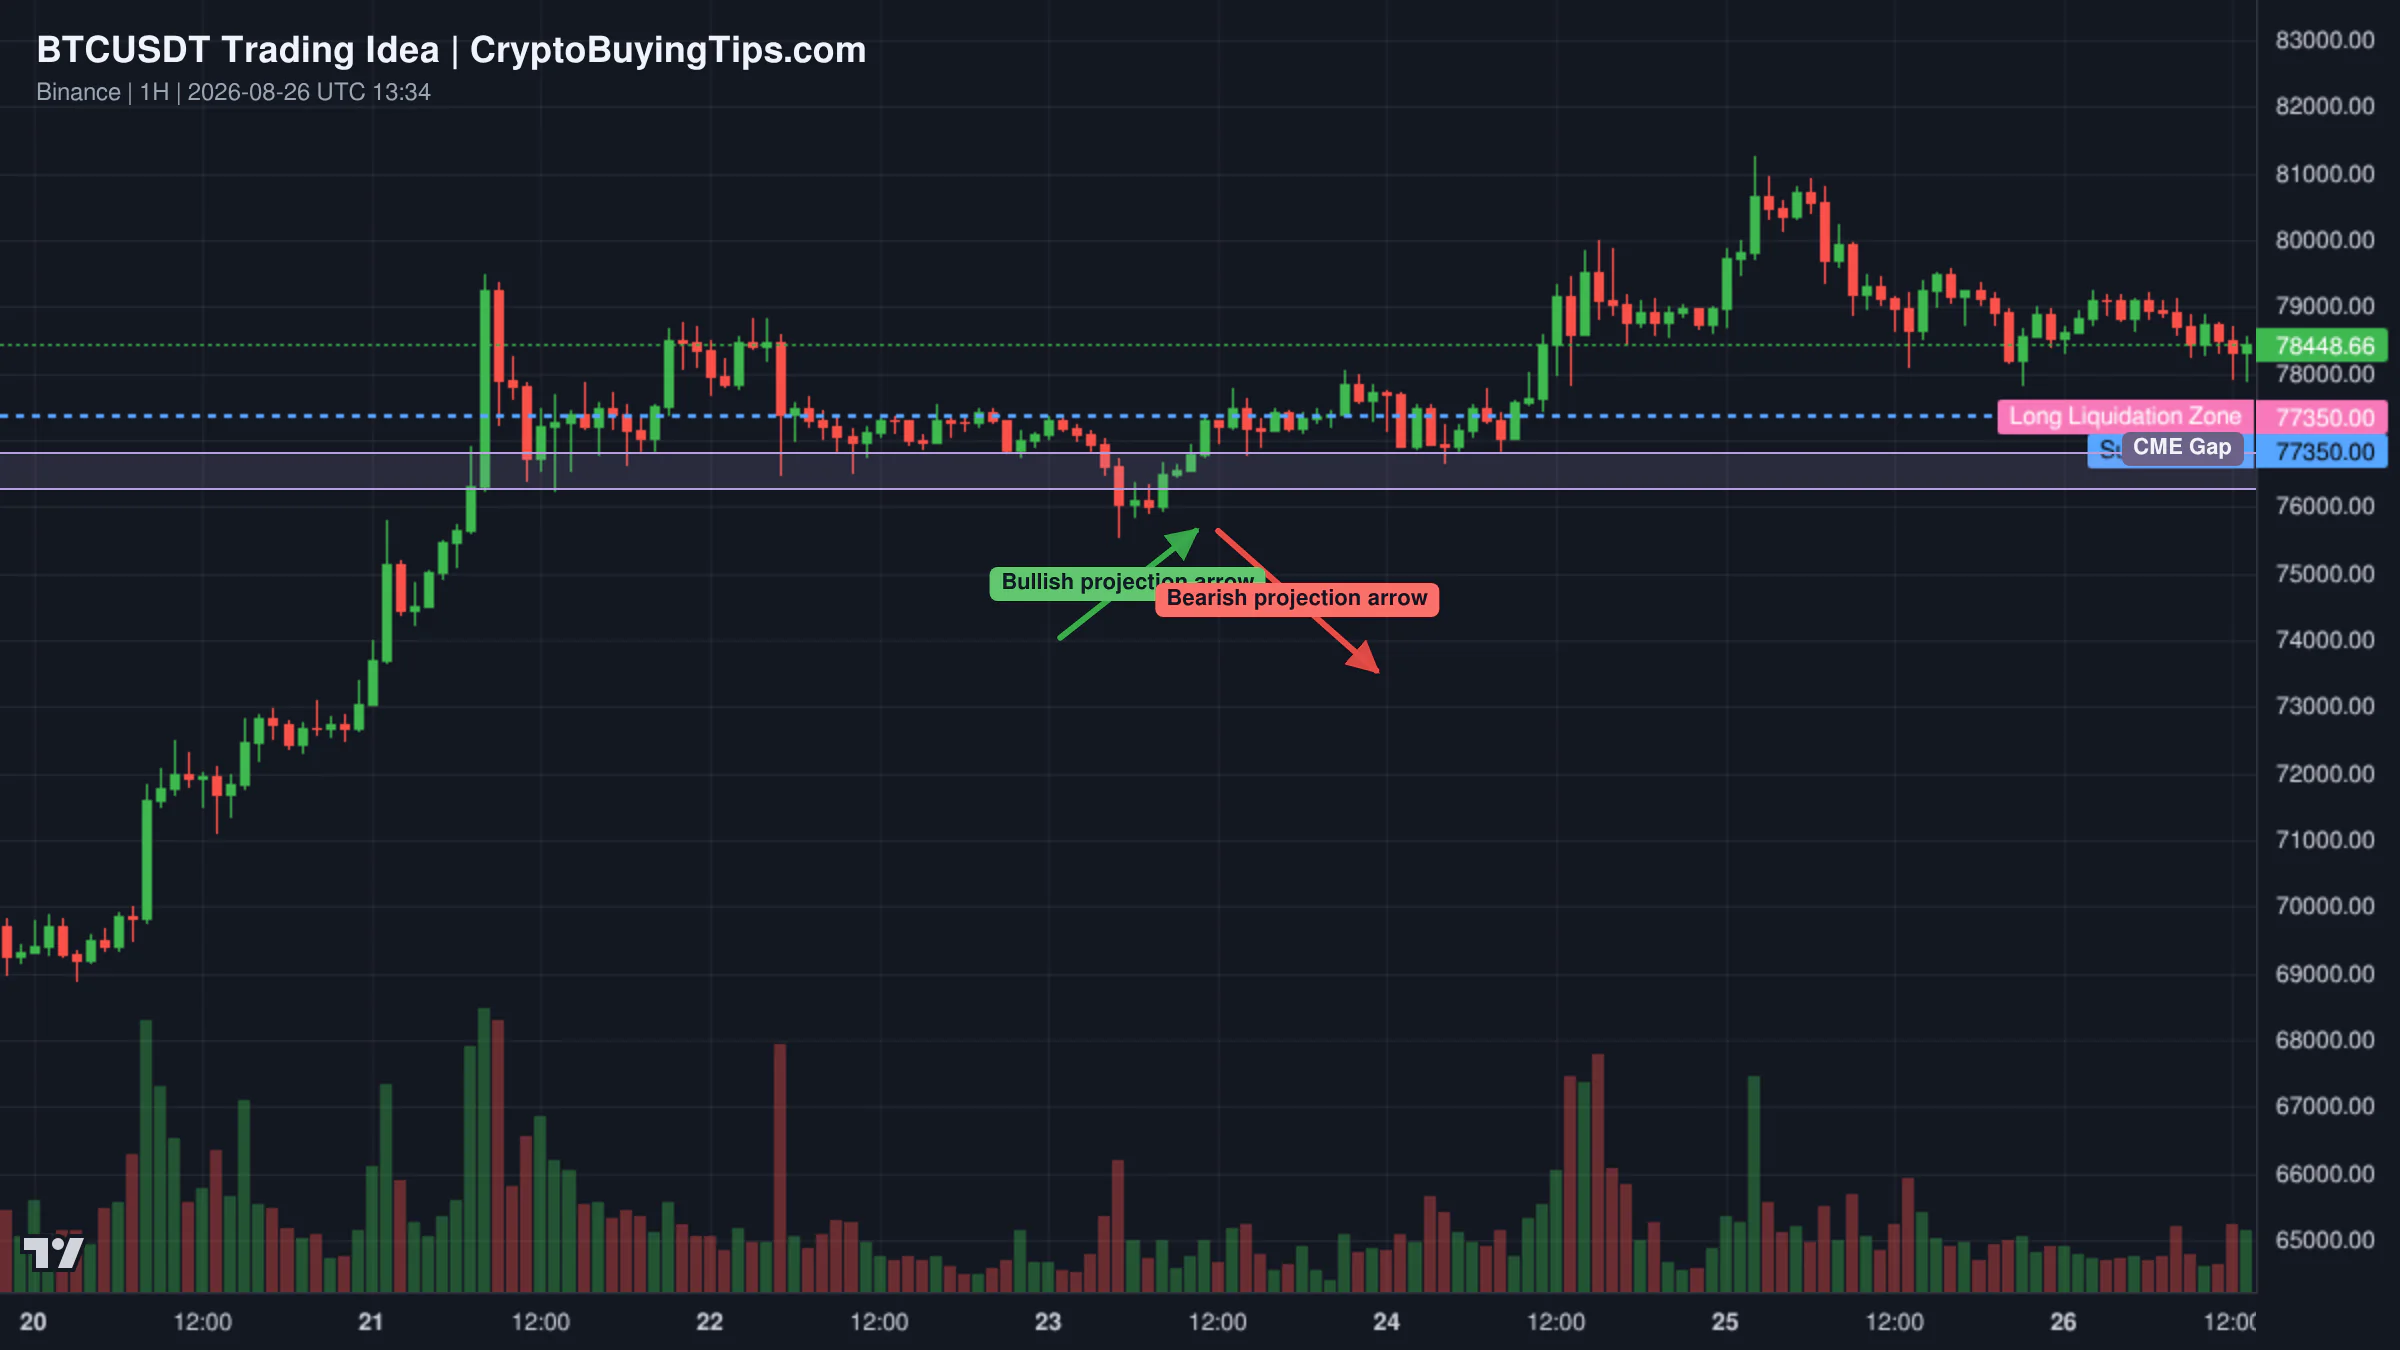
Redrawn BTCUSDT 60 trading idea chart for Bitcoin Rejected Again — Can Bulls Reclaim $80K?

BNB looks like it may be a bull trap. On the one-hour timeframe, the price is forming a head and shoulders pattern and has shown a bearish change of character. While the daily trend is still up, the move is overstretched. Traders are watching for a pullback toward $676.56 or $663.44. A reclaim of the recent resistance would invalidate this bearish view.
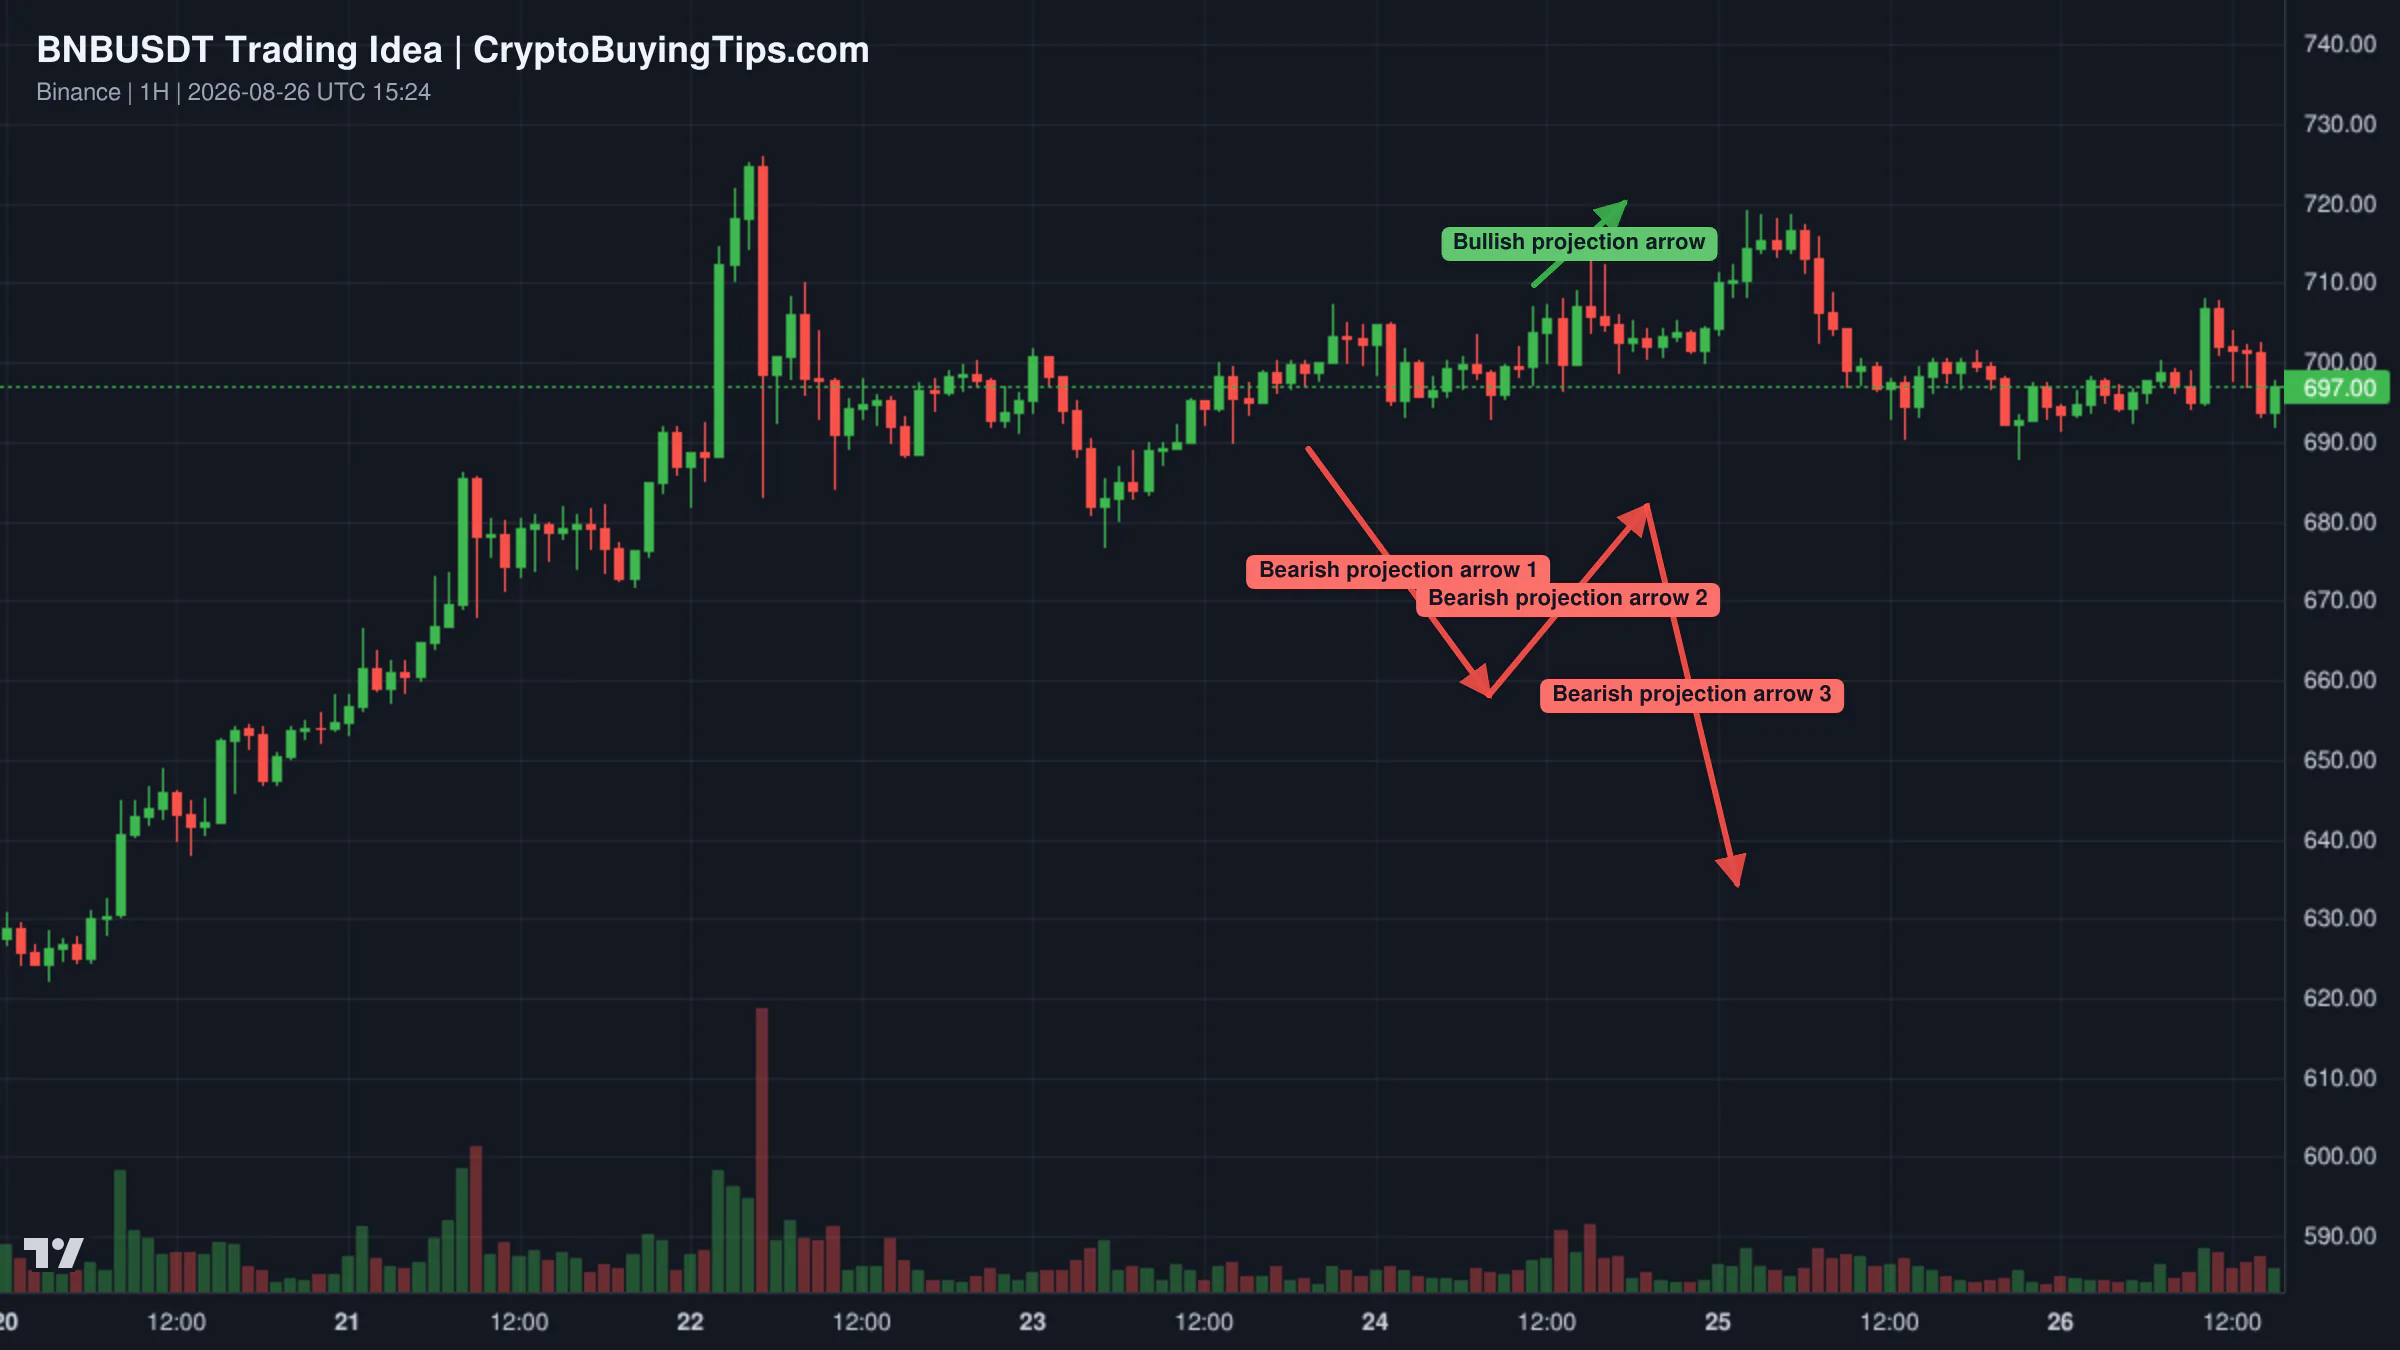
Redrawn BNBUSDT 60 trading idea chart for BNBUSDT: BULLS ABOUT TO GET TRAPPED?

Zcash is reacting to the launch of the ZCSH ETF on the NYSE Arca. The technical outlook suggests one final push toward a new all-time high around $940 to $950. However, historical data from BTC and ETH ETF launches suggests a significant "sell the news" correction often follows the initial hype. A drop toward $380 is a possibility once the ETF excitement fades.

Smart Money Signals — Hyperliquid Leaderboard
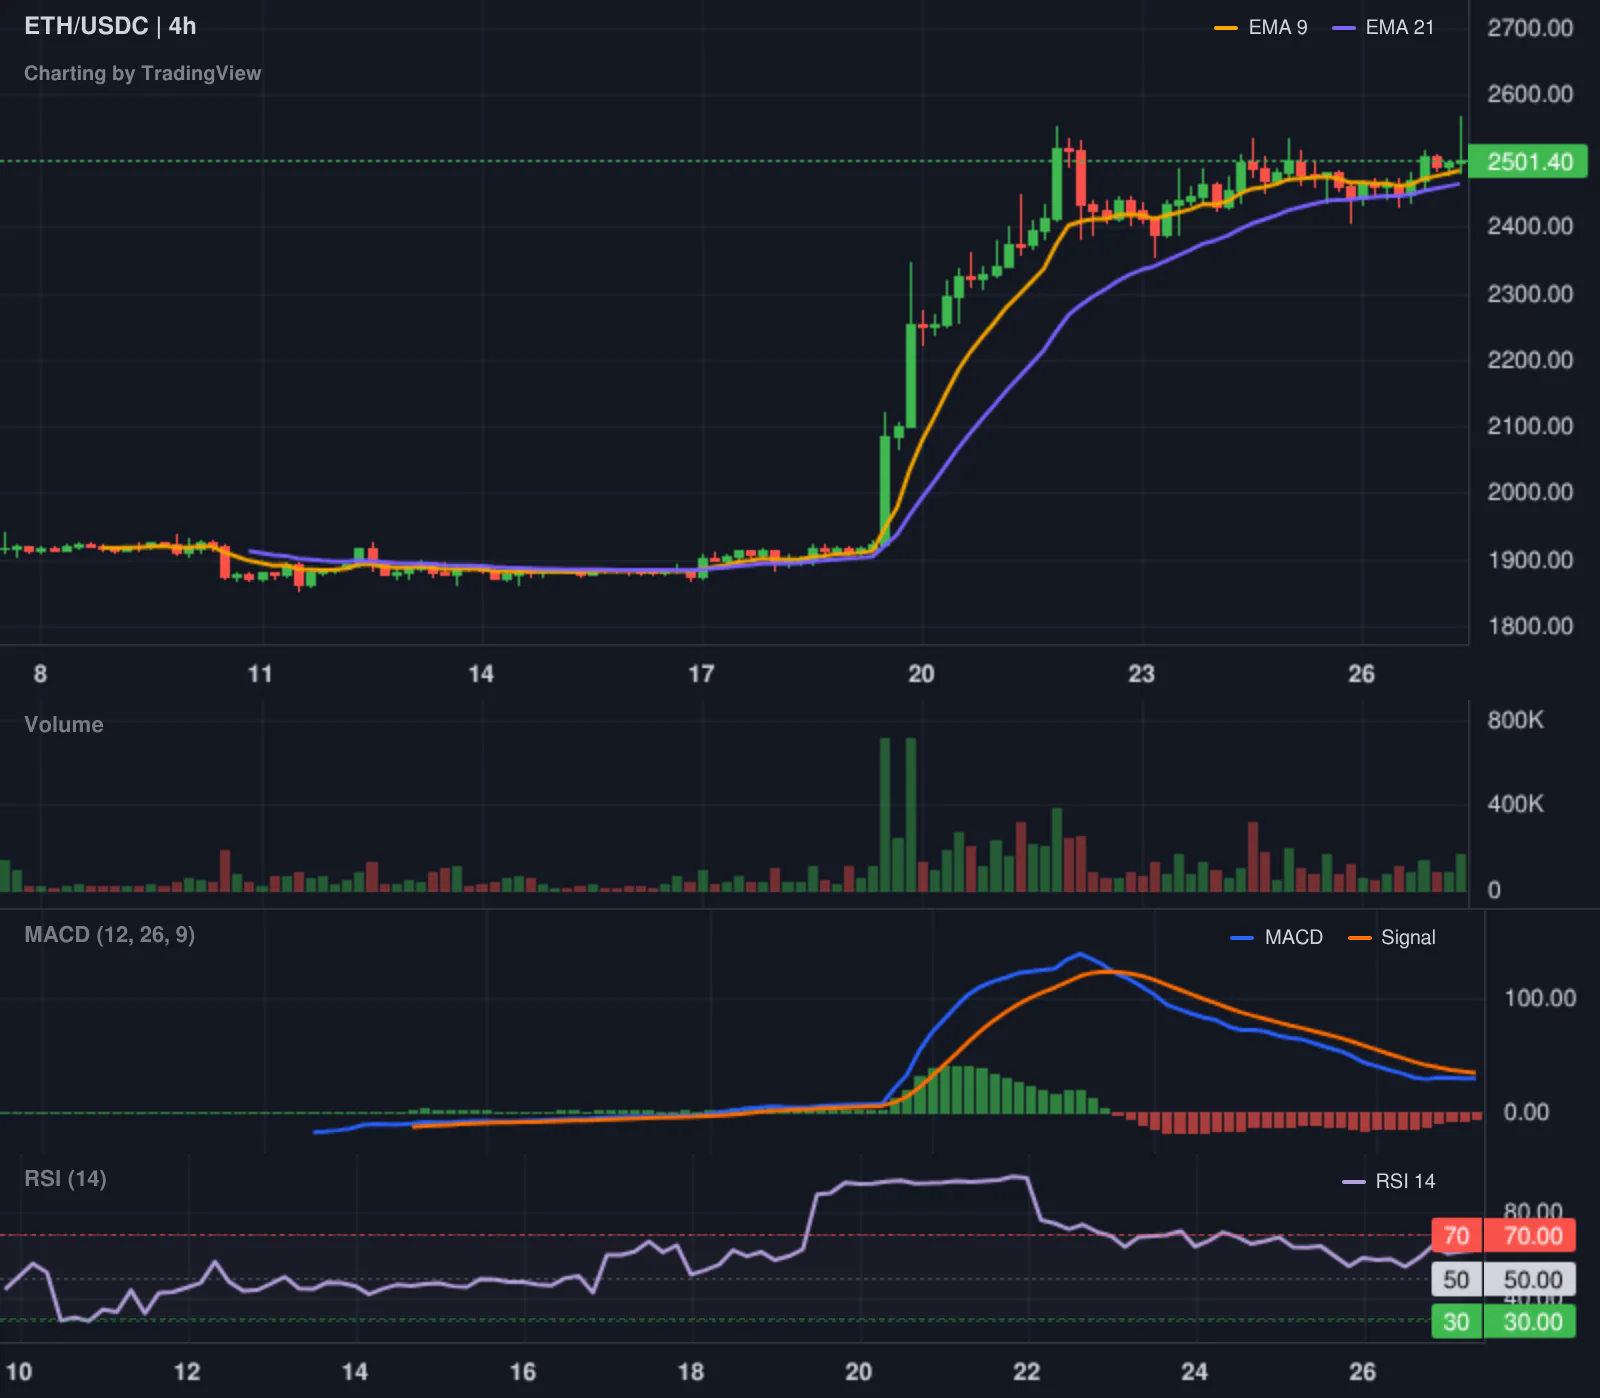
Hyperliquid LONG ETH leaderboard chart

Our tracker has flagged a significant move from trader 0xe10aec, who has a 202% 30-day ROI. This trader has opened a long position in ETH at $2,695.1 with a notional value of $1.35 million. Given the trader's track record and the size of the position, this suggests a high-conviction bet that Ethereum will break out of its current range despite the lack of on-chain activity.

Altcoin Spotlight

Solana is the clear winner of the day, gaining 6.37% to reach $103.99. While Bitcoin and Ethereum are grinding slowly, SOL is showing genuine strength. This move suggests that some capital is finally starting to rotate out of the flagship assets and into high-beta layer ones. If SOL can maintain this momentum, it may lead a broader altcoin recovery.

What to watch next

The immediate focus is the $80,000 level for Bitcoin. A clean break above this would likely trigger a fresh wave of FOMO, but a rejection here could lead to a violent deleveraging event given the $860 billion in derivatives. We are also watching the White House for any leaks regarding the SEC's custody rule changes. Any confirmation that institutional custody is becoming easier will provide a fundamental floor for the market. Finally, keep an eye on Ethereum gas fees. If the price continues to rise while the network remains a ghost town, the disconnect between value and utility will become impossible to ignore.
Crypto Market Overview | Extreme greed meets collapsing volume amid institutional focus | August 26, 2026
Sigrid Voss·

Crypto Market Overview | Extreme greed meets collapsing volume amid institutional focus | August 26, 2026

Market overview

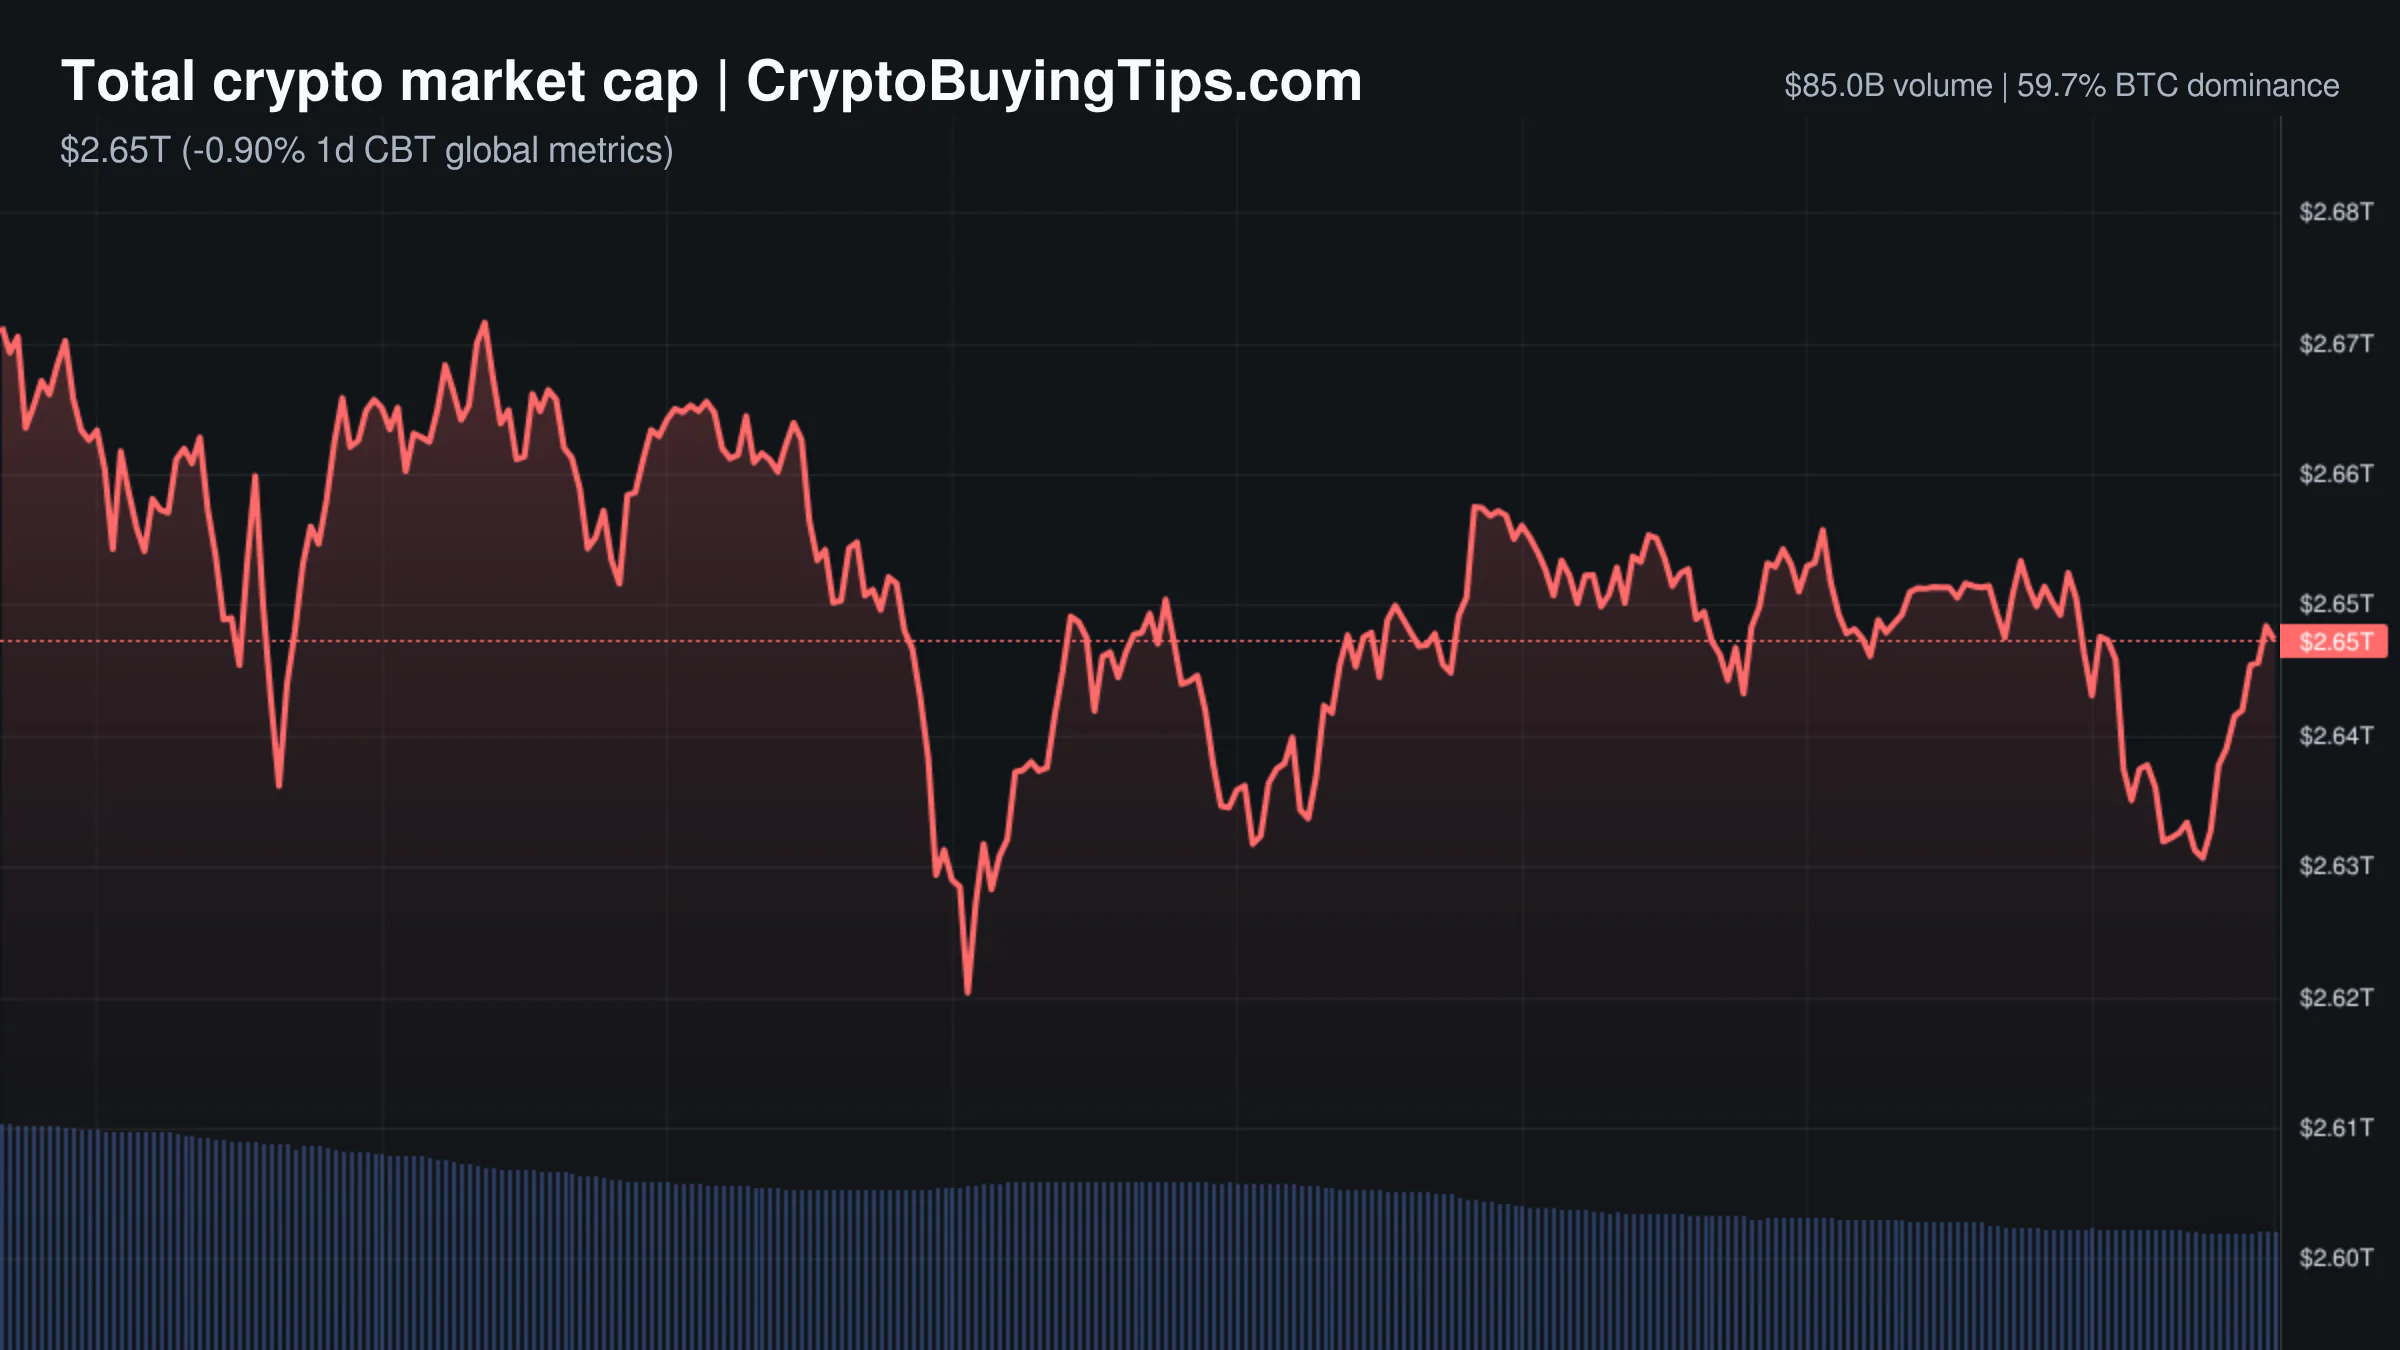
The market is currently in a state of extreme greed, which is a lovely way of saying everyone is terrified of missing out while they stop actually trading. The Fear and Greed Index sits at 81, yet the actual activity data suggests a sudden, systemic bout of hesitation. Total market cap is roughly $2.95 trillion, but the 24 hour volume has cratered. Spot volume, derivatives, and stablecoin activity have all dropped by more than 33 percent. When volume vanishes while sentiment remains euphoric, it usually means the market is holding its breath.

This lack of conviction is most evident on the Ethereum network. Gas fees have dropped to between 0.07 and 0.13 Gwei. For those unfamiliar with the numbers, that is essentially a ghost town. There is almost no on chain congestion, which suggests that DeFi and NFT activity have stalled. We are seeing a market that is priced for perfection but currently lacks the liquidity to move in any meaningful direction.

Bitcoin dominance is holding strong at nearly 60 percent. This confirms that we are firmly in a Bitcoin season. The Altcoin Season Index is at 39, which is neutral, but the reality is that most altcoins are simply failing to keep pace with the flagship asset. Capital is consolidating, and the appetite for riskier bets has dimmed, even if the sentiment indicators refuse to acknowledge it.

Bitcoin and Ethereum

Bitcoin is trading at $78,771.92, down 0.80 percent over the last day. It is a minor correction, but it happens in a vacuum of volume. The price is stuck in a range where institutional buyers seem content to hold, but new buyers are not rushing in. This creates a fragile equilibrium. If the bid side thins out further, these small dips could become disorderly quite fast.

Ethereum is faring slightly better on a percentage basis, down 0.48 percent to $2,470.96, but its structural position is weaker. The dominance data agrees with our previous read that capital is rotating out of ETH and into Bitcoin. The network is quiet, and the price is struggling to find a catalyst that doesn't involve a general market lift.

The divergence between the two is stark. Bitcoin is the institutional safe haven of choice, while Ethereum is currently a corporate project waiting for its utility to catch up with its valuation. With dominance shifting toward the top, ETH is fighting a losing battle for market share.

Top crypto prices

Outside the big two, the results are mixed. BNB is one of the few gainers, up 0.57 percent to $703.85. It continues to act as a hedge against broader market volatility, likely supported by its internal ecosystem demand. Hyperliquid is the standout performer among the top ten, climbing 2.92 percent to $83.25.

The rest of the pack is sliding. XRP has dropped 3.70 percent to $1.42, and Solana is down 2.25 percent to $97.39. TRON also saw a decline of 1.84 percent, closing at $0.3362. The trend is clear. Unless an asset has a specific, immediate reason to rise, it is being dragged down by the general lack of liquidity.

News driving today's market

The biggest structural news is the formation of the BankChain Alliance. Thirty nine US state banking associations are planning a nationwide blockchain network for a 2027 launch. This is not a retail play. It is a systemic move to integrate tokenized deposits and stablecoins into the regulated banking system. While this is bullish for the long term, it also confirms that the "institutional adoption" narrative is moving toward permissioned, controlled rails rather than the wild west of public DeFi. This shift toward active crypto management suggests that the big money wants the tech, but they want it on their own terms.

On the regulatory front, the GENIUS Act is creating friction. The Blockchain Association has warned that extending KYC requirements to peer to peer stablecoin transfers could cripple the industry. If regulators force identity checks on every single transfer, the core utility of stablecoins as a fluid medium of exchange vanishes. This is a genuine risk to market structure that the "extreme greed" sentiment is currently ignoring.

We are also seeing a push into real world assets. Bitwise and Coinbase are launching tokenized stock portfolios, allowing non US investors to hold assets in their own wallets. While this sounds innovative, we previously warned that tokenizing stocks trap often means centralized receipts with a blockchain label. The actual utility is still being debated, but the institutional momentum is undeniable.

Other notable developments include India planning tokenized corporate bonds using a wholesale CBDC and LayerZero unveiling new trading infrastructure backed by Citadel Securities. Both signals point to a future where the plumbing of finance is on chain, even if the tokens themselves are not seeing a price surge today.

Social intelligence

The social data provides a sharp contrast to the price action. BlackRock has reportedly executed $5 billion in tax deferred Bitcoin to ETF swaps. This is a massive amount of capital moving into the system, yet it hasn't triggered a price rip. It suggests that the institutional "buy" is now a slow, methodical process rather than a speculative frenzy.

Whale activity is also leaning bullish. On chain analyst @lookonchain flagged Garrett Jin, who added another 600 BTC to his long position after returning to profit. His total position now sits at 1,868 BTC, valued at roughly $147 million. When whales add to positions during a volume collapse, it usually indicates they view the current dip as a gift.

Meanwhile, TRON is claiming a victory in adoption. According to @lookonchain, TRX reached 400 million users faster than both Bitcoin and Ethereum. While user numbers are a vanity metric if they aren't spending money, it does show that the network has a reach that the more "prestigious" chains lack.

Trading ideas worth watching

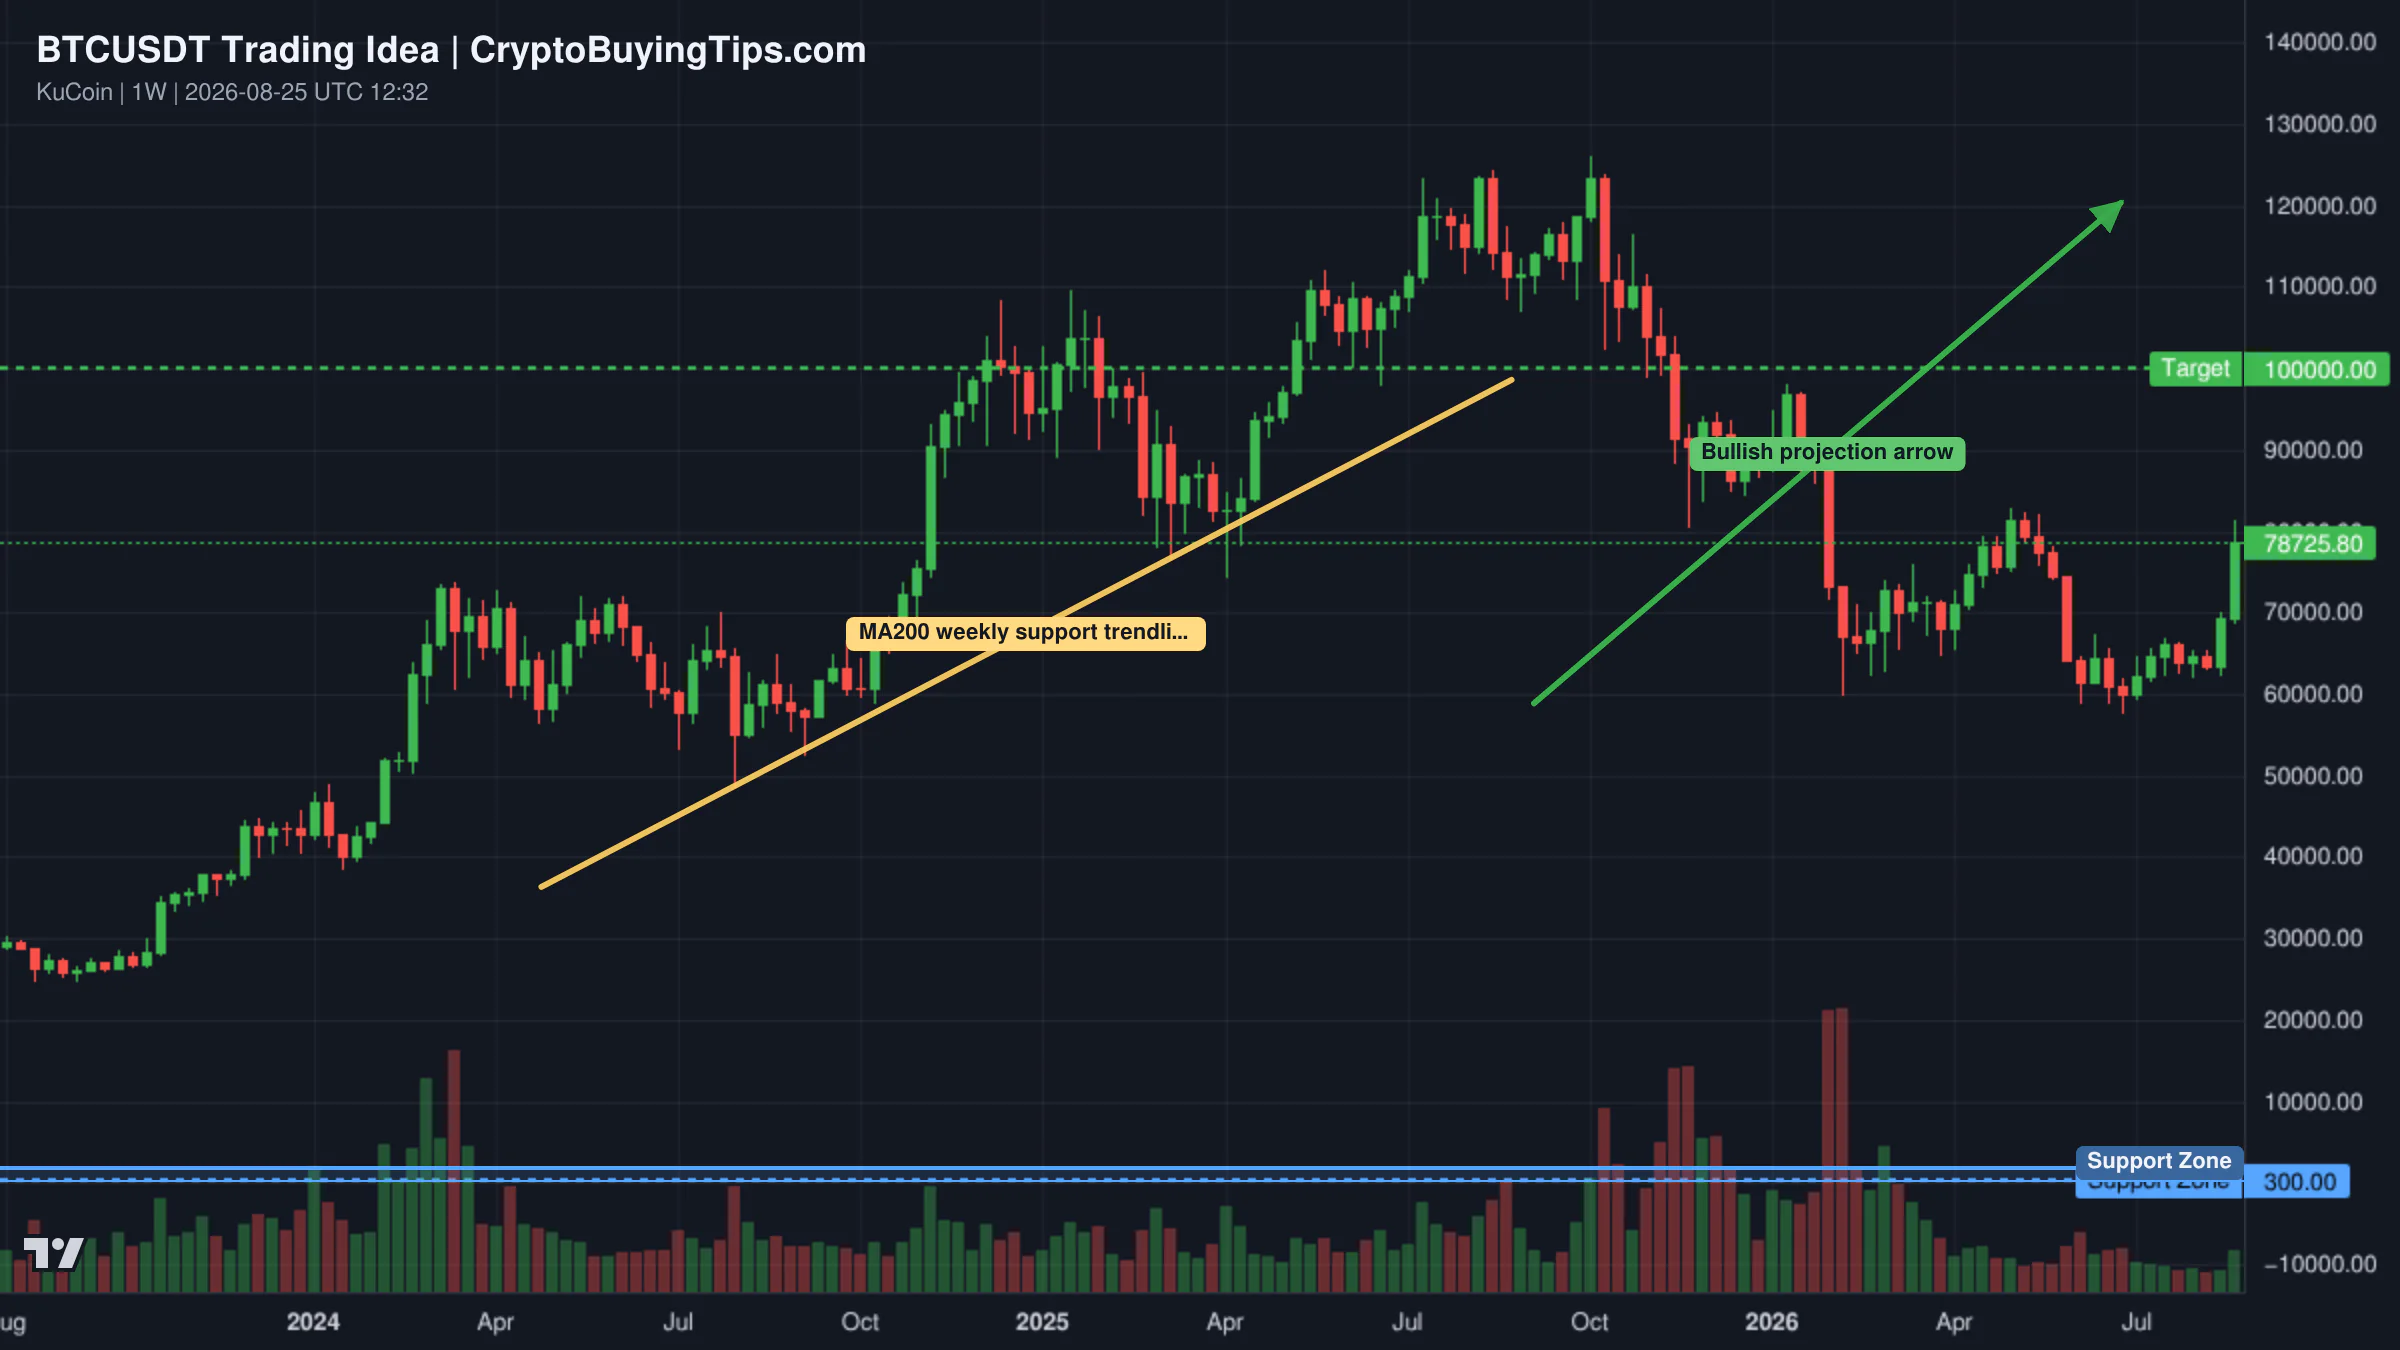
There is a stark disagreement between the weekly and hourly timeframes for Bitcoin. On the weekly chart, some analysts are pointing to a massive convergence of support levels. The argument is that Bitcoin is trading above the EMA55 and the MA200, which historically suggests a strong rising wave. This view treats the current 2026 volatility as a standard bear market bottom process. If this holds, the macro trend remains aggressively bullish.

Redrawn BTCUSDT 1W trading idea chart for Bitcoin Weekly: 300 Support Levels (The 2030-2034 Bear Market)

However, the short term picture is much uglier. On the 1 hour chart, a rising wedge pattern has failed. The current setup suggests a multi wave breakdown. The target is a macro support floor near $74,000. The sequence would involve an initial drop to $77,000, a fake-out bounce to $78,500, and a final flush to $74,000. For traders, the risk is panic buying this "minor pause" only to get caught in a distribution phase.

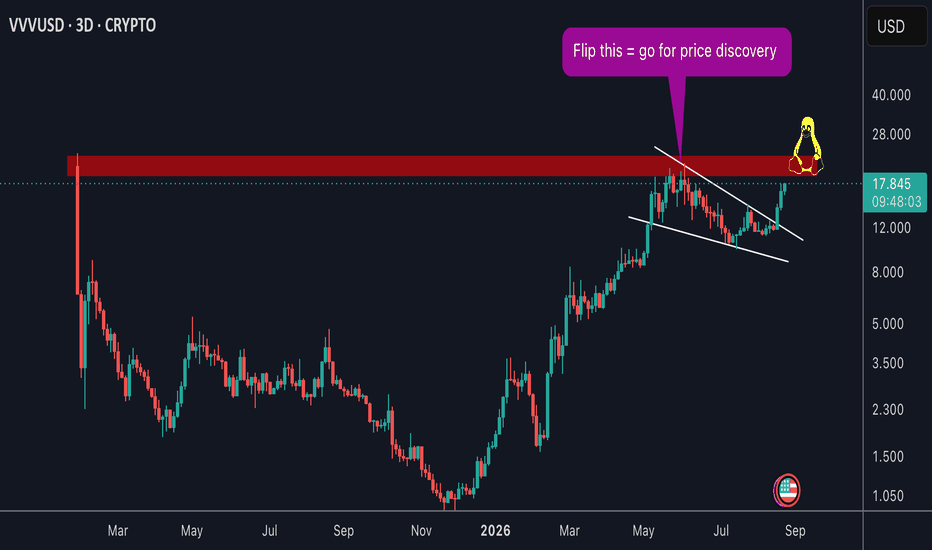
Away from the majors, VVV is attempting a breakout. It has cleared a local bull flag and is now pushing against a major resistance zone. A clean flip of this zone could lead to price discovery. It is a high reward setup, but it requires a return of volume that we just haven't seen in the broader market today.

Trading idea chart: VVVUSD - VVV wants a new ATH

Smart Money Signals — Hyperliquid Leaderboard

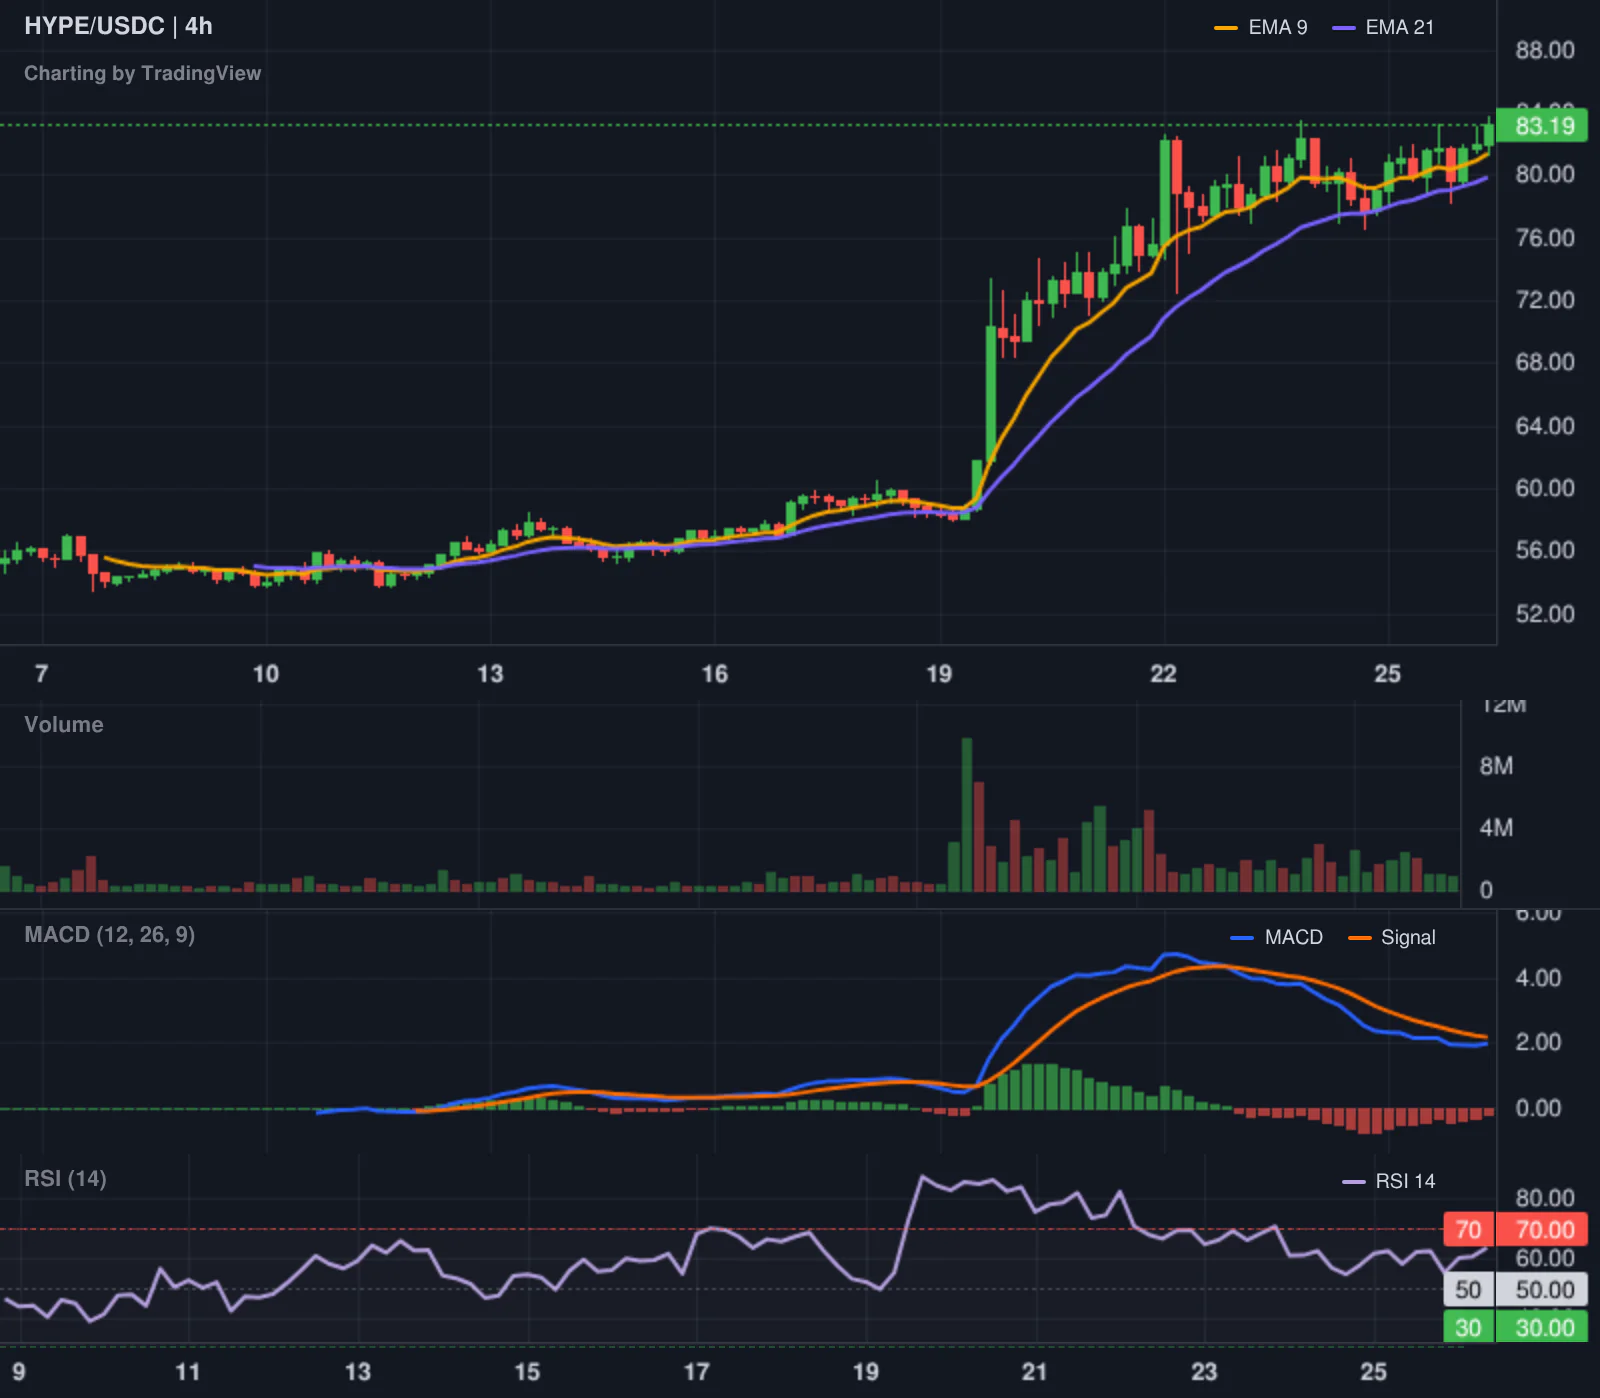
Hyperliquid LONG HYPE leaderboard chart

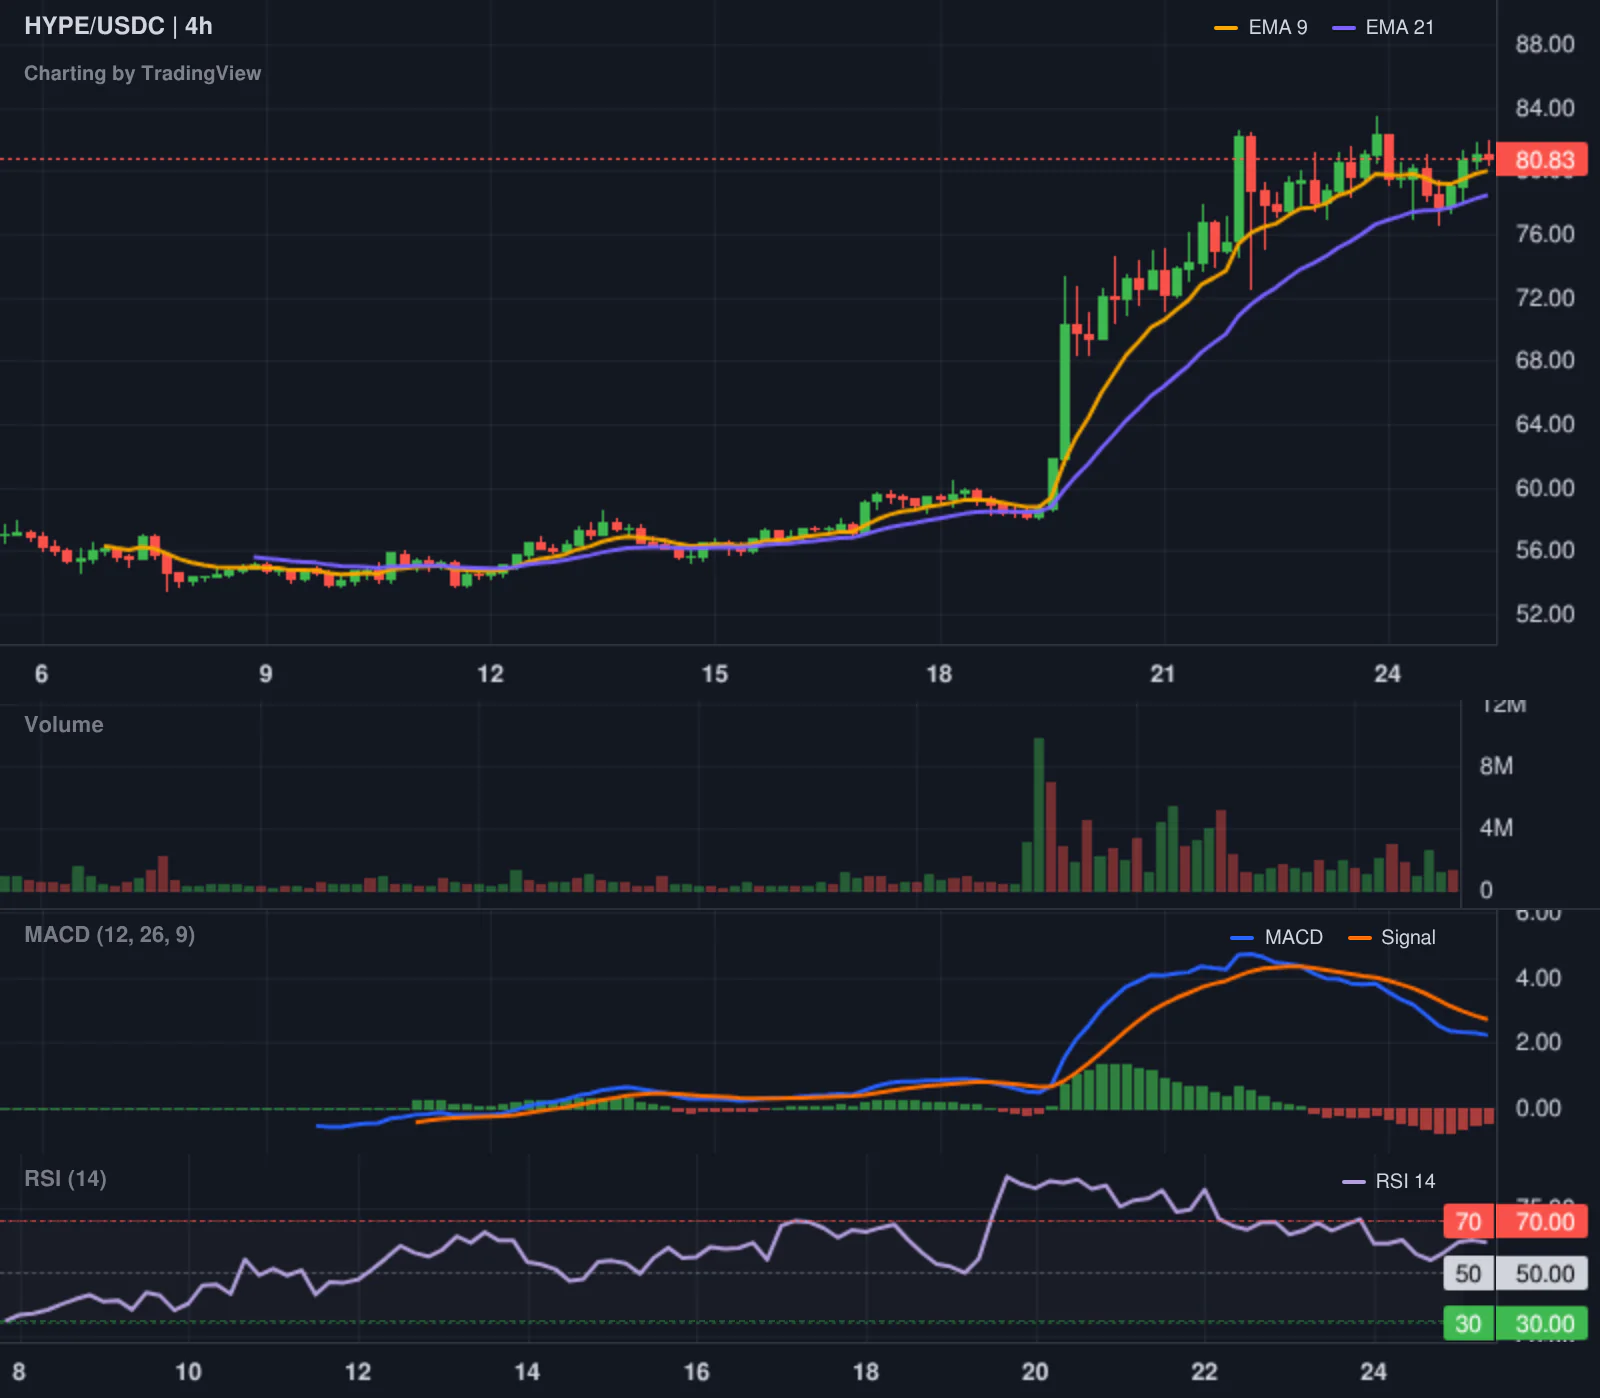
Our tracker has flagged a high confidence move in HYPE. A top trader, 0x810b41, who has a 118.6 percent all time ROI, opened a long position at $77.644. The notional value of the trade is $194,110. Given the trader's track record and the fact that HYPE is one of the few assets showing strength today, this is a signal that the smart money is rotating into high performance infrastructure tokens.

Altcoin Spotlight

Hyperliquid deserves the spotlight today. While the rest of the altcoin market is bleeding or stagnant, HYPE has managed a 2.92 percent gain. It is not just the price action. The combination of leaderboard signals and the general rotation away from Ethereum suggests that traders are looking for assets with actual trading volume and utility. HYPE is currently the primary beneficiary of this shift.

What to watch next

The market is in a strange place. We have institutional giants like BlackRock moving billions and banks building nationwide networks, yet the actual trading volume is disappearing. This is a classic divergence. The "Extreme Greed" reading is a lagging indicator of the last few weeks, not a reflection of today's activity.

The immediate focus is the $74,000 to $78,000 range for Bitcoin. If the volume doesn't return, the market is vulnerable to a sharp flush. But if the institutional swaps reported by BlackRock start to hit the spot market in a visible way, the current dip will look like a rounding error. Watch the ETH gas fees. If they stay this low, the "altcoin season" remains a fantasy for the foreseeable future.

Crypto Market Overview | leverage driving bitcoin's move amid institutional adoption and geopolitical risk | August 25, 2026
Sigrid Voss·

Crypto Market Overview | leverage driving bitcoin's move amid institutional adoption and geopolitical risk | August 25, 2026

Market overview

The market is currently operating in a state of profound contradiction. While the total crypto market cap sits at $2.67T with a bullish lean, the underlying machinery suggests a precarious balance. The Fear and Greed Index has hit 81, placing the market in extreme greed, yet this sentiment is not translating into a broad altcoin rally. Instead, capital is concentrating in the flagship asset. Bitcoin dominance has climbed to nearly 60%, leaving the rest of the market to fight for scraps.

The most telling metric is the volume split. Spot volume has surged to approximately $138B, but derivatives volume is an eye watering $1.16T. This means derivatives activity is roughly 8.4 times higher than spot trading. When the price rips higher on a foundation of leverage rather than genuine spot accumulation, the market becomes fragile. We are seeing a classic scenario where the crowd is chasing the move with borrowed money, which usually ends in a sharp correction to clear the board.

Stablecoin dominance remains relatively low at 9.62%, suggesting that traders are not sitting on the sidelines. They are fully deployed, mostly in leveraged longs. The Altcoin Season Index is neutral at 38, confirming that we are firmly in a Bitcoin season. The market is moving up, but it is doing so with a heavy skew toward the top, while the broader index performance remains modest.

Bitcoin and Ethereum

Bitcoin is currently trading at $79,373.16, having briefly touched the $80,000 milestone. This move is being driven by a combination of renewed ETF demand and a shift in U.S. Treasury policy. According to Arthur Hayes, the expansion of longer dated Treasury buybacks is effectively injecting dollar liquidity into the system, and Bitcoin is the primary beneficiary of this liquidity flush. The price has surged 38% since the June dip, but the current vertical expansion into overhead resistance suggests the move is becoming overextended.

Ethereum is trading at $2,484.03, showing a more muted 0.81% gain. The network is in a strange state. While the price is climbing, gas fees are exceptionally low, ranging between 0.08 and 0.1 Gwei. This indicates a lack of on chain congestion and suggests that the current price action is driven by exchange trading rather than a surge in DeFi activity or NFT minting. Ethereum continues to underperform relative to Bitcoin, a trend that is reflected in its slipping dominance of 11.22%.

Top crypto prices

Bitcoin leads the pack at $79,373.16, up 2.27% over the last 24 hours. Ethereum follows at $2,484.03, with a modest increase of 0.81%. BNB is holding steady at $700, up 0.13%, while XRP is priced at $1.48, gaining 0.14%. Solana is the standout among the majors, jumping 5.11% to reach $99.66. TRON has slipped slightly to $0.3426, down 0.27%. Hyperliquid is trading at $81.03, up 2.91%.

News driving today's market

The geopolitical climate has taken a sharp turn with the U.S. Treasury launching Operation Economic Outcast. In a move described as an economic D-Day, the U.S. has expanded sanctions on Iran to specifically include the digital asset sector. The Office of Foreign Assets Control can now sanction any person worldwide operating in Iran's crypto sector. This is a significant escalation in regulatory risk. We have previously covered how US sanctions on crypto flows create liquidity shocks, and this broader sectoral determination increases the risk of sudden capital flight from assets linked to sanctioned entities.

In contrast, the institutional adoption narrative is gaining ground in Asia. Standard Chartered has become the first bank to distribute a Hong Kong dollar stablecoin, and Franklin Templeton has placed its tokenized treasury fund on the HashKey exchange. Furthermore, Coinbase has debuted tokenized stocks on the Base network, allowing users to trade equities like Nvidia and Apple on chain. These developments suggest that while the U.S. government is using crypto as a tool for economic warfare, the financial industry is quietly building the rails for a tokenized global economy. This duality is creating a market that is simultaneously terrified of the regulator and enamored with the technology. We previously covered dominance data agrees for more background.

Social intelligence

On chain data reveals a divergence between retail greed and whale caution. While the Fear and Greed Index is at 81, a significant whale recently closed longs on 600 BTC and 10,000 ETH to book a profit of $852K. Rather than chasing the current rally, this player has placed limit orders to go long again between $72,611 and $74,222. This suggests that smart money expects a healthy flush before the next leg up.

Macro tensions are also simmering. Reports indicate that Chinese state affiliated hackers have doubled their attacks by integrating open source AI into their operations. Simultaneously, President Trump is reportedly preparing a new 7.5% tariff on China. These factors, combined with the Iran sanctions, create a volatile backdrop. The market is currently ignoring these risks in favor of the Bitcoin rally, but geopolitical shocks usually hit the market when it is most complacent.

Trading ideas worth watching

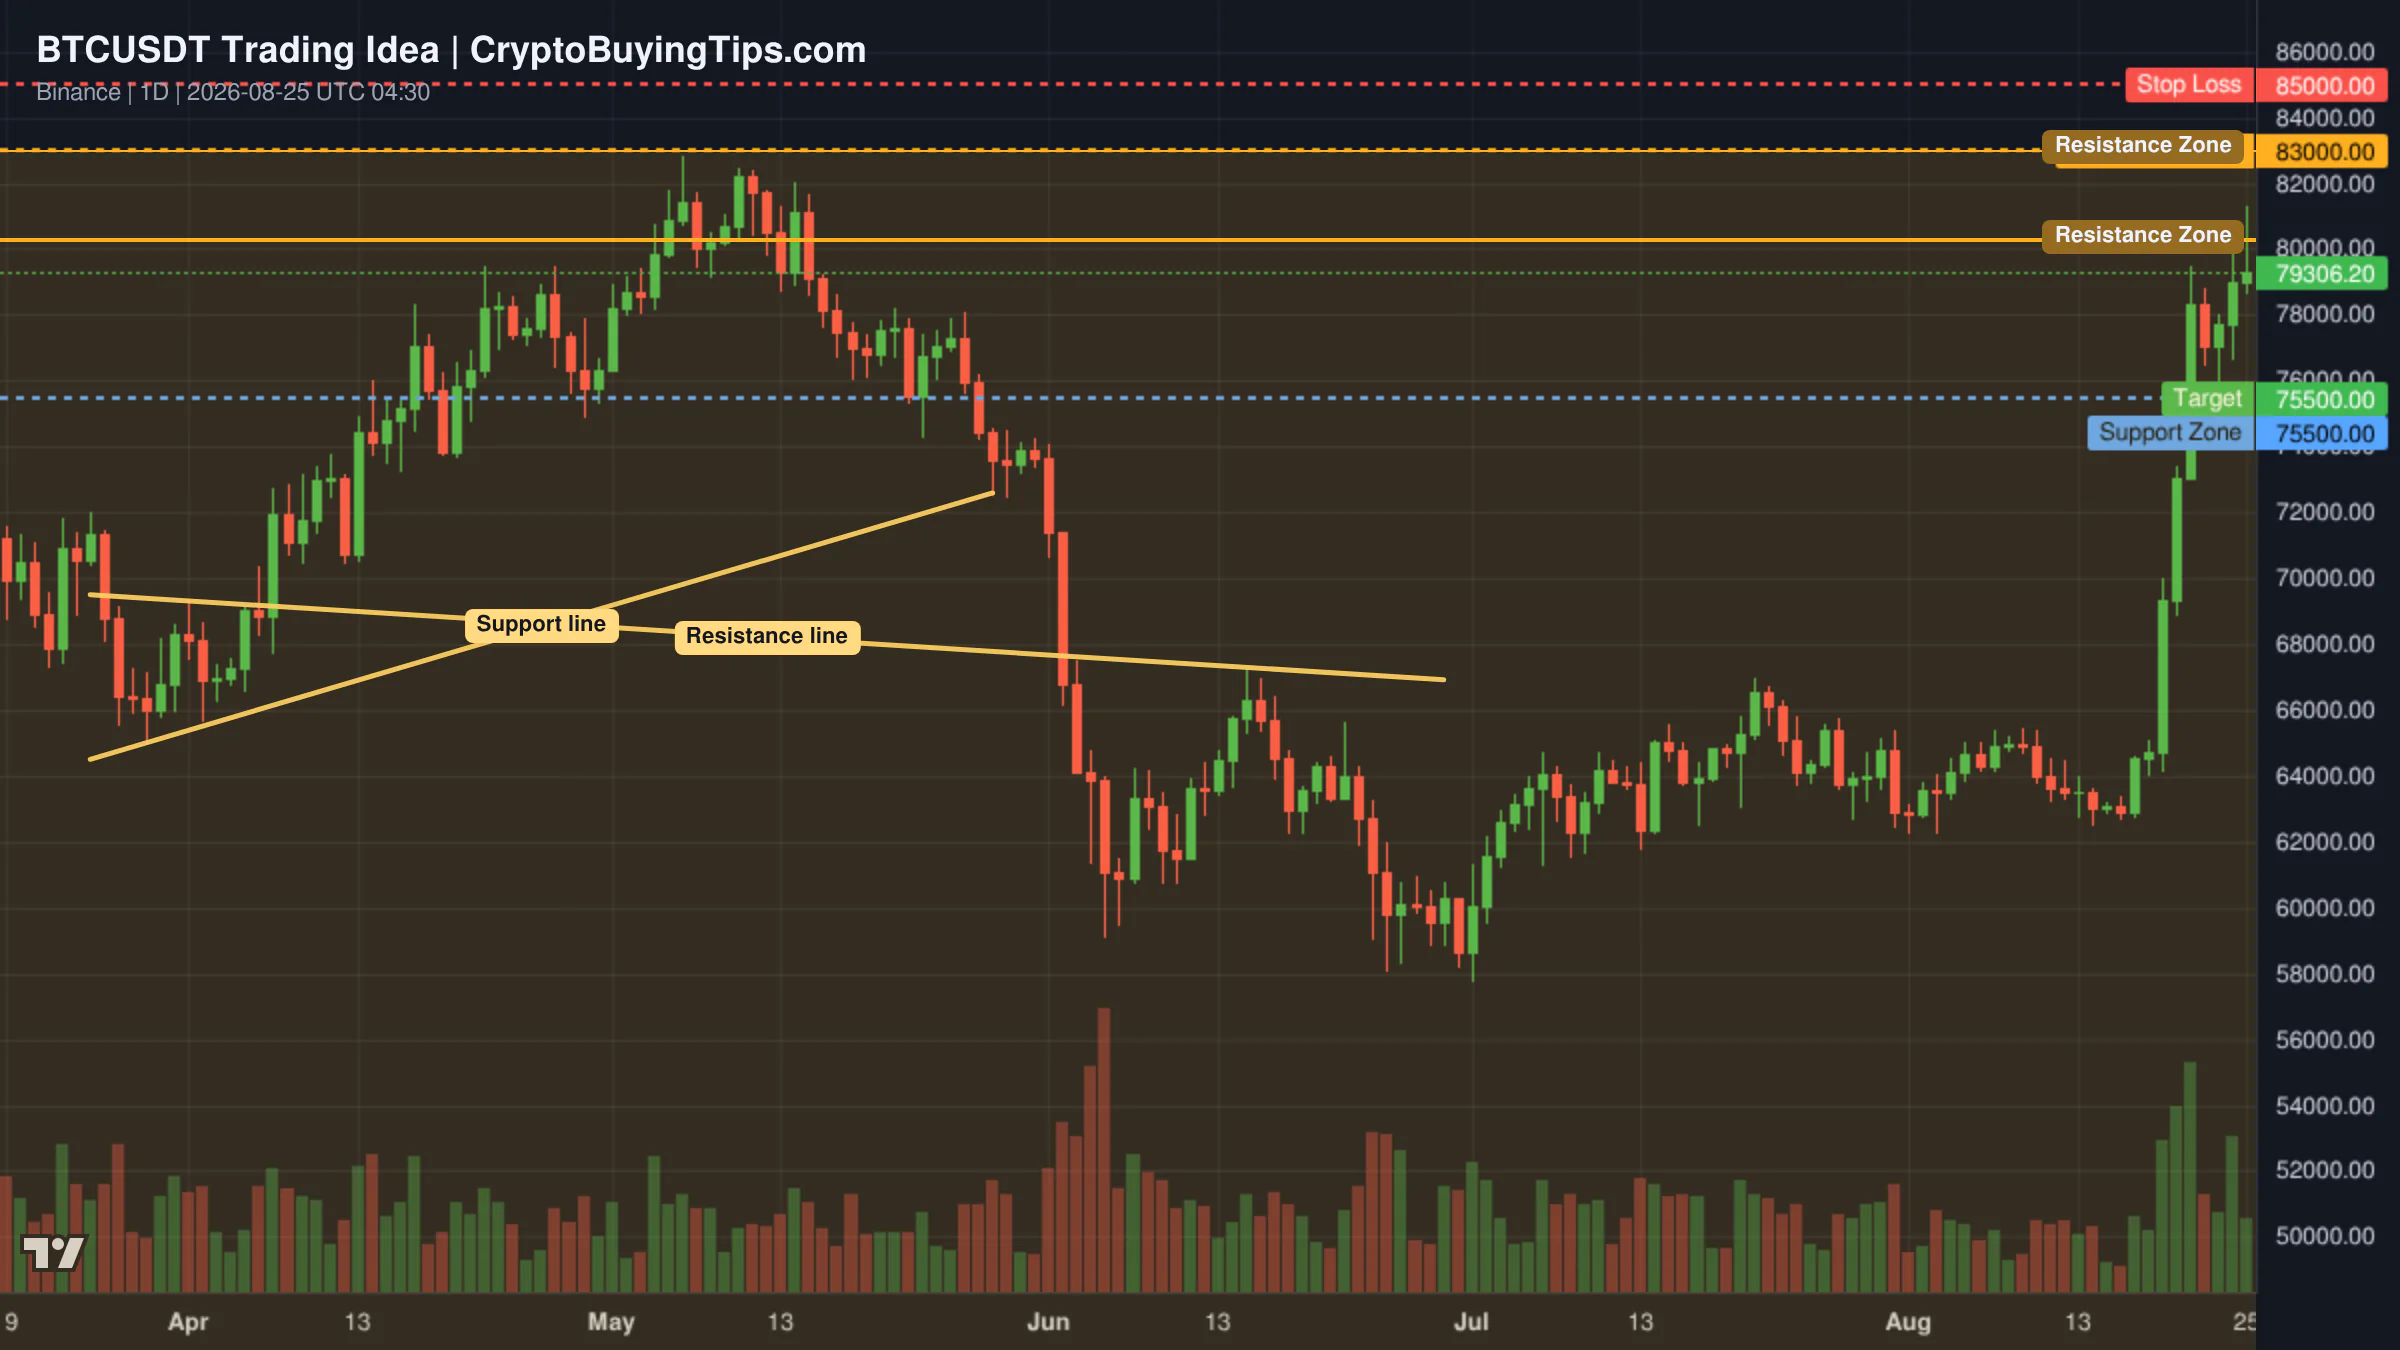
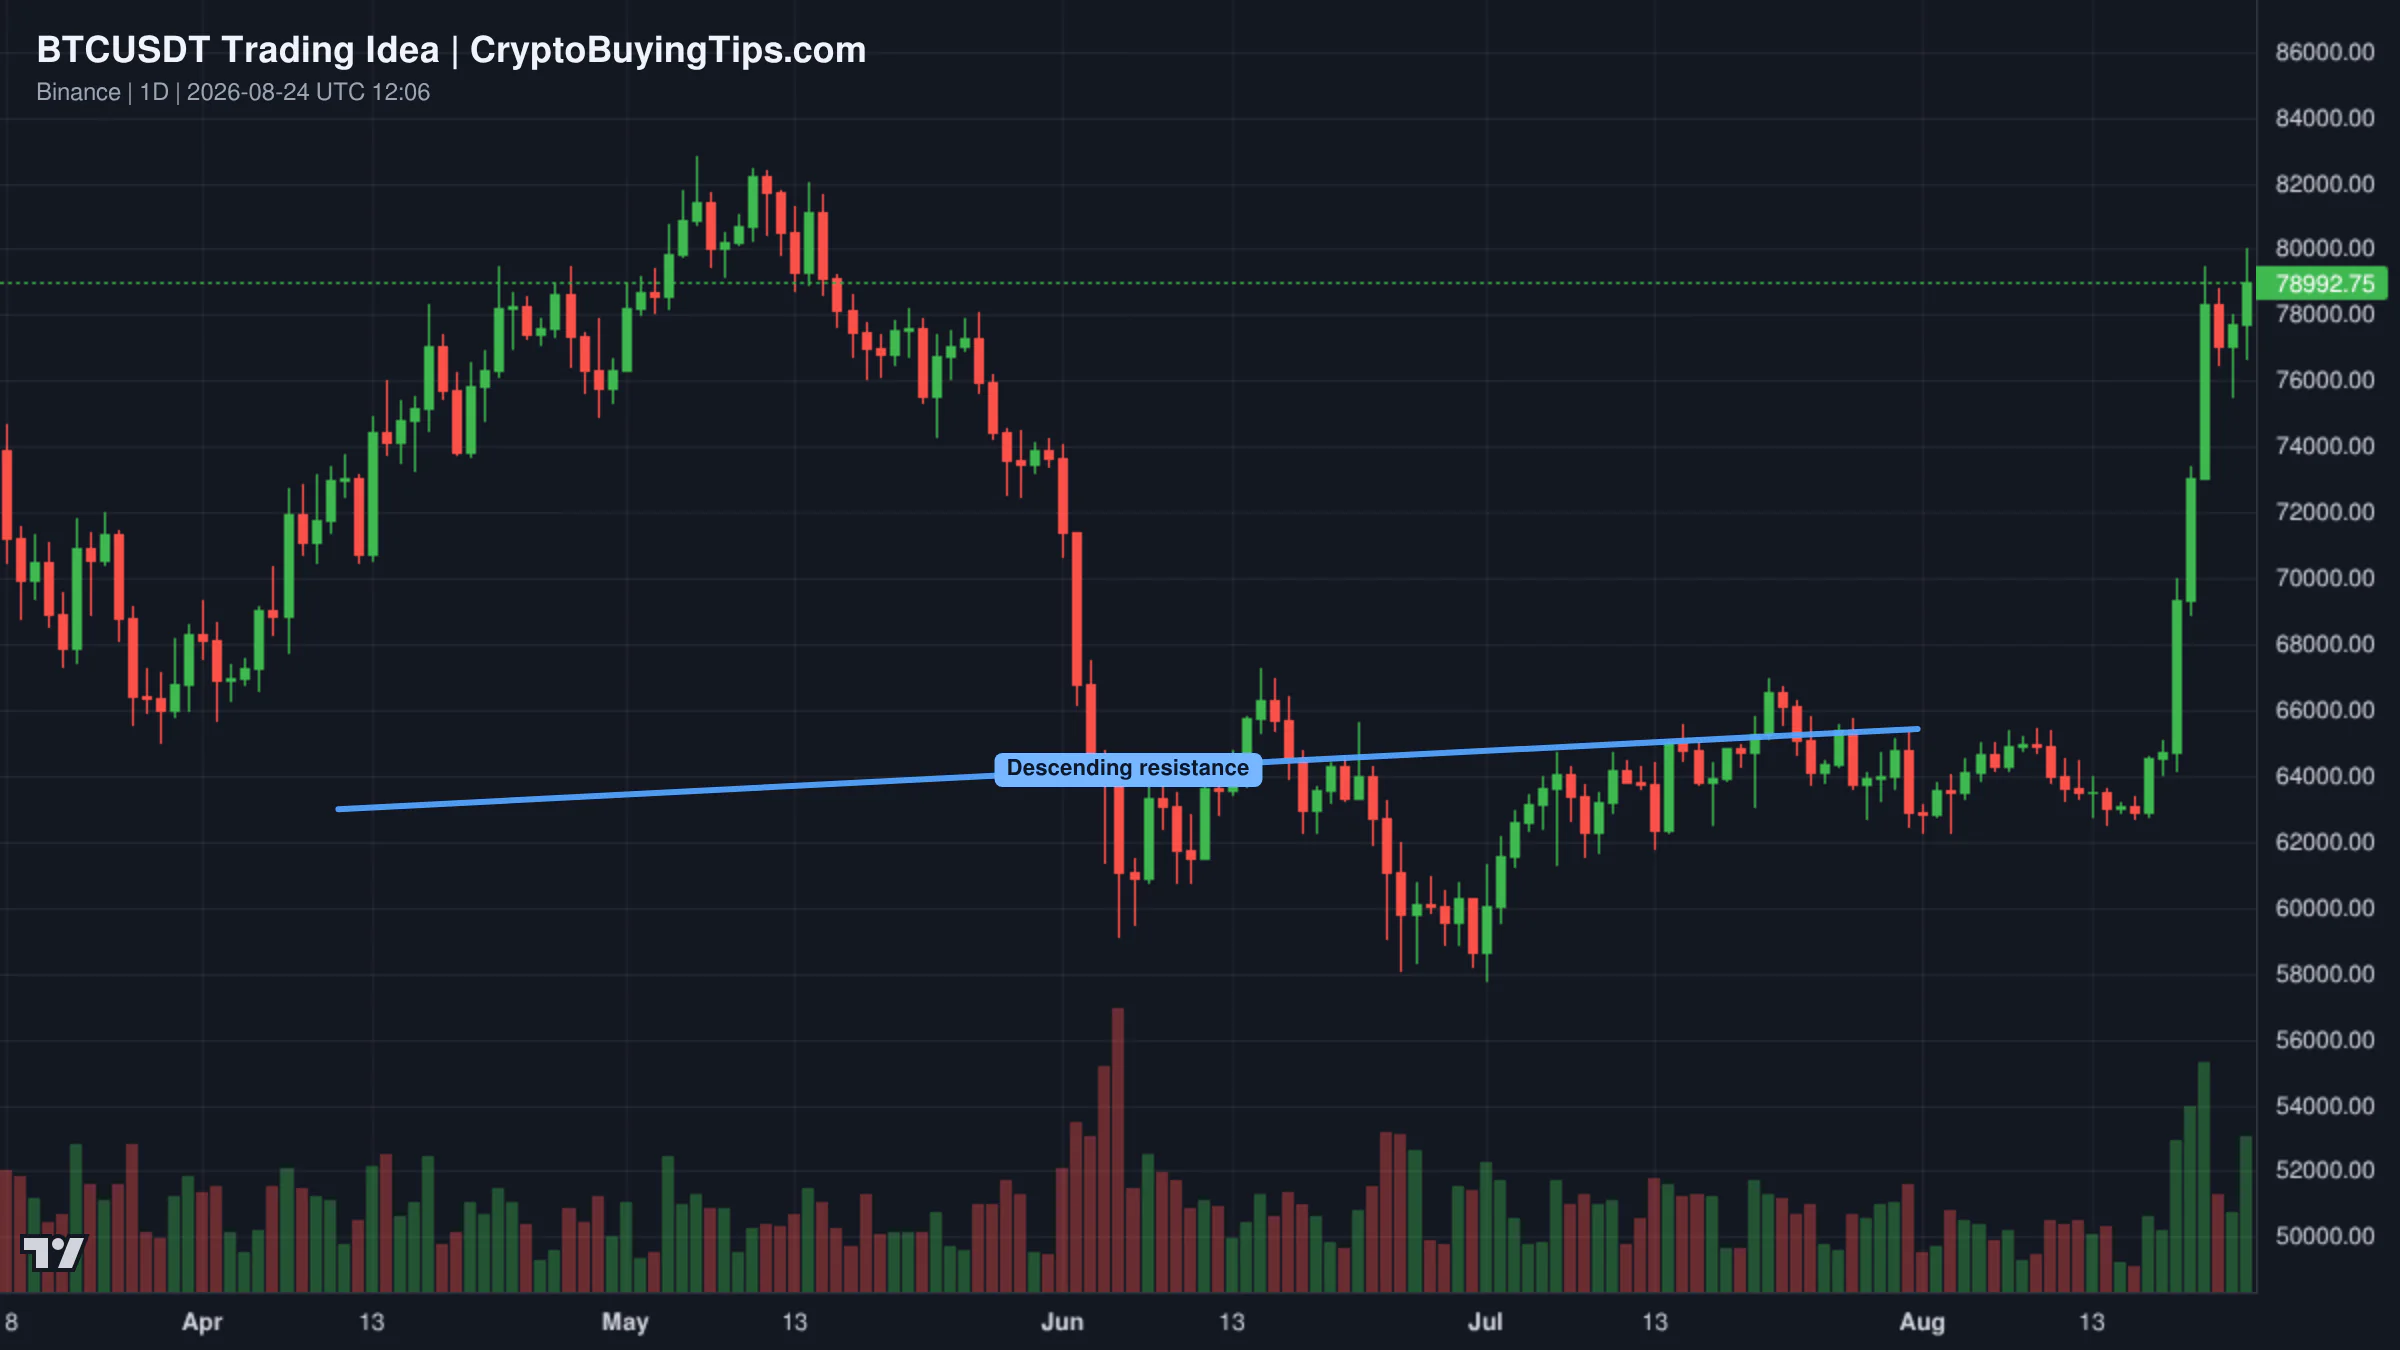
Bitcoin is currently fighting a major resistance zone around $77.8K. This area aligns with a long term descending trendline and is accompanied by an overbought RSI. A failure to close decisively above this level could signal that buying momentum is exhausted. Some analysts are eyeing a more aggressive sequence where Bitcoin pushes toward $83,000 to sweep buy side liquidity before a high velocity rejection drives price down to retest the $75,500 support line. Chasing vertical green candles into this supply zone is a high risk strategy.

Redrawn BTCUSDT 1D trading idea chart for  BTC/USDT: THE $75,500 SUPPORT LINE RETEST! Redrawn BTCUSDT 1D trading idea chart for BTC Faces a Make-or-Break Zone at $77.8K!

For Ethereum, the outlook is more long term. Some technical setups suggest a confirmed bullish cycle with the next immediate resistance sitting between $3,300 and $3,600. The appearance of a three white soldiers pattern on the 3D timeframe is a strong bullish signal. If the current recovery holds, there is a theoretical path toward a new all time high, though this depends on Bitcoin remaining stable.

Smart Money Signals — Hyperliquid Leaderboard

Hyperliquid LONG HYPE leaderboard chart

Our tracker has flagged a high conviction move from a top trader on Hyperliquid. Trader 0x810b41, who has a 30 day ROI of 119%, has opened a long position in HYPE at $77.644. The position has a notional value of $194,110. Given the trader's track record and the recent strength of the Hyperliquid ecosystem, this signal suggests continued confidence in the protocol's native token despite the broader market's volatility.

Altcoin Spotlight

Solana is the clear outperformer among the top assets today. With a 5.11% gain, it is significantly outpacing both Bitcoin and Ethereum. This move suggests that when traders do rotate out of the flagship asset, Solana remains the primary destination for risk appetite. It is currently hovering just under the $100 mark, a psychological level that could trigger further momentum if breached.

What to watch next

The immediate focus is the $80,000 psychological level for Bitcoin. A clean break and hold above this mark would signal a new phase of the bull market. However, the massive gap between derivatives and spot volume remains a red flag. If the price fails to attract genuine spot buyers at these levels, the leverage will eventually unwind, leading to a sharp correction.

On the macro side, the market must digest the implications of Operation Economic Outcast. The U.S. Treasury's decision to treat crypto as a primary tool for sanctions enforcement increases the risk of sudden volatility. We should watch for any signs of capital flight or liquidity shocks resulting from these sanctions. The tension between institutional adoption in Asia and regulatory aggression in the U.S. will likely define the market's direction over the coming weeks.