Market Overviews

Daily crypto market overviews, trend analysis, and key updates from our editorial team.

Crypto Market Overview | Leverage-driven rally amid strong ETF inflows as BTC targets 80k | August 24, 2026
Sigrid Voss·

Crypto Market Overview | Leverage-driven rally amid strong ETF inflows as BTC targets 80k | August 24, 2026

Market overview

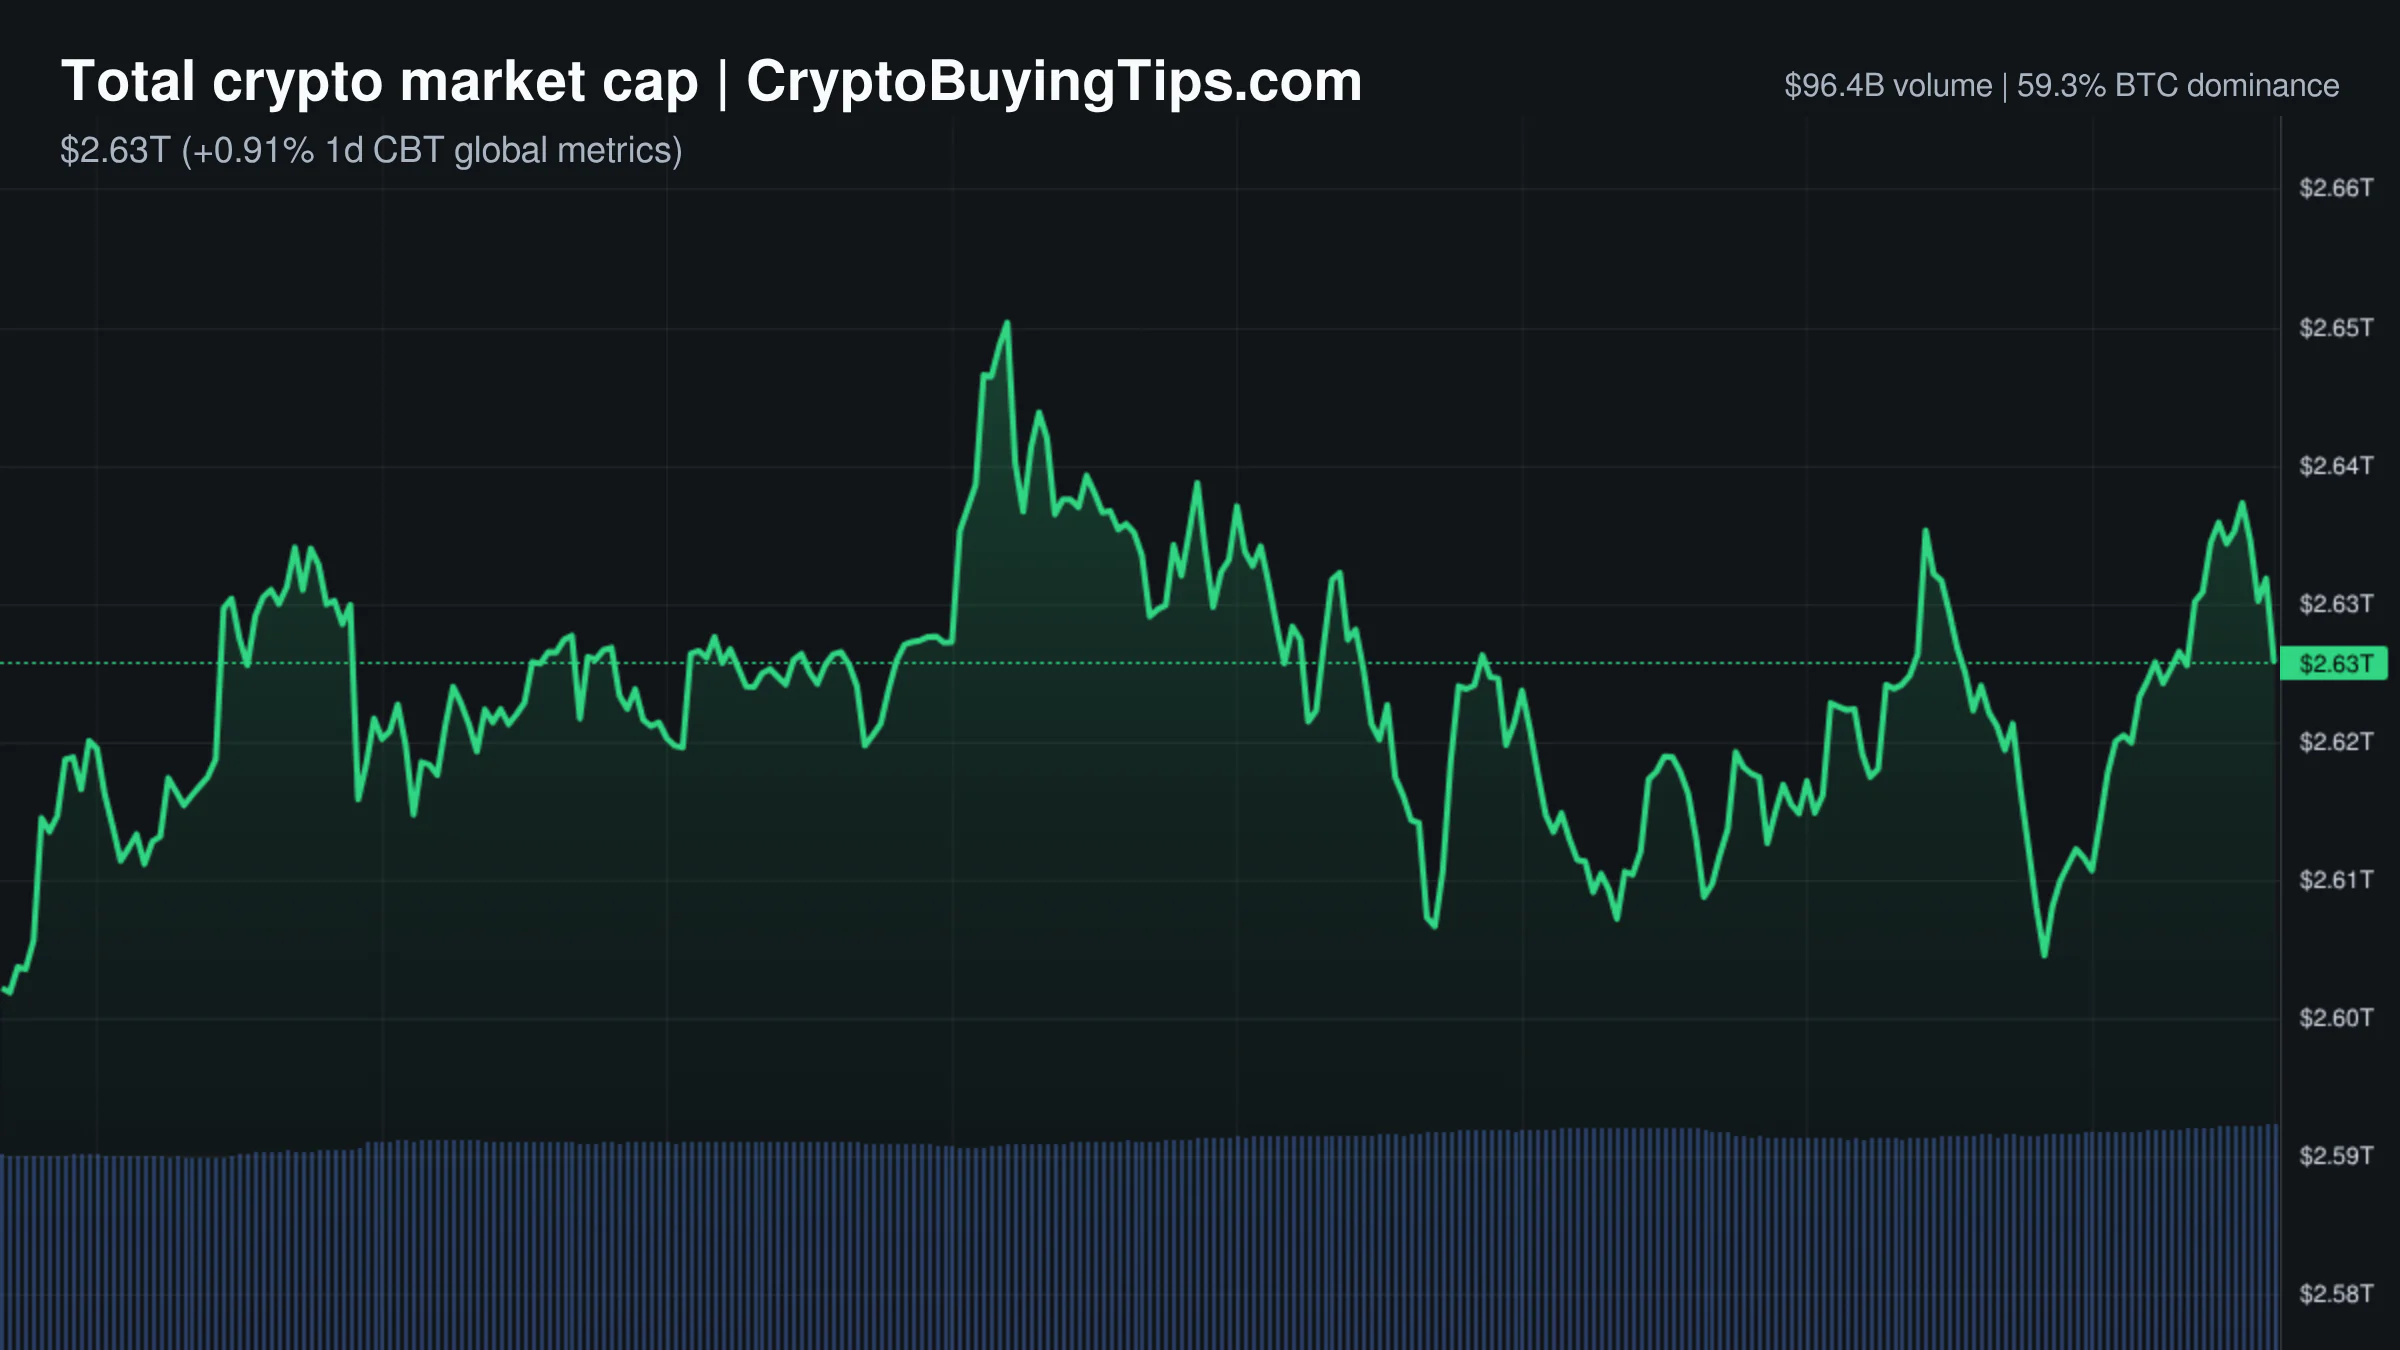
The market is currently operating in a state of contradiction. While the Fear and Greed Index sits at 79, signaling clear greed, the Altcoin Season Index remains neutral at 41. This gap suggests that the current bullishness is not a broad retail mania but a concentrated move in large cap assets. The total crypto market cap is roughly $2.63 trillion, up 1.05% in the last 24 hours, but the underlying mechanics are concerning.

The most striking data point is the volume imbalance. Derivatives trading volume has hit $779.02 billion, which is approximately eight times higher than the total spot volume of $96.17 billion. When price action is driven by leverage rather than spot accumulation, the market becomes fragile. We are seeing a bullish trend in the short term, but it is a trend built on borrowed money. It is a classic setup where the price rips higher while the actual ownership of the assets remains stagnant.

Bitcoin dominance is holding steady at 59.32%, confirming that capital is staying put in the largest asset. Stablecoin dominance for USDT and USDC is at 9.77%, which means there is still a decent amount of dry powder on the sidelines. However, the heavy skew toward derivatives suggests that traders are not waiting for dips to buy spot; they are simply longing the momentum.

Bitcoin and Ethereum

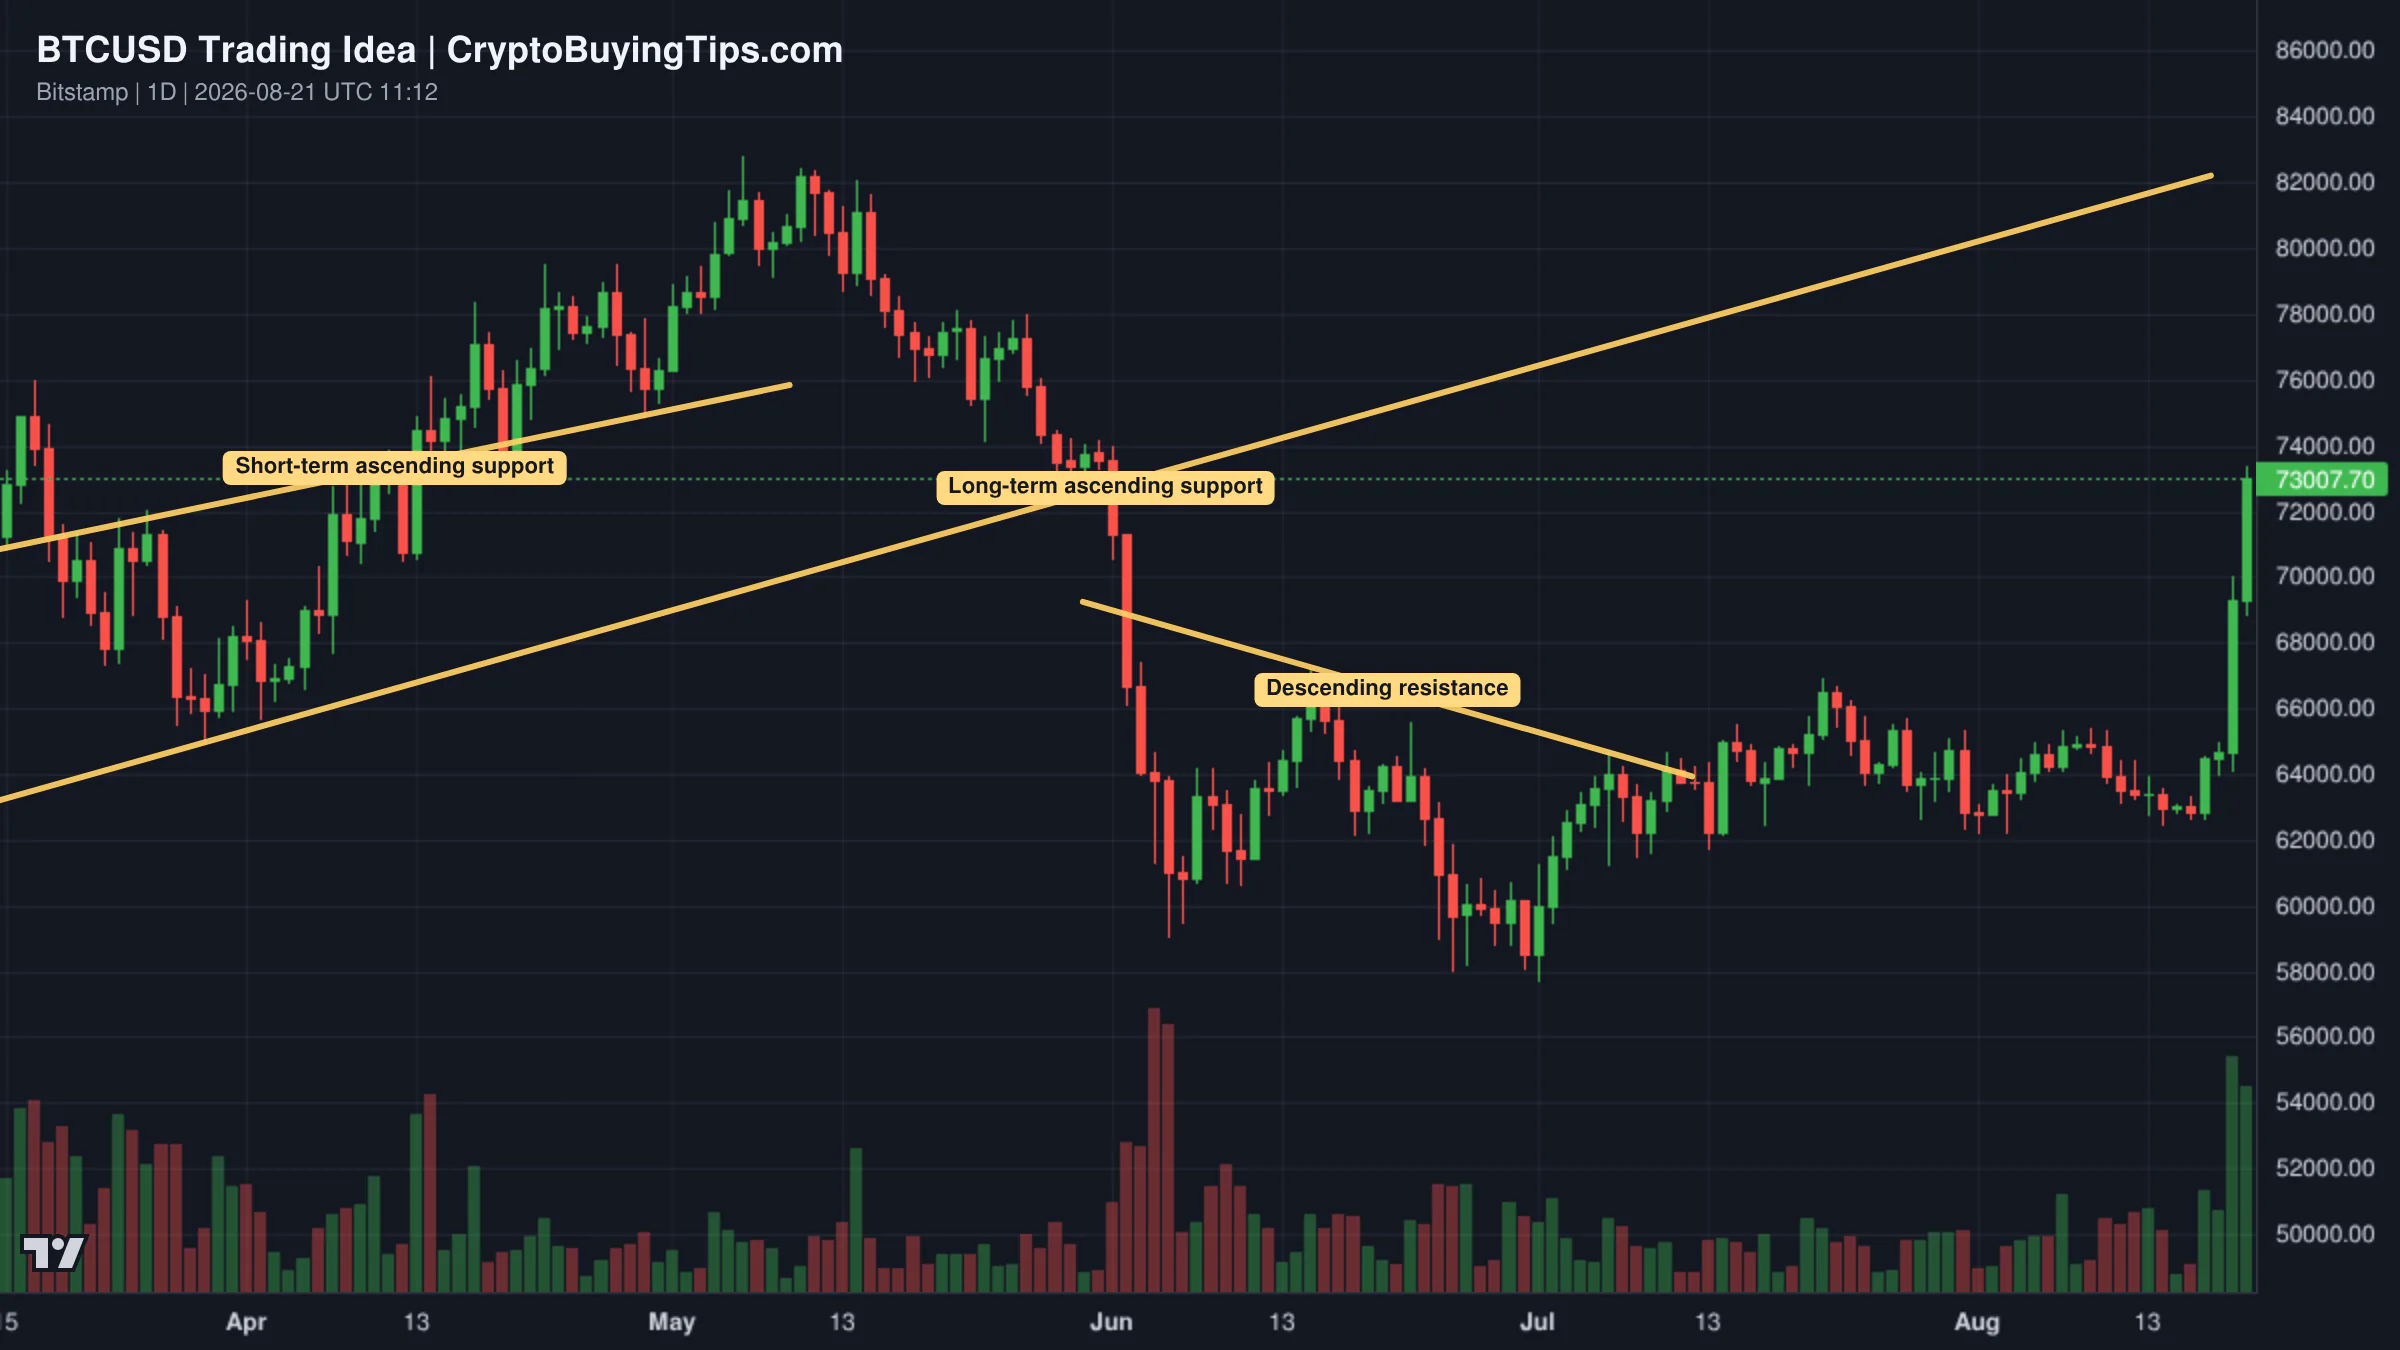
Bitcoin is trading at $77,589.14, up 1.02% today. The asset has surged 22% over the past seven days, marking one of its strongest weekly performances in years. The immediate focus is the $80,000 resistance level. This move is largely a macro story. Strong institutional inflows through spot ETFs, which hit $1.92 billion last week, are providing a floor that retail traders are now leveraging.

Ethereum is at $2,463.32, showing a stronger 24 hour gain of 1.98%. Despite the price increase, the network is strangely quiet. ETH gas fees are extremely low, with fast transactions costing only 0.12 Gwei. This indicates very low on chain demand. It is an odd sight to see the price of the asset rise while the actual utility of the network remains in a slump.

The divergence between BTC and ETH continues to be a theme. While both are green, the money is clearly favoring Bitcoin. This rotation is something we previously noted when the dominance data agrees that institutional players are consolidating into the primary asset.

Top crypto prices

Bitcoin leads the pack at $77,589.14. Ethereum follows at $2,463.32. BNB is trading at $699.45, while XRP remains flat at $1.48. Solana is priced at $94.82. TRON is at $0.3435. Hyperliquid is seeing a slight dip, trading at $78.74.

News driving today's market

The primary catalyst for the current rally is the massive influx of institutional capital. US spot Bitcoin ETFs saw $1.92 billion in inflows last week, the strongest since October 2025. This provides the fundamental bid that allows the price to challenge $80,000. At the same time, macro focus is shifting toward the Jackson Hole meeting. Markets are waiting for Fed Chair Kevin Warsh to deliver his first keynote on Friday. The CME FedWatch tool puts the chance of a rate hike at 38.4%, which creates a tension between the current price momentum and potential macro headwinds.

Regulatory news is a mixed bag. On the bullish side, banks and regulators in Europe and Asia have joined a pilot for quantum-resistant crypto transfers. This is a long term validation of the tech, though it does little for today's price. In Pakistan, a new licensing portal for virtual asset providers suggests a move toward formalization.

However, the SEC has published its Reg Crypto proposal, giving the public 60 days to comment. Any direct federal involvement usually increases compliance costs and creates uncertainty. We have seen this pattern before, and the SEC safe harbor implications often result in a muted market response despite the promised clarity.

Finally, there is a growing narrative around AI agents. Reports suggest that AI agents are increasingly using stablecoins for payments. With crypto card spending topping $1 billion, the transition of USDC and USDT into everyday commerce is becoming a real driver of utility.

Social intelligence

On chain data reveals some interesting positioning by the whales. Abraxas Capital is taking a complex approach to the current market. They have built roughly $783 million in short positions on Hyperliquid while simultaneously hedging with spot buys. They withdrew over $173 million in ETH from Binance over the last four days. This is a classic hedge; they are betting on a local top in the derivatives market while keeping their long term spot exposure intact.

In contrast, Arthur Hayes has been spotted buying back 1.9 million ETHFI at $0.62. This follows a trade four months ago where he sold the same asset at $0.44. It is a textbook example of selling low and buying high, which is a bold strategy for someone of his reputation.

On the macro side, Coinbase CEO Brian Armstrong is highlighting the role of stablecoins in high inflation countries. This reinforces the idea that USDC is becoming a tool for capital flight rather than just a trading pair.

Trading ideas worth watching

The USDT dominance chart is the most important indicator for those waiting for an altcoin rally. The current setup shows a rejection of the resistance zone and a drop toward 7.1%. If USDT dominance can break and hold below 7.0%, it would signal a shift in capital from stablecoins into riskier assets. As long as it stays below 7.08%, the environment remains favorable for altcoins, but a clean break below 7.0% is the real trigger for a broad market expansion.
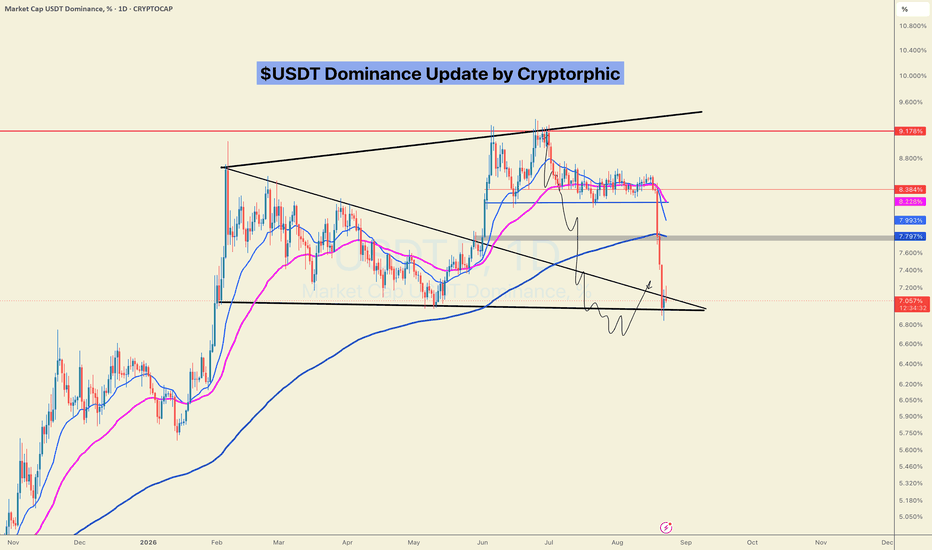
Trading idea chart: USDT.D - $USDT Dominance Update: This will trigger the alseason.

For those looking at specific alts, Injective is showing a bullish resumption. The asset has recovered from a downtrend that ended in February 2026 and is now forming a higher low. A confirmed uptrend begins once INJ closes above $7.34. If that level holds, targets of $10 and eventually $33.3 become active. The current weekly candle is full green, which suggests momentum is building for the coming weeks.
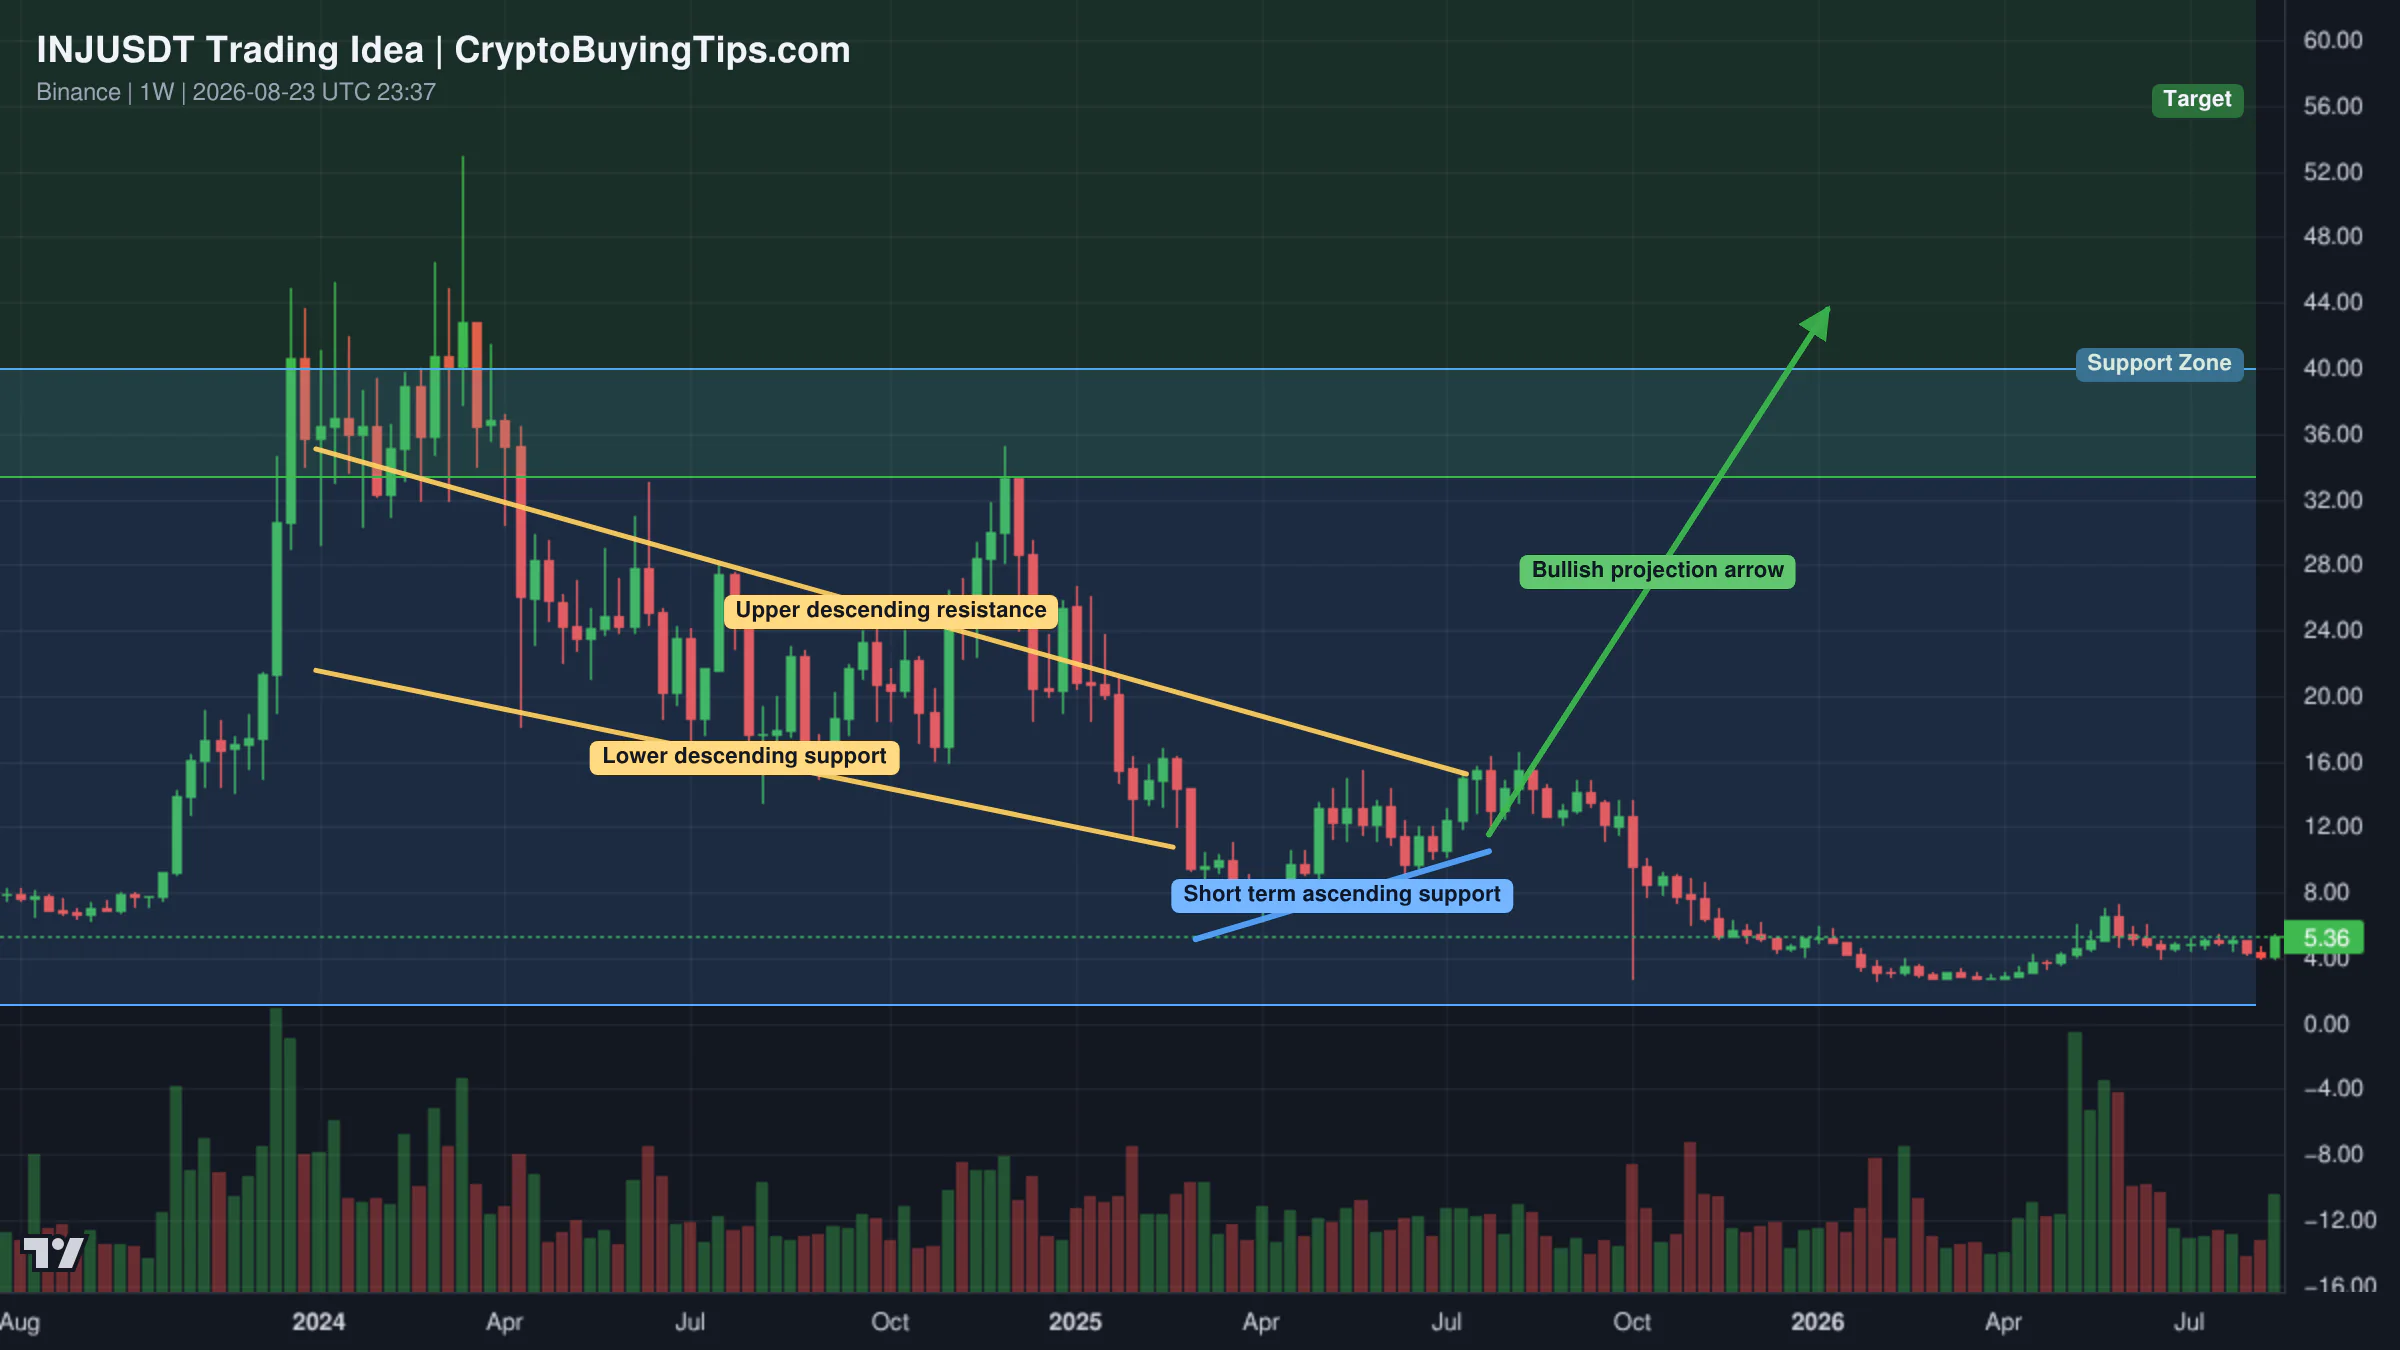
Redrawn INJUSDT 1W trading idea chart for Injective: 3,333% Profits Potential

Cardano is presenting a different setup. The asset has been forming a two month rounded bottom pattern. This follows a period of liquidity hunting where the price dipped below support before recovering. While ADA has been slower than others, the structure suggests a long term recovery. The goal here is a new all time high, though this is likely to be a prolonged process rather than a sudden spike.

Smart Money Signals — Hyperliquid Leaderboard
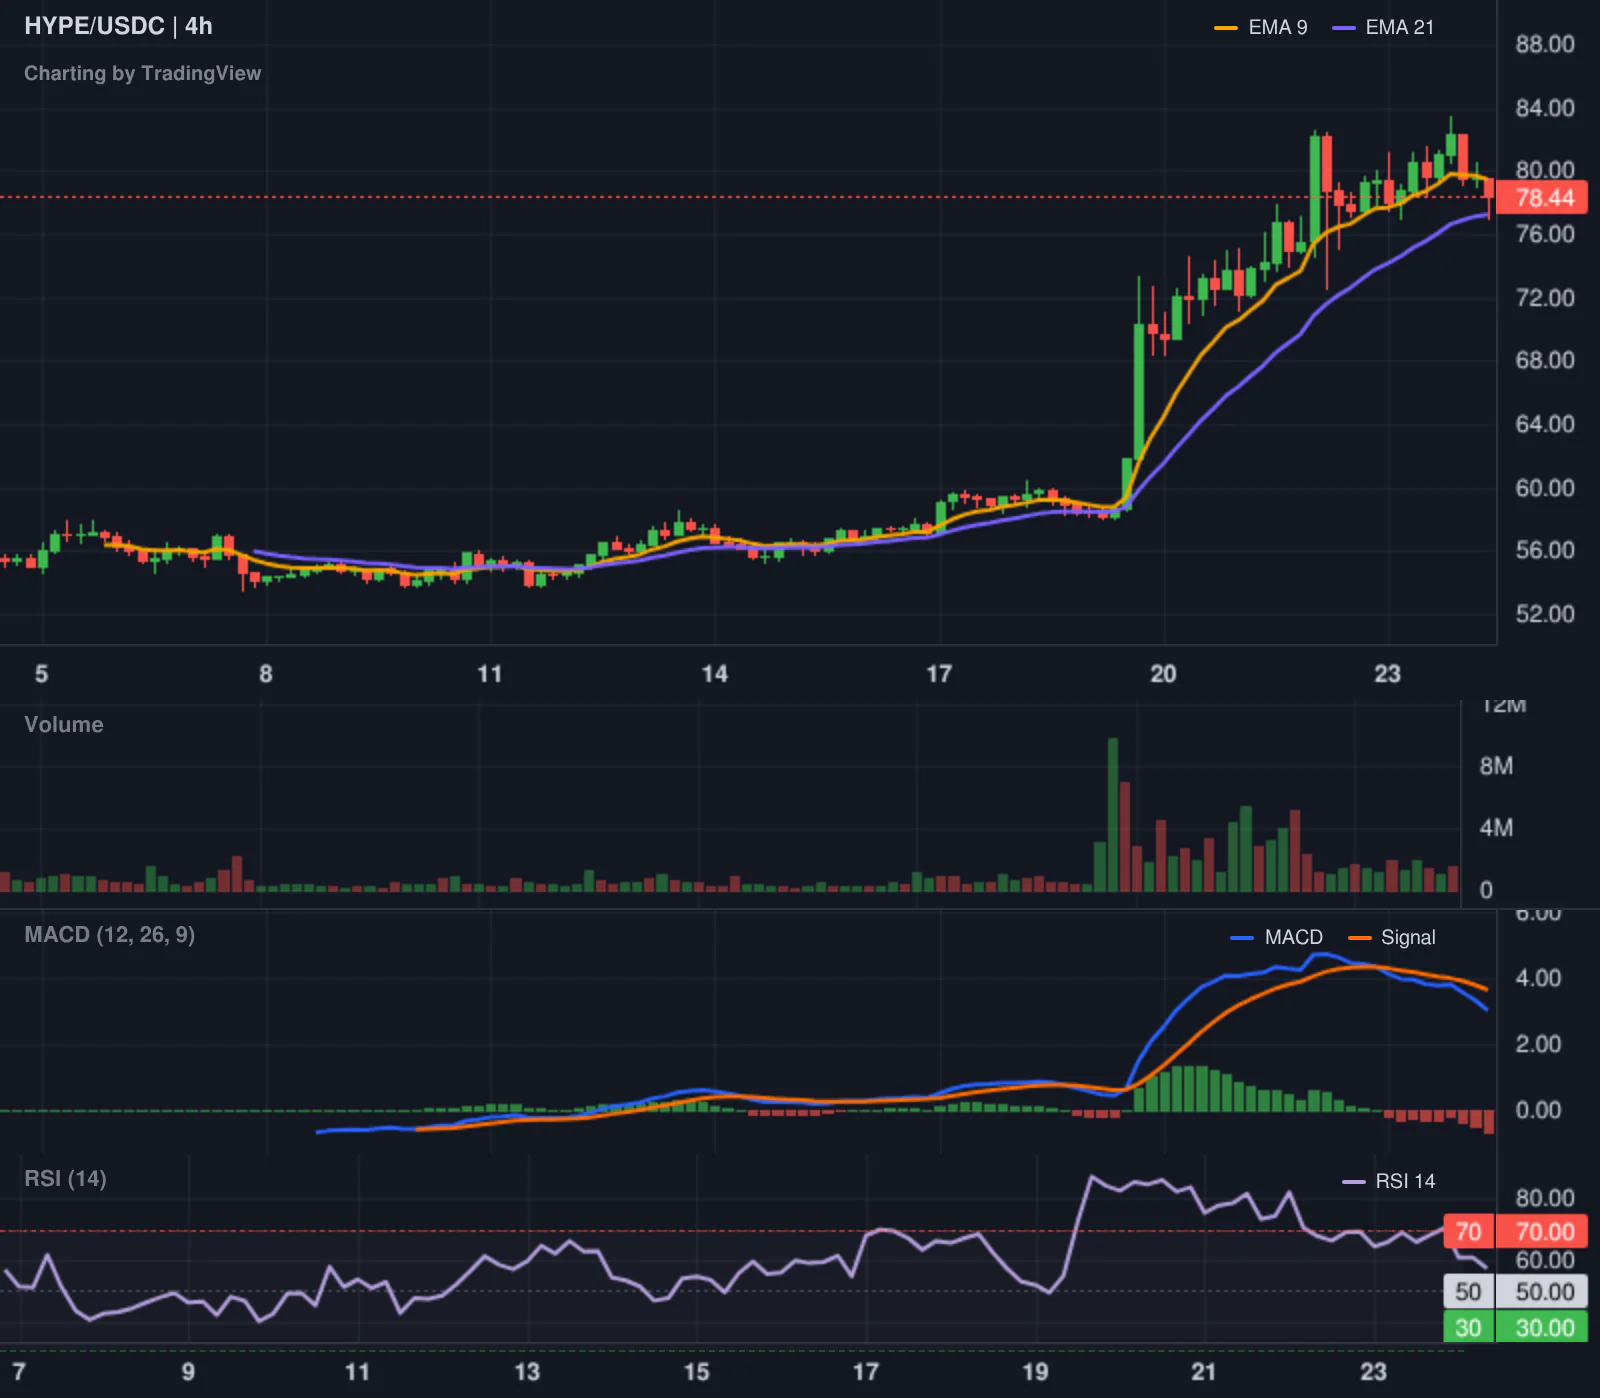
Hyperliquid LONG HYPE leaderboard chart

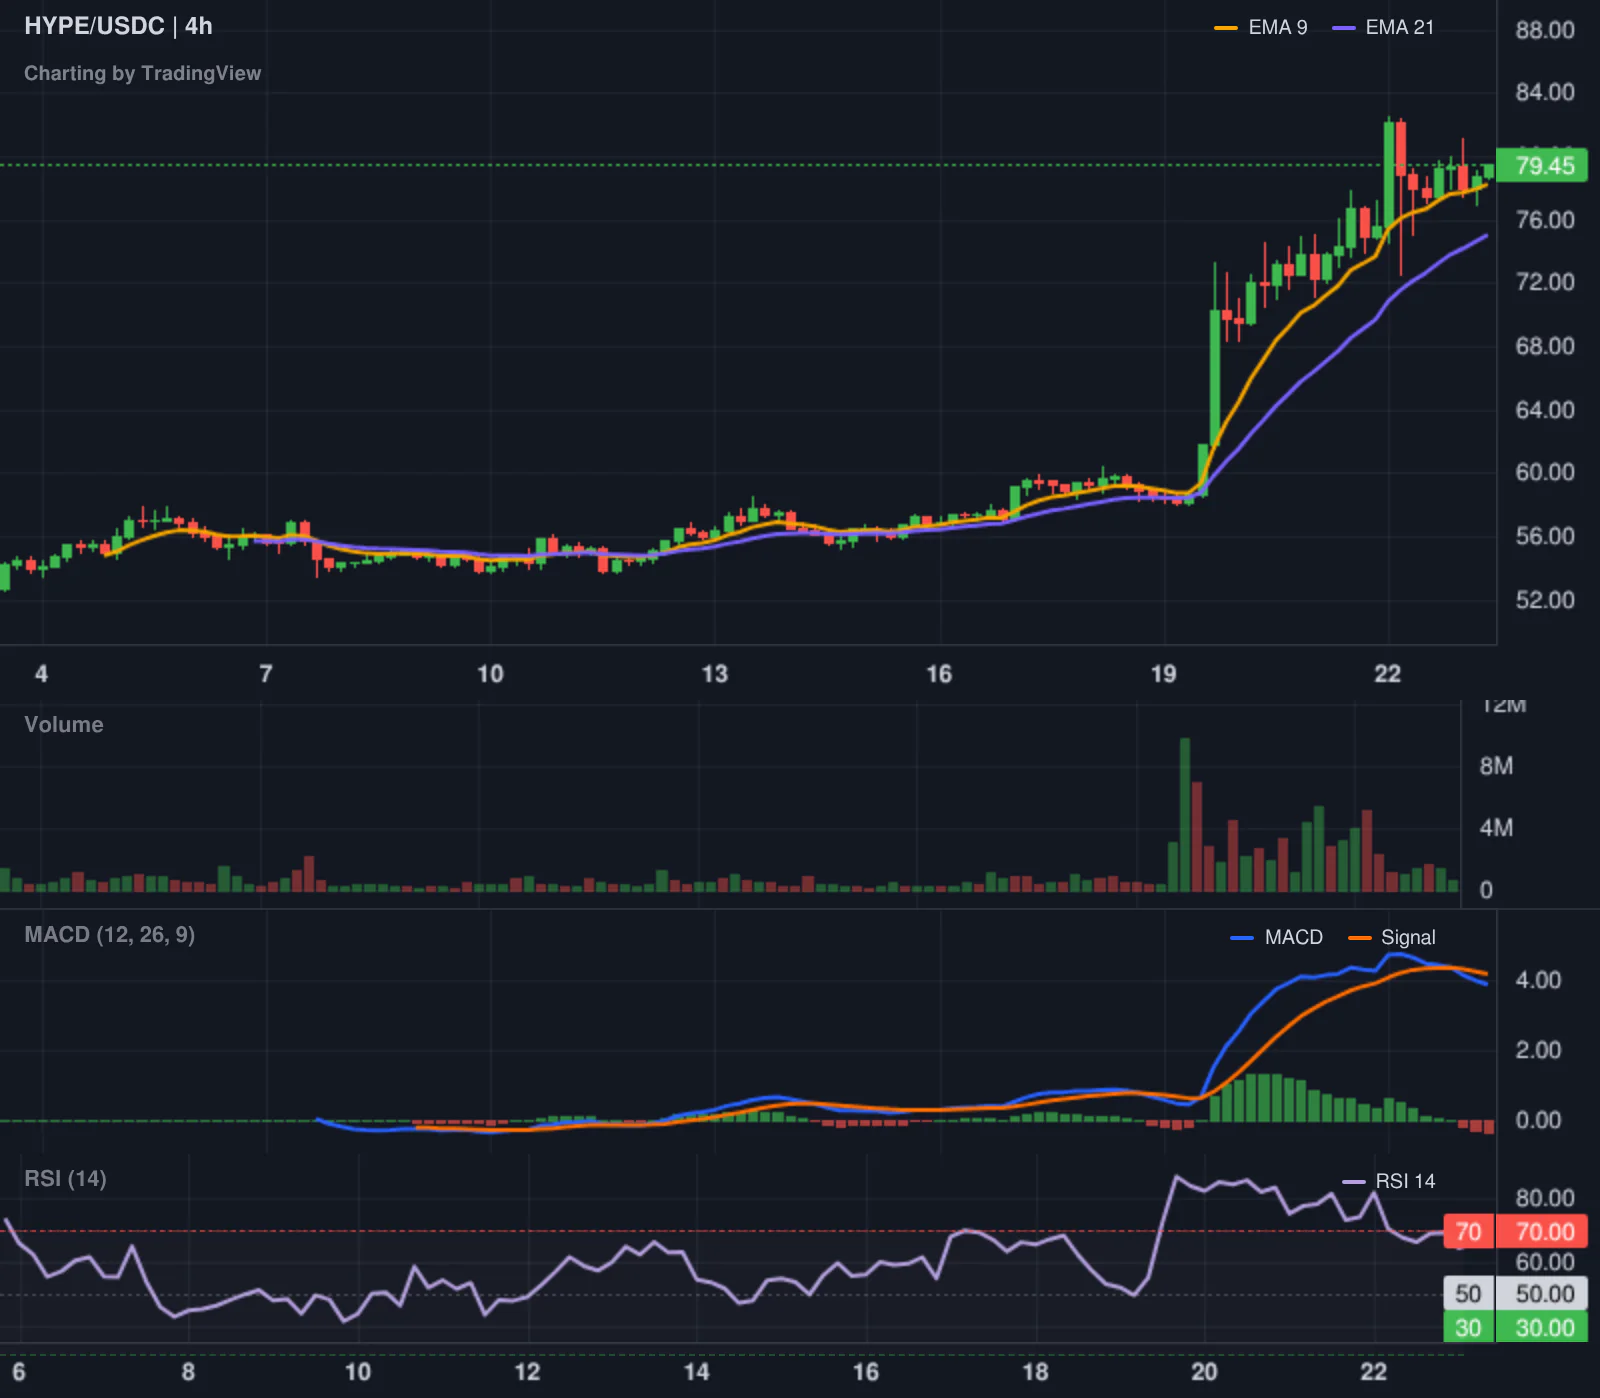
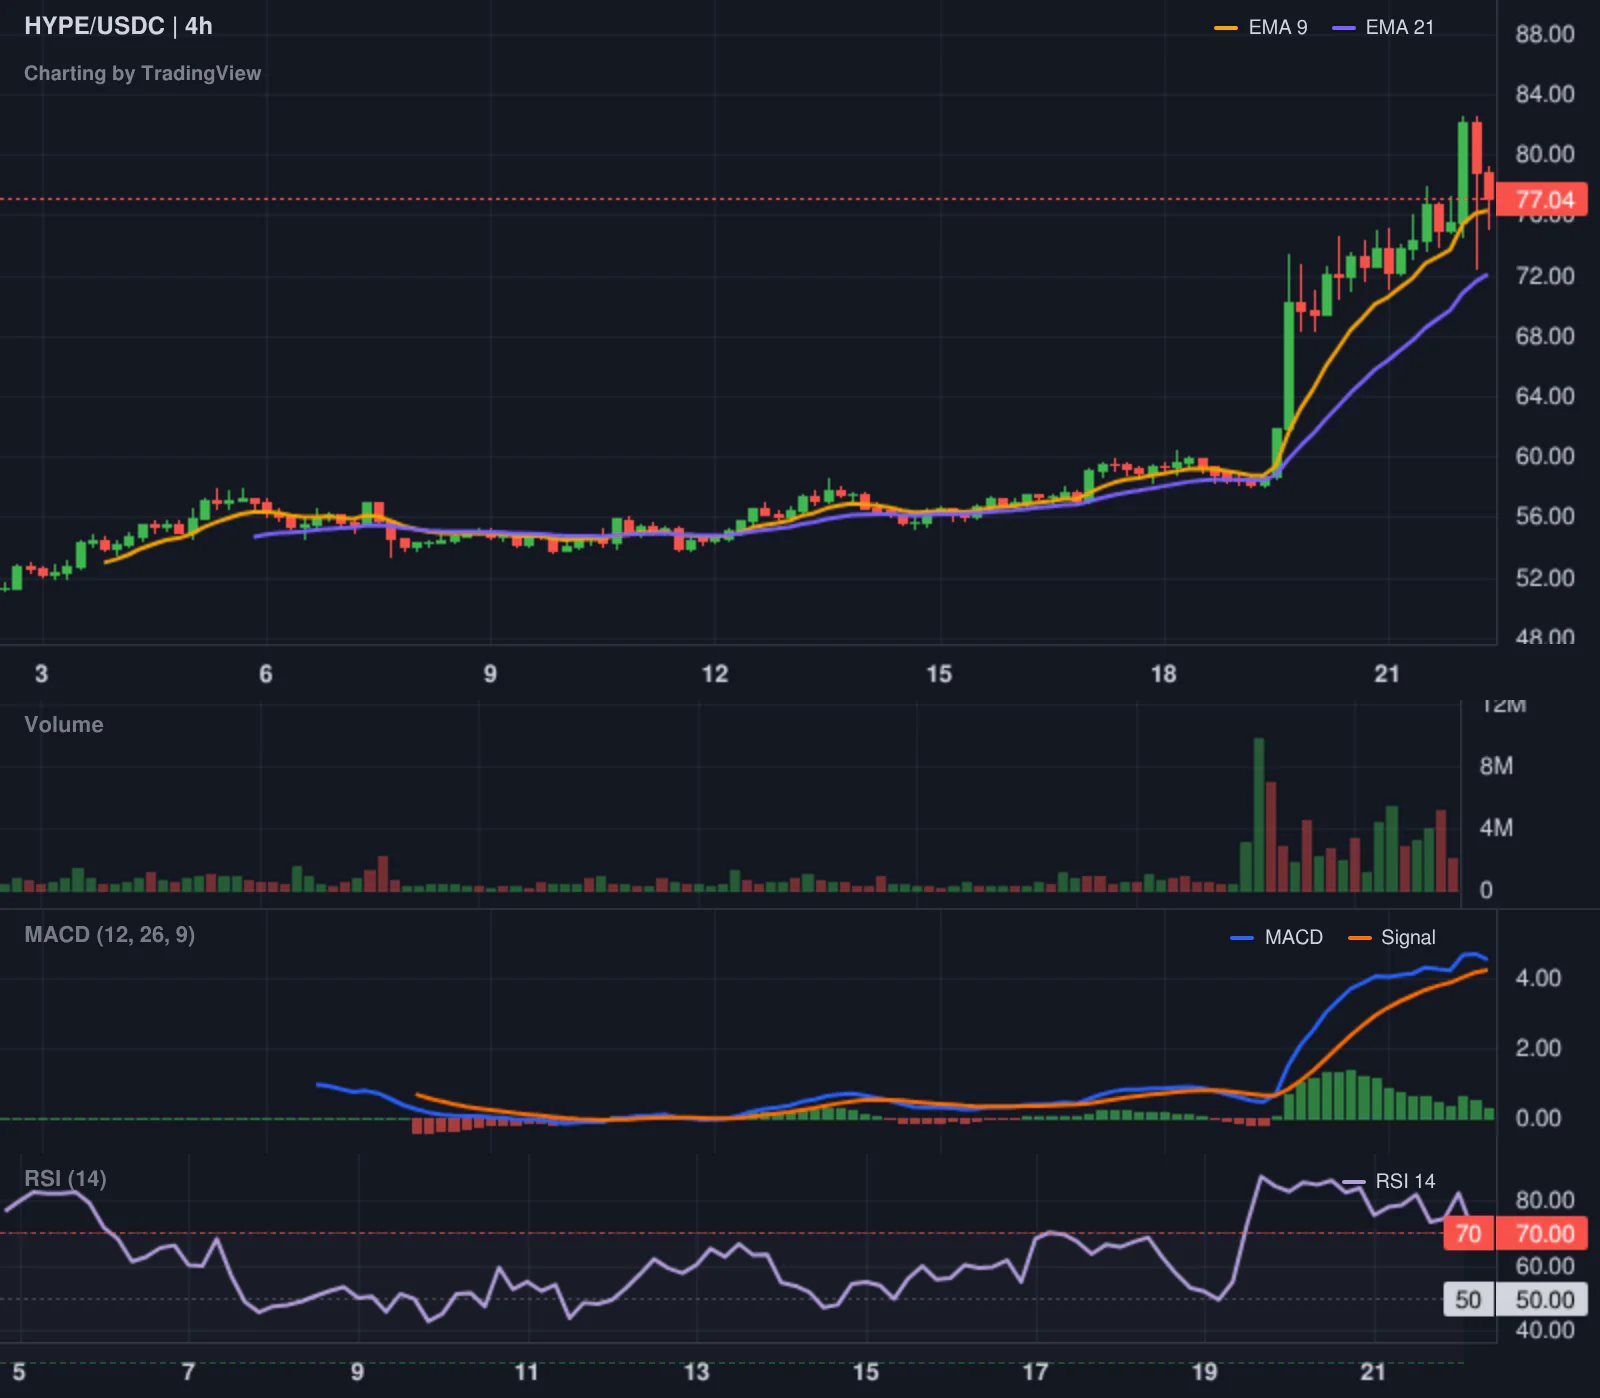
Our tracker has flagged a significant move from a top trader on Hyperliquid. A trader with an all time ROI of 432.6% and $1.55 million in PnL has opened a long position in HYPE at $85.299. The notional value of the trade is $145,141. This is a high confidence bet from a trader who has consistently outperformed the market. Given that HYPE is currently trading around $78.74, this trader is either anticipating a sharp recovery or is comfortable holding through a drawdown.

What to watch next

The market is currently a powder keg of leverage. With derivatives volume dwarfing spot activity, any sudden macro shock could lead to a disorderly liquidation event. The most immediate risk is the Jackson Hole symposium. Kevin Warsh's keynote on Friday will be the first real test of how the new Fed Chair communicates. If the market perceives a higher probability of rate hikes, the leveraged longs in Bitcoin could be squeezed quickly.

Beyond macro, the $80,000 level for BTC is the psychological line in the sand. A clean break above it could trigger a FOMO wave, but a rejection there would likely send the price back toward the $72,000 range. For altcoin traders, the focus remains on USDT dominance. Until that drops below 7%, the "Bitcoin Season" is likely to continue, leaving most altcoins to fight for scraps of liquidity.
Crypto Market Overview | volume collapses as greed persists amid regulatory friction | August 23, 2026
Sigrid Voss·

Crypto Market Overview | volume collapses as greed persists amid regulatory friction | August 23, 2026

Market overview

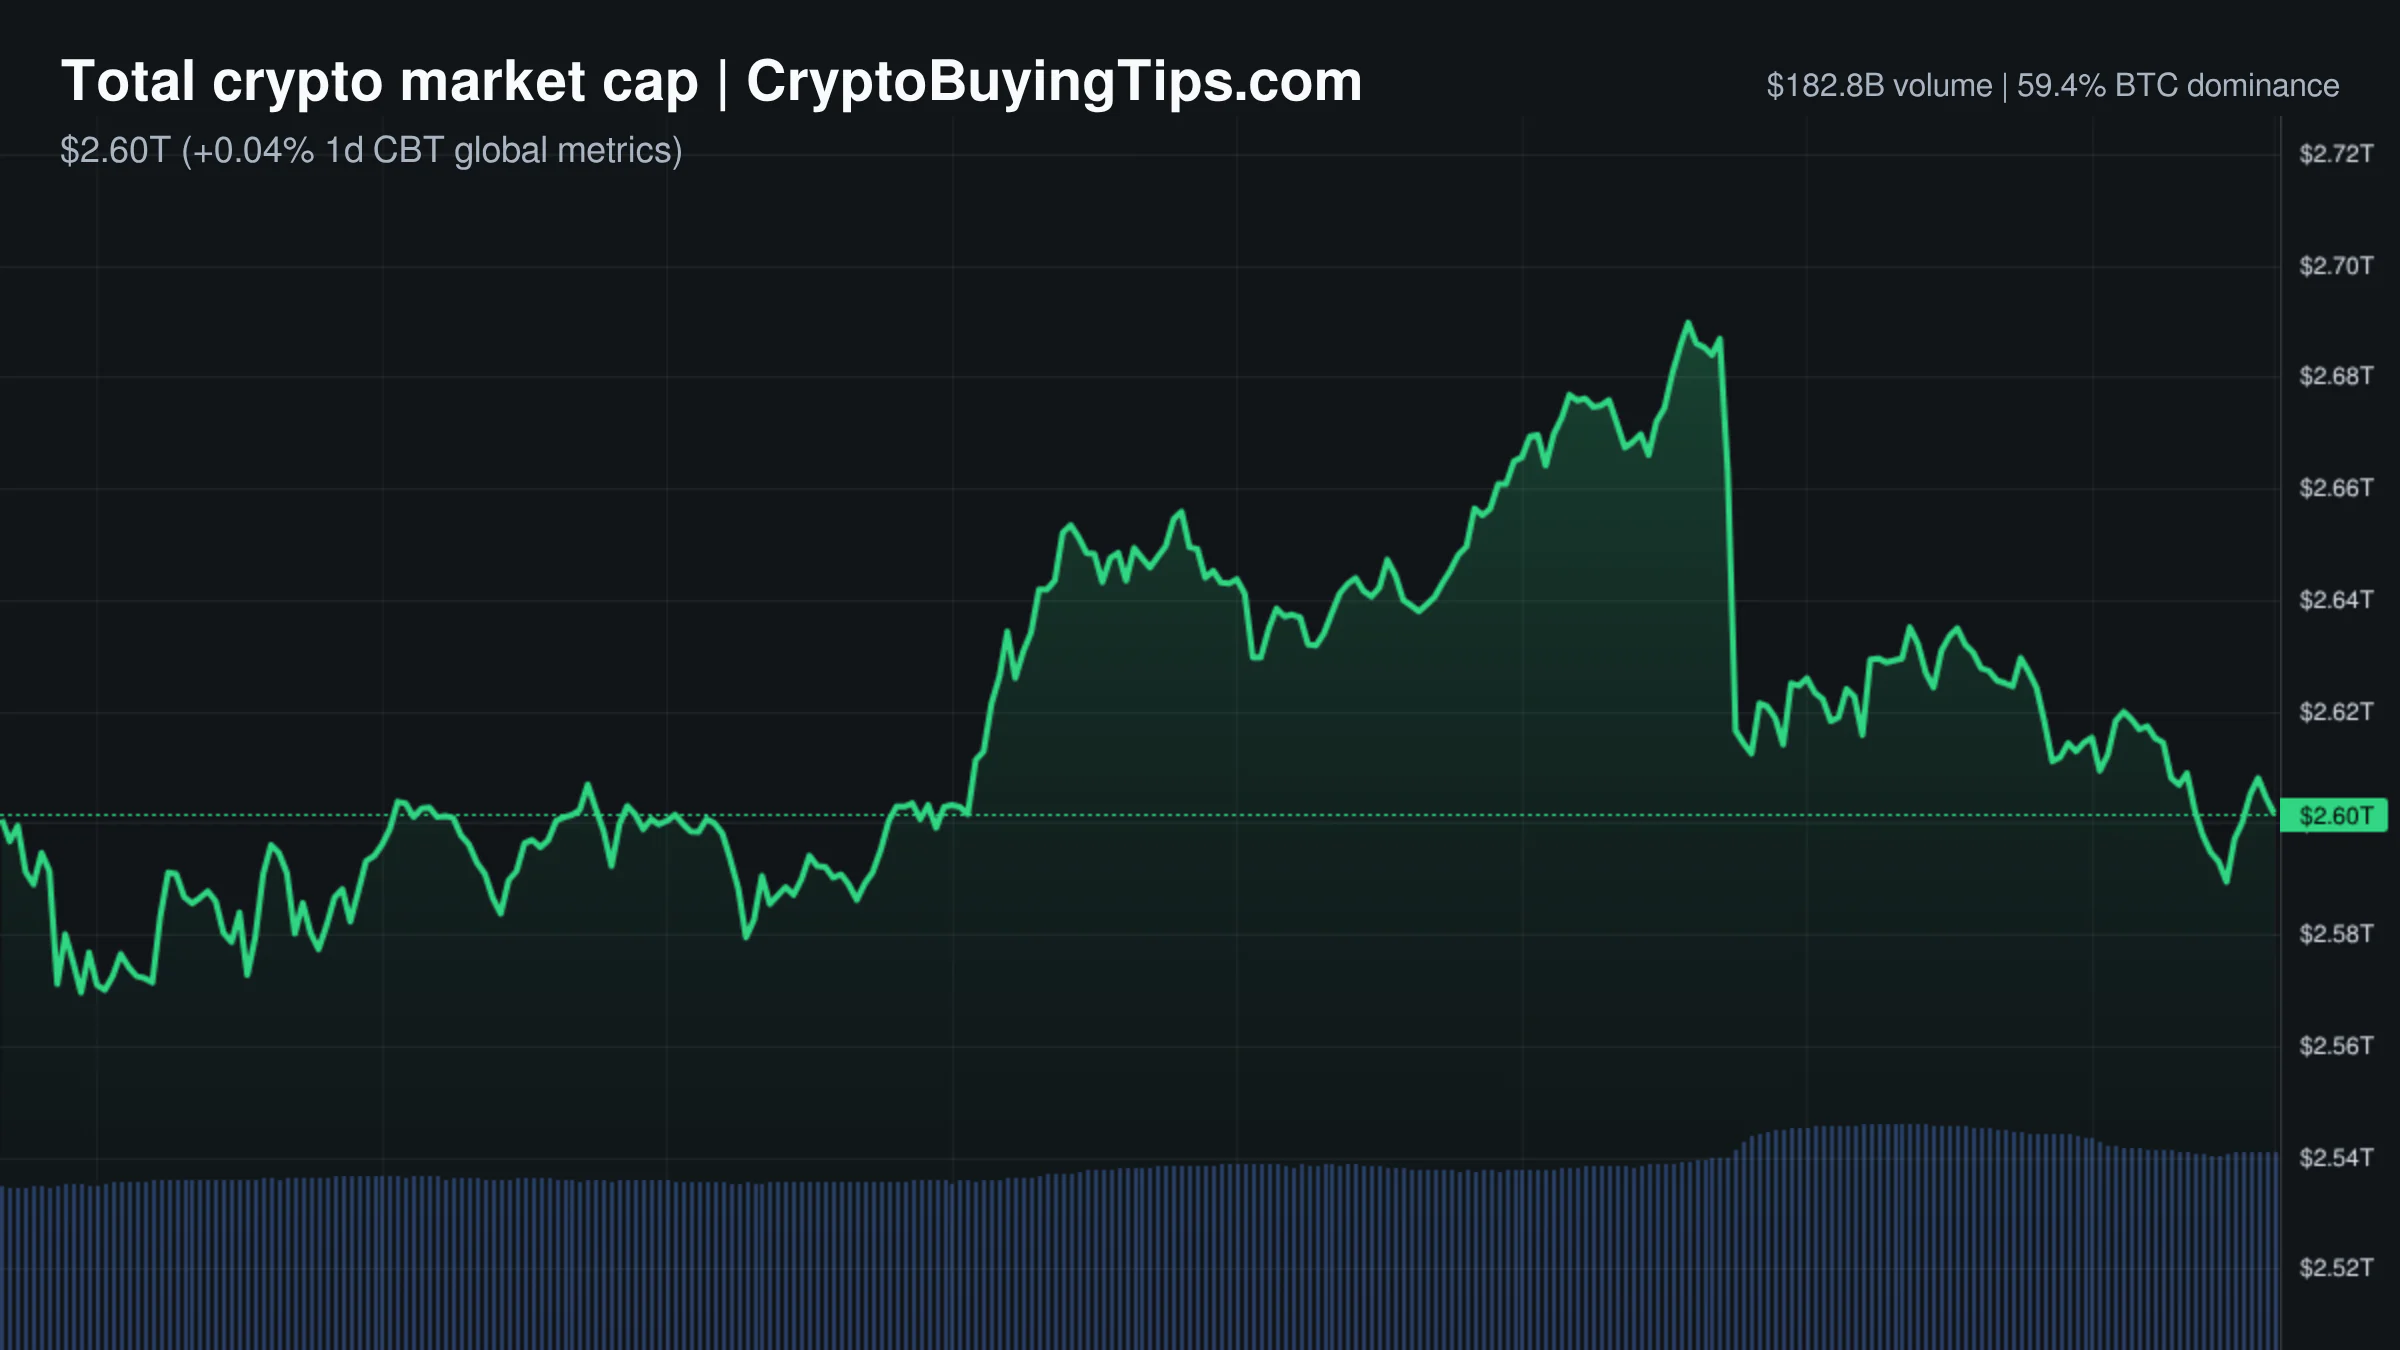
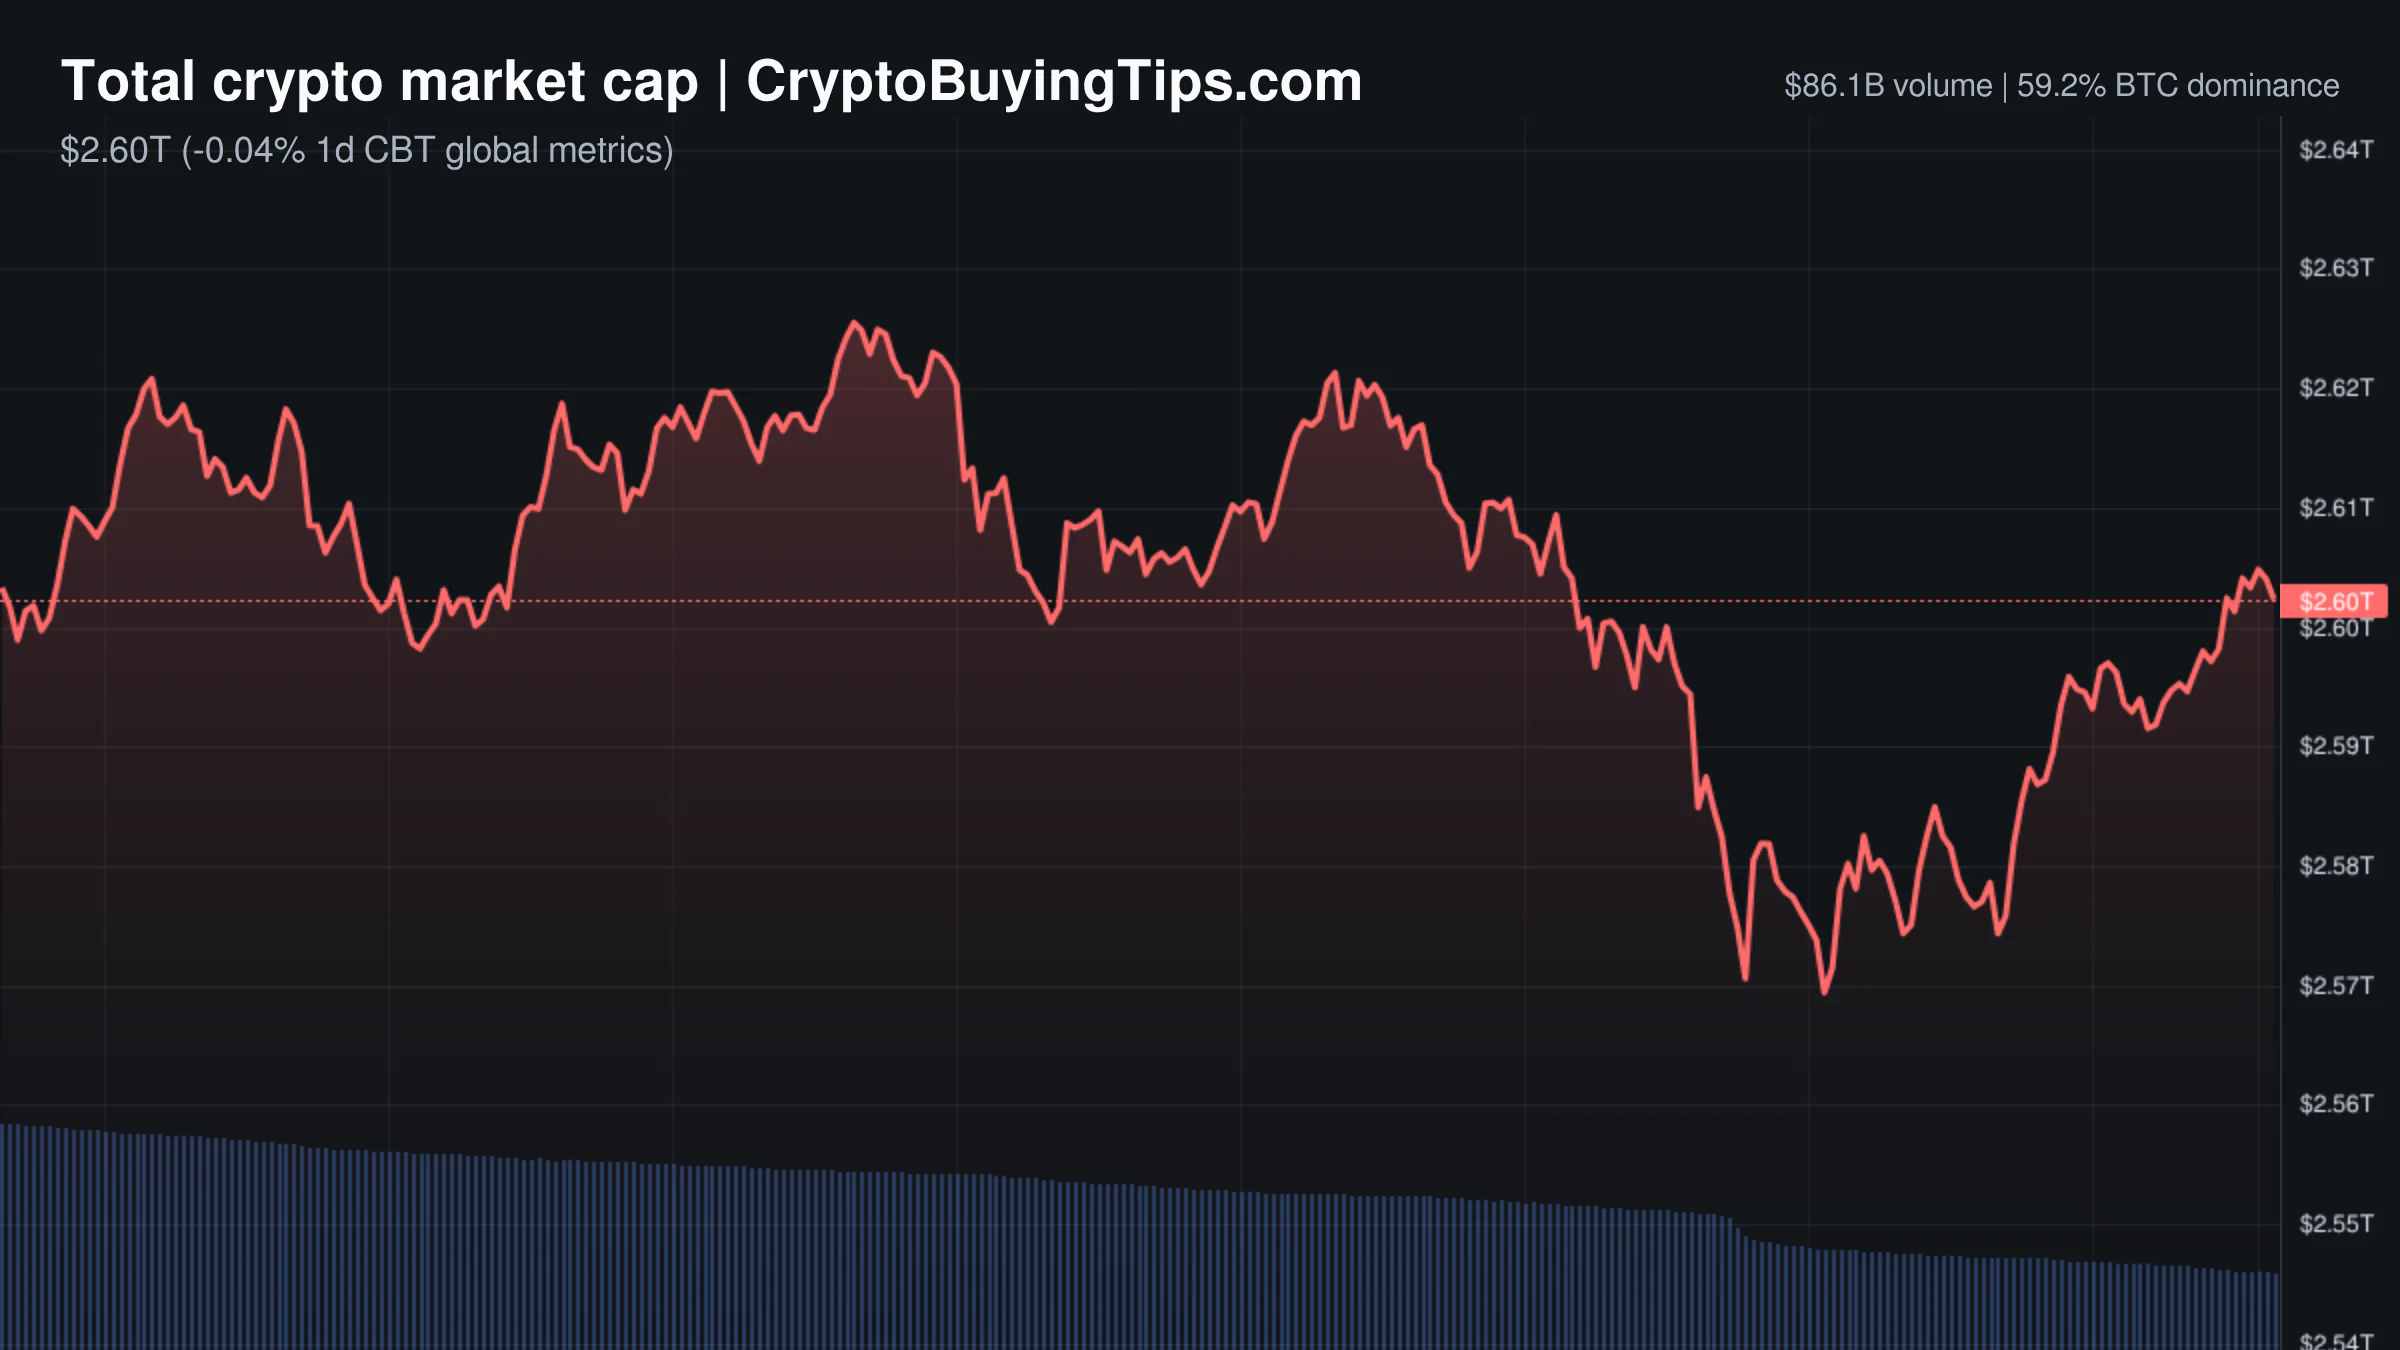
The market is currently in a state of greedy paralysis. While the Fear and Greed Index sits at 76, suggesting a bullish disposition, the actual trading activity has fallen off a cliff. Total market cap is roughly $2.60T, essentially flat, but the volume data is alarming. Spot volume has crashed by 52.54%, and derivatives volume is down nearly 49%. When price stays stable while volume disappears, it usually means the market is simply waiting for someone to tell it what to do.

The imbalance between spot and derivatives is becoming a structural oddity. Perpetuals hold $451.25B in open interest, while traditional futures are a rounding error at $2.38B. This extreme concentration in perps makes the market fragile. A sudden move in either direction could trigger a cascade of liquidations because there is very little spot-market depth to absorb the shock.

Bitcoin dominance is high at 59.22%, and the Altcoin Season Index of 41 confirms we are still in a Bitcoin season. Capital is not rotating into alts; it is simply huddling in the safest available asset while the rest of the market goes quiet. The S&P 500 and NASDAQ are slightly positive, providing a neutral macro backdrop, but the internal crypto data suggests a lack of conviction.

Bitcoin and Ethereum

Bitcoin is trading at $76,804.86, down 0.23% over the last 24 hours. The price is being held up by institutional appetite, specifically through the spot ETFs which saw $2.6 billion in inflows last week. This is the strongest weekly inflow since October, and it provides a significant floor for the price. However, a new technical risk has emerged. A group of developers has warned that AI models are now capable of finding flaws in the core Bitcoin software. While this is a long-term infrastructure concern, it adds a layer of systemic risk that the market is currently ignoring.

Ethereum is slightly up at $2,415.91, but the network is a ghost town. Gas fees are sitting between 0.04 and 0.05 Gwei. While low fees are great for the user, they are terrible for the network's narrative. It suggests that on-chain activity has stalled. Ethereum is also facing a regulatory ceiling. The European Commission is looking at whether to bring DeFi lending vaults under the MiCA framework. If Brussels decides that these vaults are essentially unregulated banks, the compliance burden could force a significant amount of liquidity out of the ecosystem.

Top crypto prices

Bitcoin (BTC) is at $76,804.86, down 0.23%. Ethereum (ETH) is at $2,415.91, up 0.19%. XRP (XRP) is at $1.48, down 0.52%. BNB (BNB) is at $689.9, down 0.27%. Solana (SOL) is at $93.74, up 0.75%. TRON (TRX) is at $0.3435, up 0.14%. Hyperliquid (HYPE) is at $79.37, up 3.55%.

News driving today's market

The primary narrative is the looming threat of MiCA regulation in Europe. The European Commission is questioning the legal status of DeFi lending vaults. Because these vaults function as credit markets but avoid the label of a bank, they are now in the crosshairs. We previously covered this in our DeFi vaults risk analysis and provided a broader look at Mica crypto regulation explained. The risk here is that a regulatory crackdown in the EU often sets a precedent for other jurisdictions.

In the US, prediction markets are facing their own battle. Kalshi is currently off-limits in multiple states as the CFTC pursues new rules. This is a reminder that the "safe harbor" promised by regulators is often a moving target. Similarly, the CEO of Fairmint has warned that tokenized stocks could repeat the 1960s paper crisis. The concern is that fragmented standards and a lack of central oversight could create a systemic failure in how these assets are tracked and settled.

On the technical side, Solana is making progress on its performance goals. The network has cut mainnet slot time to 350 milliseconds. This is a step toward their 200ms goal and improves the user experience by speeding up confirmations. Meanwhile, the GameFi sector took a hit as The Sandbox stopped bridging on Base and BNB chains following an exploit. While the impact was small, it highlights the ongoing security fragility of cross-chain bridges.

Finally, Zcash (ZEC) is seeing a surge in interest. Futures volume has hit nearly $10 billion amid a Grayscale ETF push. This is a speculative move, but it shows that institutional interest is expanding beyond the two biggest assets.

Social intelligence

The whale data is mixed and suggests a preparation for movement. A single whale deposited $197 million worth of Bitcoin into Binance. Deposits of this size into exchanges are typically a signal of intent to sell. This contrasts with the behavior of nation-states. El Salvador continues its daily buy, bringing its total to over 7,751 BTC. Bhutan has also been active, transferring about $835k of BTC to new addresses.

Meme coin volatility remains high despite the general market stagnation. The Trump team transferred $6.21 million in $TRUMP tokens to OKX, which could indicate a liquidation event. On the other side, $FARTCOIN saw a brutal five-minute window where seven large wallets were liquidated for nearly $13 million. This is the reality of the current market: the majors are flat, and the memes are a casino where the house is winning.

Trading ideas worth watching

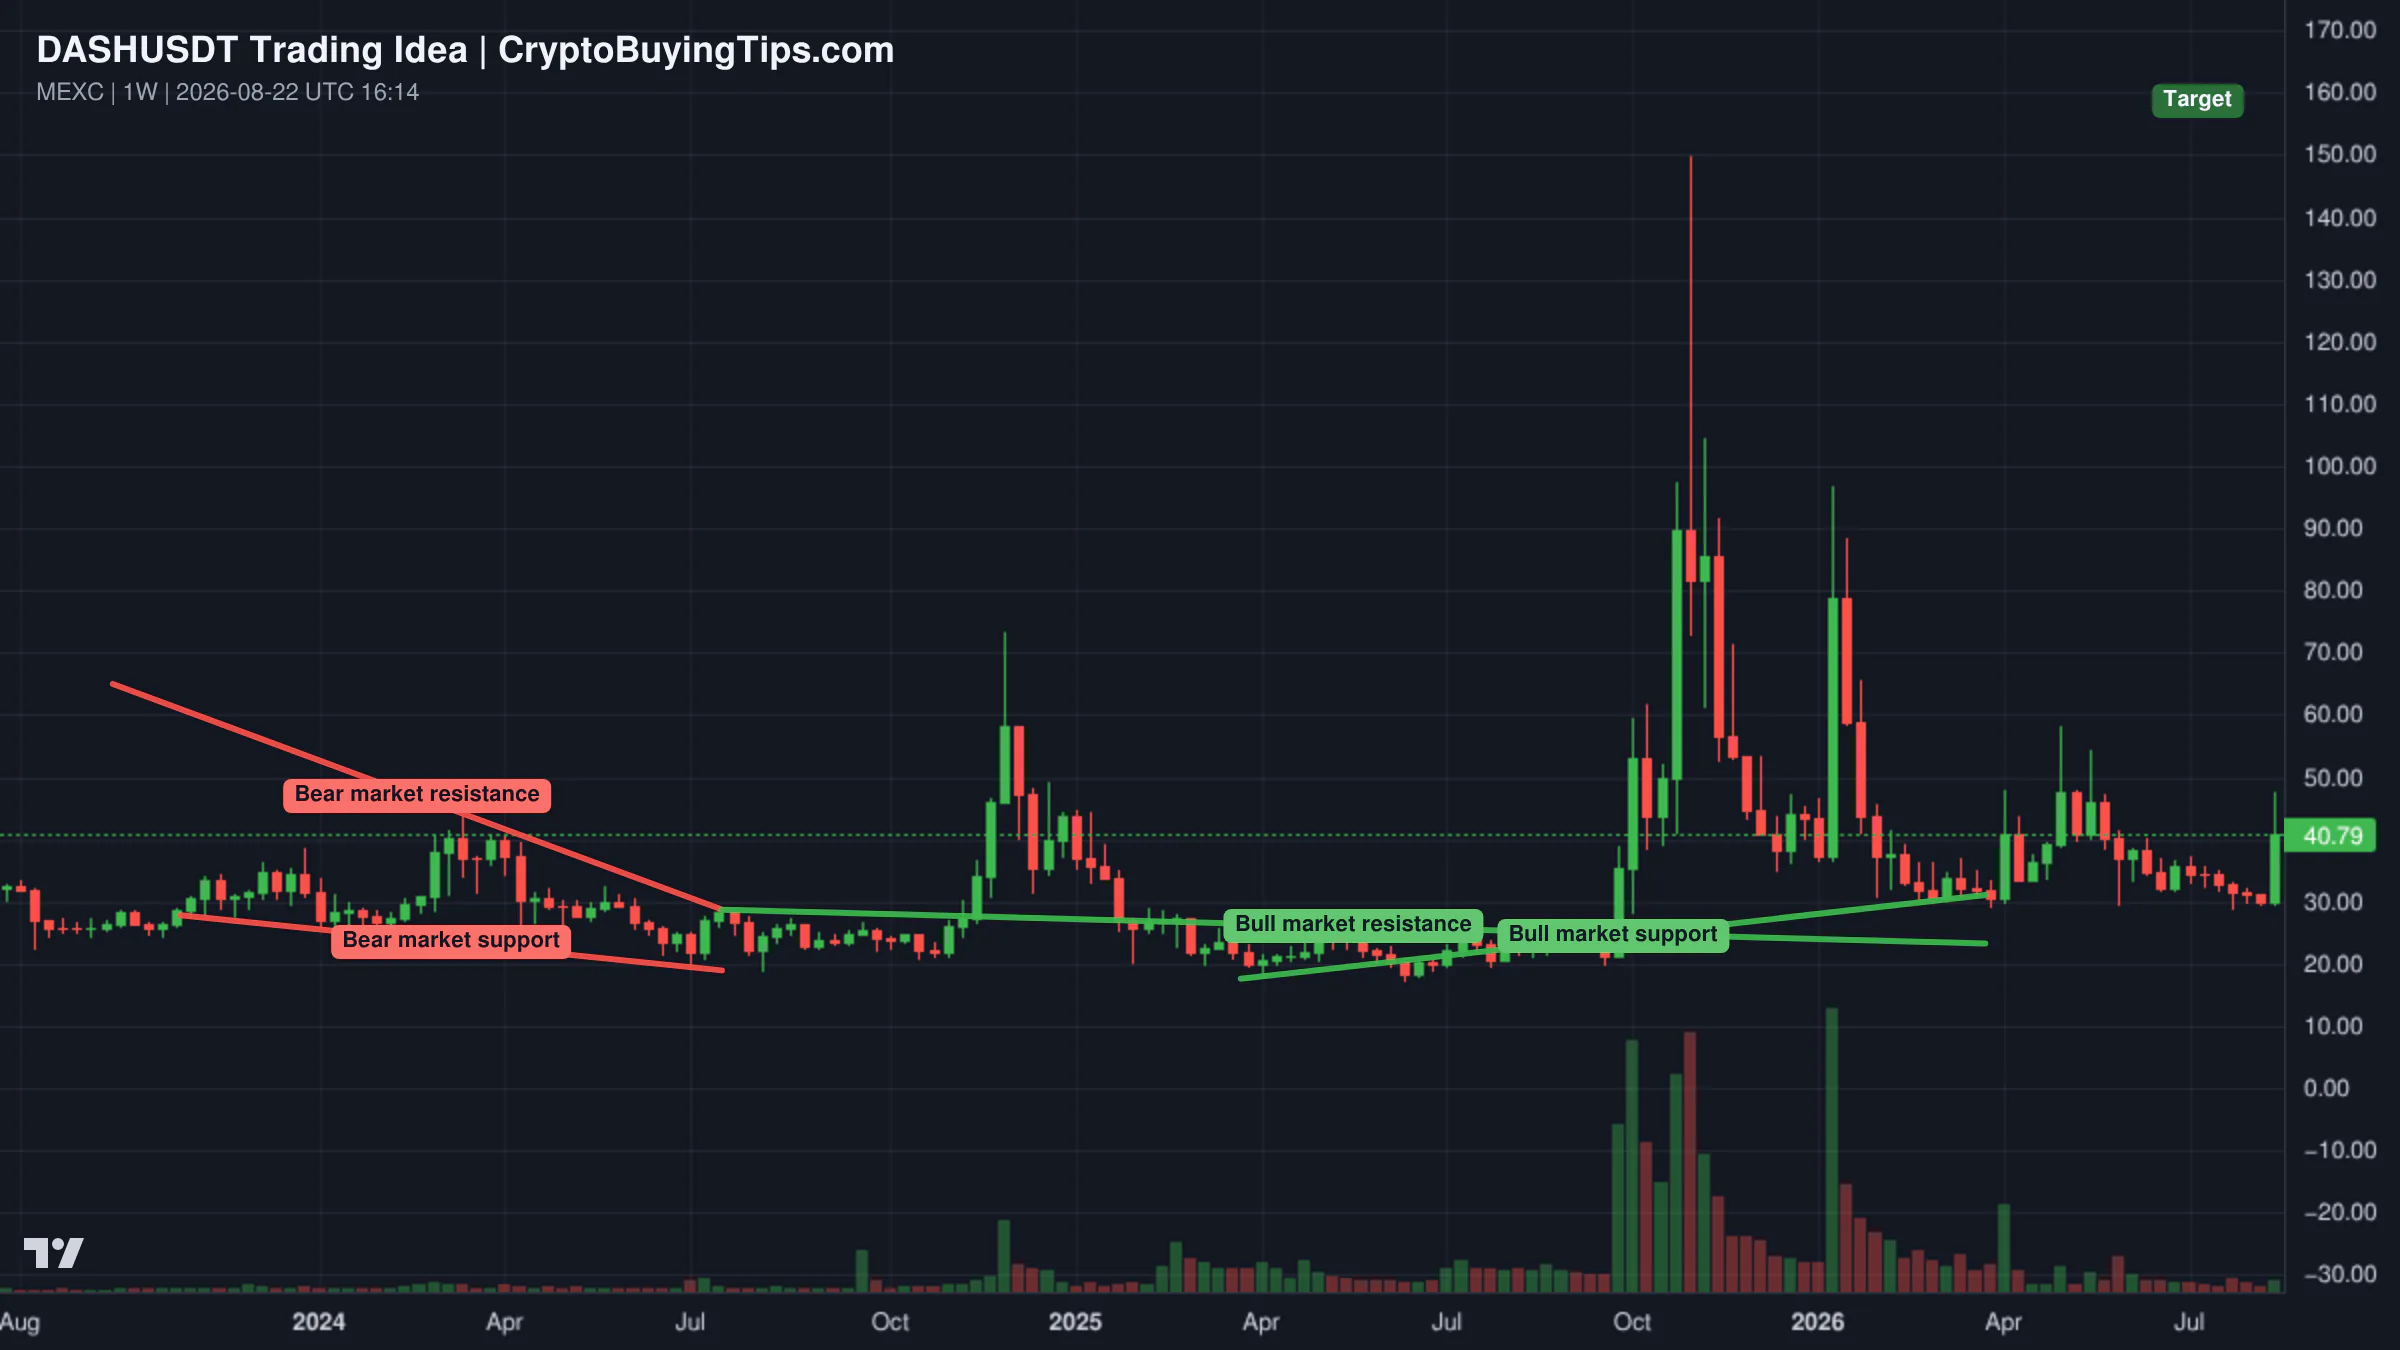
Dash is showing a long-term bullish structure. The asset has been forming a rising channel since March 2024, with higher highs and higher lows. The immediate target is $193, which could be hit within the next two months. If the current market cycle continues, some analysts see a path to a new all-time high of $1,220 by 2027. The key here is the volume since the June 2025 bottom, which suggests a strong accumulation phase. The setup is a buy-and-hold play, as leverage is unnecessary for a small-cap asset with this much growth potential.

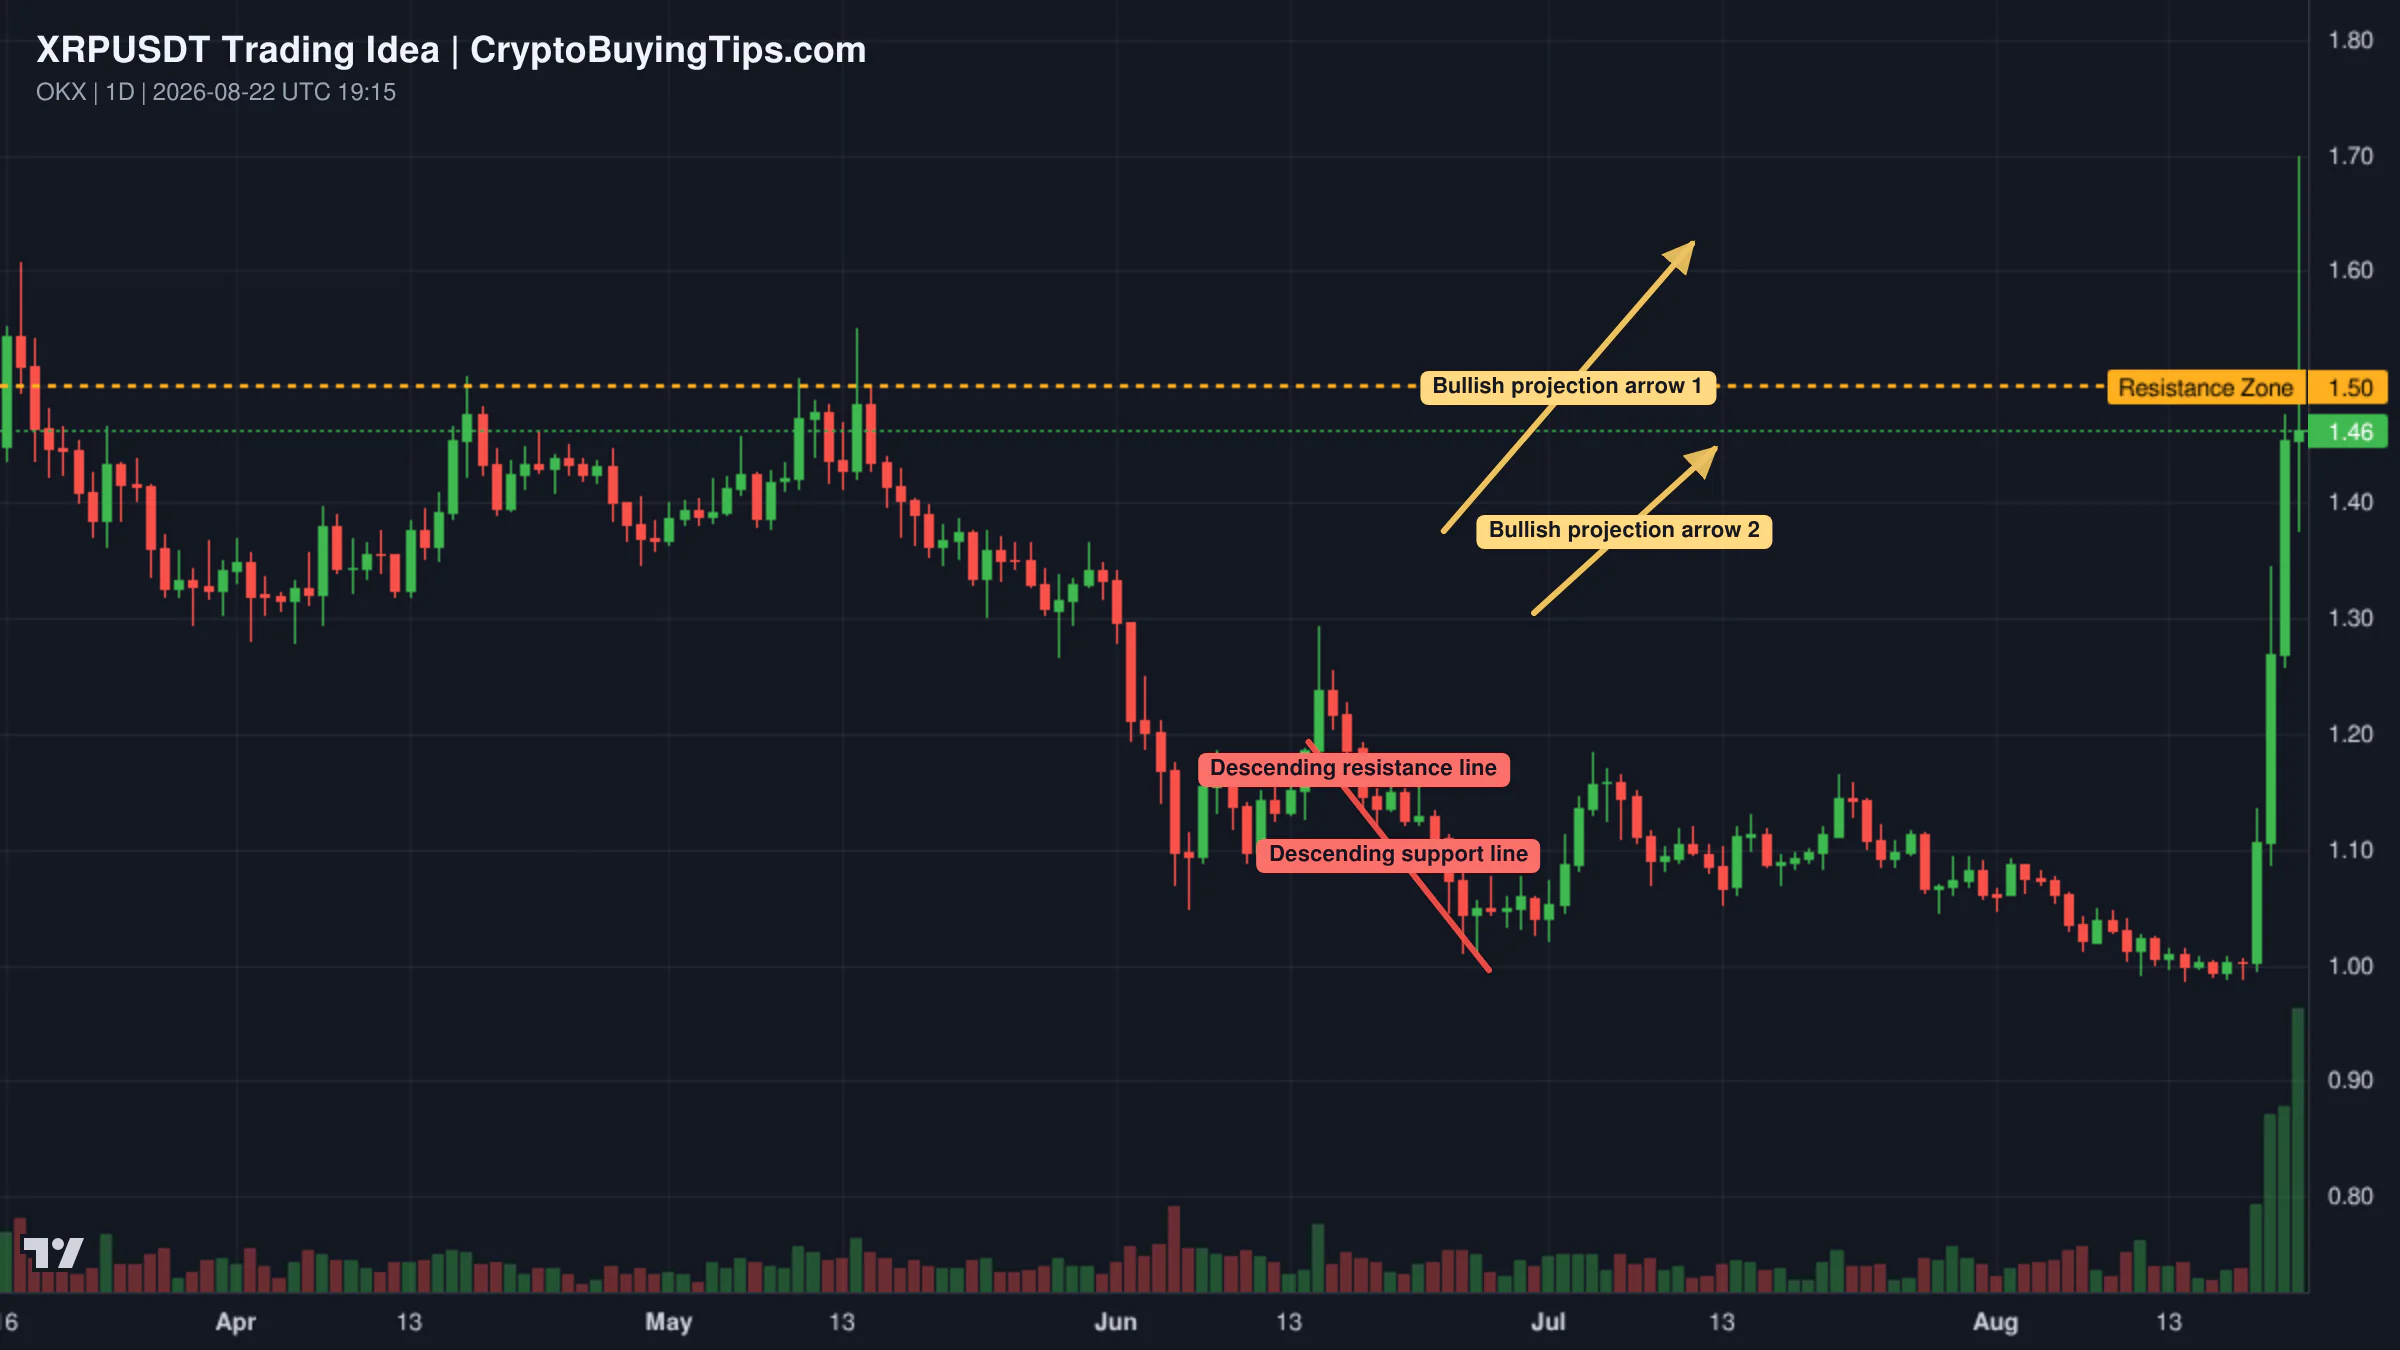
Redrawn XRPUSDT 1D trading idea chart for XRP – +50% Later, What’s Next?Redrawn DASHUSDT 1W trading idea chart for Dash $1,220 New All-Time High Yields 3,000% Profits Potential

XRP is currently testing a major resistance zone at $1.50. After a 50% surge, the asset is at a crossroads. If sellers dominate at $1.50, we expect a pullback to the $1.23 to $1.25 range, which would provide a better entry for long positions. However, if XRP breaks above $1.60, the momentum shifts back to the bulls, and the psychological target becomes $2.00. Chasing the move now is risky, but a break of $1.60 would be a strong confirmation of a continuation.

Dogecoin has recovered from its bottom range and is moving into bullish territory. The current objective is the $0.25 to $0.30 range, which represents a 200% to 300% gain from recent lows. The technical setup shows that the August 2026 bottom is higher than the October 2023 low, signaling the end of a bearish cycle. Long-term targets are much higher, but the short-term focus remains on the $0.30 resistance.

Smart Money Signals — Hyperliquid Leaderboard

Hyperliquid LONG HYPE leaderboard chart

Our leaderboard tracker has flagged a high-confidence long position in Hyperliquid. A top trader with an all-time ROI of 432.6% and $1.55 million in PnL has opened a long at $85.299. The notional value of the trade is $145,141. This trader has a strong 30-day track record, and their entry suggests that the current dip in HYPE is viewed as a buying opportunity.

Altcoin Spotlight

Hyperliquid deserves attention today. It is up 3.55% while most of the market is flat or red. The combination of a top-tier trader going long and the asset's ability to decouple from the general market stagnation is a bullish sign. With a market cap of $20 billion, HYPE is becoming a significant player in the derivatives space, which is where the majority of current market volume is concentrated.

What to watch next

The market is essentially in a standoff. On one side, we have massive institutional inflows via ETFs and the steady accumulation by nation-states. On the other, we have a systemic collapse in trading volume and a regulatory environment that is becoming increasingly hostile toward DeFi.

The most important metric to watch over the next few days is the volume. If the total market cap remains stable but volume continues to dry up, we are looking at a market that is devoid of conviction. This often leads to a "flash" event where a small amount of selling triggers a massive move because there are no buyers waiting in the wings.

We also need to monitor the MiCA developments. If the European Commission moves forward with regulating DeFi vaults, it will create a liquidity vacuum in the EU that could spill over into the global market. For now, the greed index tells us traders are optimistic, but the volume data tells us they are too scared to actually place their bets.

Crypto Market Overview | Spot accumulation rises while derivatives volume cools | August 22, 2026
Sigrid Voss·

Crypto Market Overview | Spot accumulation rises while derivatives volume cools | August 22, 2026

Market overview

The market is currently exhibiting a curious divergence between how people are trading and what they are actually buying. Total market capitalization sits at $2.62 trillion, showing a slight daily dip of 1.68%, yet the underlying activity suggests a shift in regime. Spot trading volume has surged by 16.21%, while derivatives volume has contracted by roughly 5%. This indicates that the current price action is being driven by actual asset accumulation rather than the usual leveraged gambling. It is a rare moment of sobriety in a market that typically prefers 100x leverage to fundamental analysis.

Sentiment remains firmly in greed territory with a Fear and Greed Index score of 76. However, this greed is not being distributed evenly. Bitcoin dominance is high at 58.86%, and the Altcoin Season Index remains neutral at 28 to 40. We are firmly in a Bitcoin season. Capital is consolidating in the largest asset while the broader altcoin market waits for a signal that it is safe to rotate. Stablecoin dominance is at 9.77%, suggesting that while some capital is on the sidelines, the recent spike in stablecoin volume (+12.84%) points to active positioning for the next leg up.

The macro backdrop is cautiously optimistic. The S&P 500 and NASDAQ are both slightly positive, providing a risk-on environment that supports crypto. The most interesting data point is the surge in DeFi volume, which jumped nearly 40% in 24 hours. This suggests that while the headline indices are sideways, there is significant activity happening within decentralized protocols, likely driven by the rotation of spot capital into yield-bearing assets.

Bitcoin and Ethereum

Bitcoin is trading at $77,028.82, down slightly by 0.97% over the last day. The recent rally toward $80,000 was not a random event. It was fueled by a combination of a record short squeeze, which wiped out $1.21 billion in bearish bets, and a specific macro catalyst. Analysts are pointing to a Treasury buyback tweak that triggered a "not-QE" trade, pulling long-term yields off 19-year highs. The market has essentially decided that any Treasury action that looks like quantitative easing, even if the government denies it, is a green light for Bitcoin.

Ethereum is priced at $2,411.24, managing a modest gain of 0.61%. The network is currently an eerie ghost town in terms of cost, with gas fees sitting between 0.1 and 0.23 Gwei. While low fees are great for the user, they reflect a lack of intense on-chain competition. Ethereum is struggling to keep pace with Bitcoin's dominance, and its price action remains tethered to the broader market sentiment rather than its own network catalysts. The gap between the two assets continues to widen as institutional flows favor the simpler narrative of Bitcoin as digital gold.

Top crypto prices

The top of the market is a mixed bag of steady growth and sudden spikes. XRP is the standout performer, jumping 8.06% to $1.48. BNB has climbed 1.89% to $692.05, while Solana is up 1.65% at $93.02. TRON remains stable with a 0.86% increase to $0.3431. Hyperliquid is also showing strength, rising 2.52% to $76.64.

News driving today's market

Washington is suddenly very interested in crypto, which is usually a signal to be cautious. President Trump has been pushing for a "fair version" of the Clarity Act, while the SEC has proposed Regulation Crypto Assets. This proposal would allow certain offerings up to $5 million over four years without full registration. This is a significant shift toward a safe harbor. We previously covered the SEC safe harbor implications, and the current data suggests the market is still digesting whether this is genuine progress or a political trap.

There is a clear divide in how this legislation is viewed. Some see it as a path to institutional adoption, while others, including some legal experts, argue the Clarity Act is actually anti-crypto. This tension is keeping the market from a full-blown rip. The regulatory environment remains fragmented. We previously noted how the SEC stalls everything else while other agencies move forward.

On the global front, Japan is showing signs of maturation. Nomura's Laser Digital has become the first new crypto exchange authorized in Japan since 2022. This is a bullish signal for institutional liquidity. Meanwhile, the "not-QE" narrative surrounding Treasury bond buybacks continues to be the primary driver for Bitcoin's price, as it reduces the pressure on long-term yields and encourages a risk-on appetite.

Social intelligence

The social feed is a reminder that crypto is a high-stakes game of copy-paste. A report from @lookonchain highlights a trader who lost $2 million by copying the wrong address from their transaction history. It is a stark reminder that self-custody is only as secure as the user's attention span.

In the Ethereum ecosystem, there is a growing friction between the community and institutional holders. Base creator Jesse Pollak recently defended Coinbase against accusations of "selling ETH," noting that Coinbase is the largest non-DAT holder of the asset. This debate over the "morality" of institutional selling is a distraction from the actual flow of funds. While the community argues about ethics, whales are taking profits. @lookonchain noted a Matrixport-linked whale closed a position of 40,000 ETH for a $9.9 million profit.

Geopolitical risk is also creeping back into the conversation. Reports of a U.S. Navy P-8A Poseidon transiting the Taiwan Strait have surfaced via @DeItaone. While the market hasn't reacted yet, any escalation in this region typically triggers a flight to safety, which can either send Bitcoin higher as a hedge or crash the entire risk-on trade. Finally, the derivatives market is feeling the pain, with over $5 billion in leveraged positions liquidated over the last 72 hours.

Trading ideas worth watching

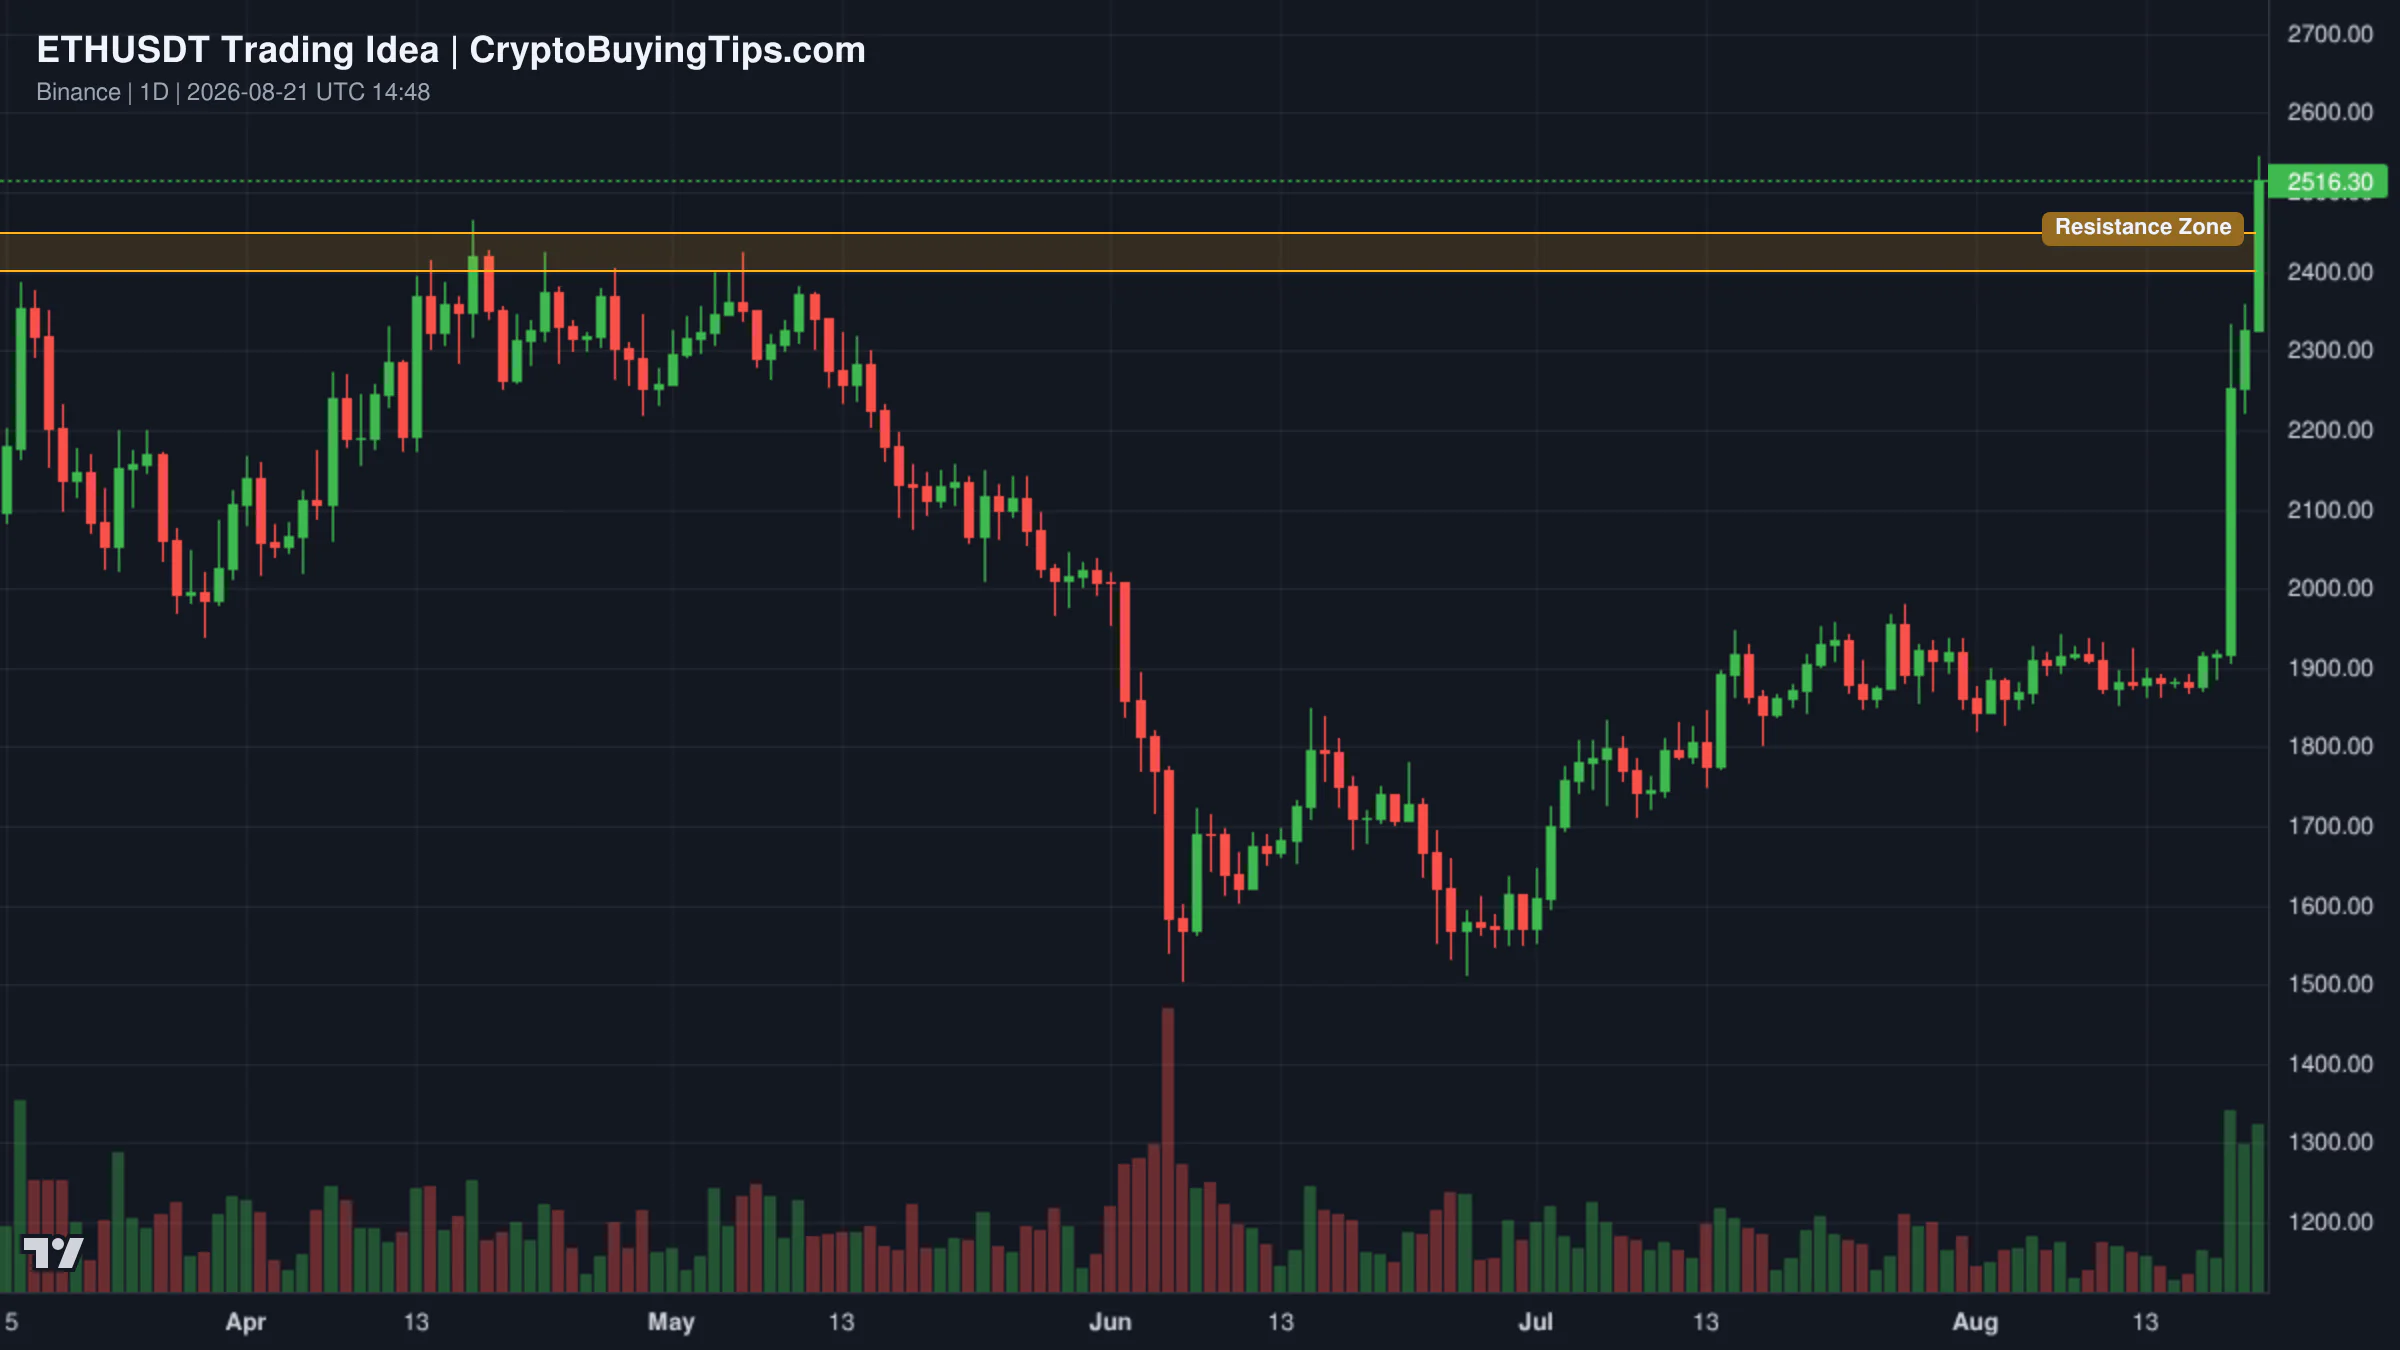
Ethereum is currently testing a major resistance zone between $2,400 and $2,450. This area has rejected price multiple times in the past. With the RSI entering overbought territory, the probability of a short-term pullback is high. A strong daily close above $2,450 is required before a bullish continuation is likely. Chasing longs at this level is risky.

Redrawn ETHUSDT 1D trading idea chart for Ethereum at Major Resistance: Rejection or Breakout?

Bitcoin appears to be mirroring a breakout structure from April 2019. The setup involves a prolonged downtrend inside a falling wedge followed by a sweep of liquidity into a bottom consolidation zone. Price has already crossed above the 200-day exponential moving average. If this fractal holds, we could be entering a multi-month expansion phase. The key is whether Bitcoin can maintain its current momentum without a deep retest of the breakout zone.

Redrawn BTCUSD 1D trading idea chart for $BTC : Is Bitcoin repeating its massive 2019 breakout structure?

NEAR is showing signs of Wyckoff accumulation. The asset printed a selling climax at 1.183 and has since established a last point of support at 1.538. Price has reclaimed the range and pushed above buy-side liquidity at 2.116. The key area to watch is the imbalance zone between 1.627 and 1.853. If the asset holds this zone, the next target is the automatic rally around $2.55.

Smart Money Signals — Hyperliquid Leaderboard

Hyperliquid LONG HYPE leaderboard chart

Our leaderboard tracker has flagged a significant move in HYPE. A top trader with a 433% 30-day ROI and $1.55 million in all-time PnL has opened a long position at $85.299. The notional value of the trade is $145,141. Given the trader's track record and the current momentum of the asset, this suggests a high-conviction bet on continued upside for the Hyperliquid token.

Altcoin Spotlight

XRP deserves attention today. While most of the market is moving sideways or slightly down, XRP has surged over 8%. This move is disconnected from the general market trend and suggests asset-specific catalysts are at play. In a market where Bitcoin dominance is suffocating most alts, a move of this magnitude usually indicates that institutional or insider positioning is happening behind the scenes.

What to watch next

The immediate focus is on the $80,000 psychological level for Bitcoin. The "not-QE" trade has provided the fuel, but the market needs a fresh catalyst to break through the overhead resistance. We will be watching the Treasury's next set of communications to see if the buyback narrative continues to support the rally.

For Ethereum, the battle at $2,450 is the only thing that matters. A failure to break this level will likely lead to a correction toward the next support zone, especially as the RSI cools off.

Finally, the legislative battle over the Clarity Act in Washington will determine the long-term trajectory of the market. If the bill is passed in a version that the industry views as "anti-crypto," the current greed will evaporate quickly. If the SEC's safe harbor proposals are formalized and expanded, we may finally see the start of a genuine altcoin season. For now, the market is playing a waiting game, with spot buyers slowly building positions while the gamblers are liquidated.