Market Overviews

Daily crypto market overviews, trend analysis, and key updates from our editorial team.

Crypto Market Overview | Regulatory shifts diverge from market sentiment | May 19, 2026
Sigrid Voss·

Crypto Market Overview | Regulatory shifts diverge from market sentiment | May 19, 2026

Market overview

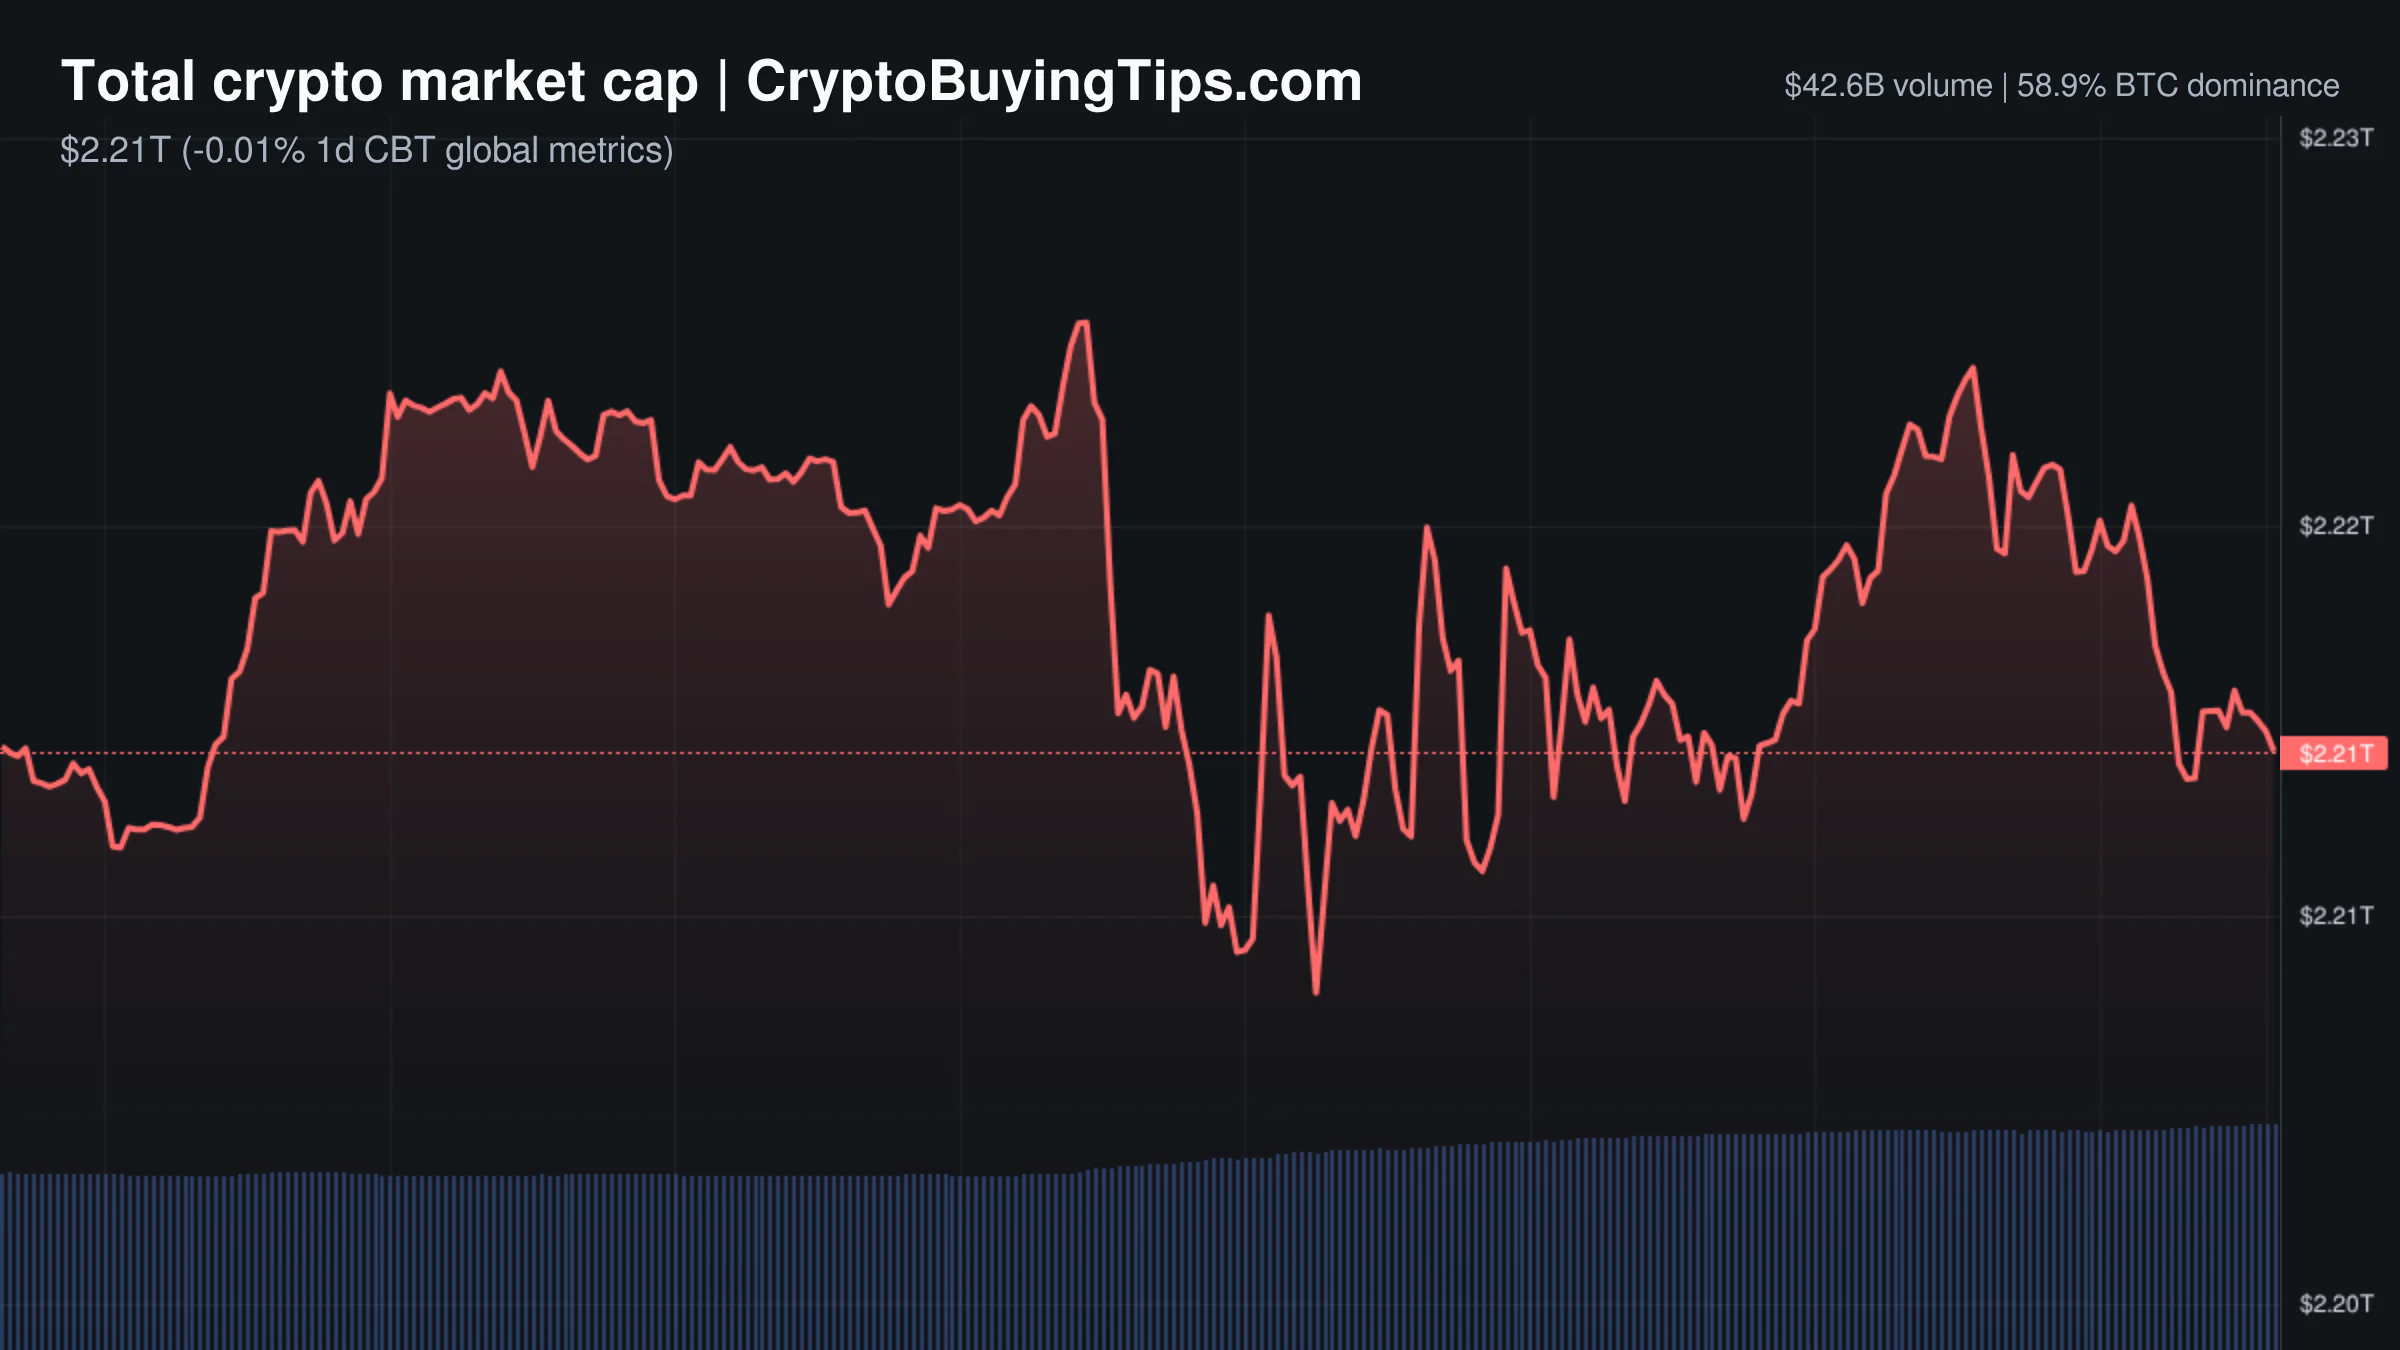
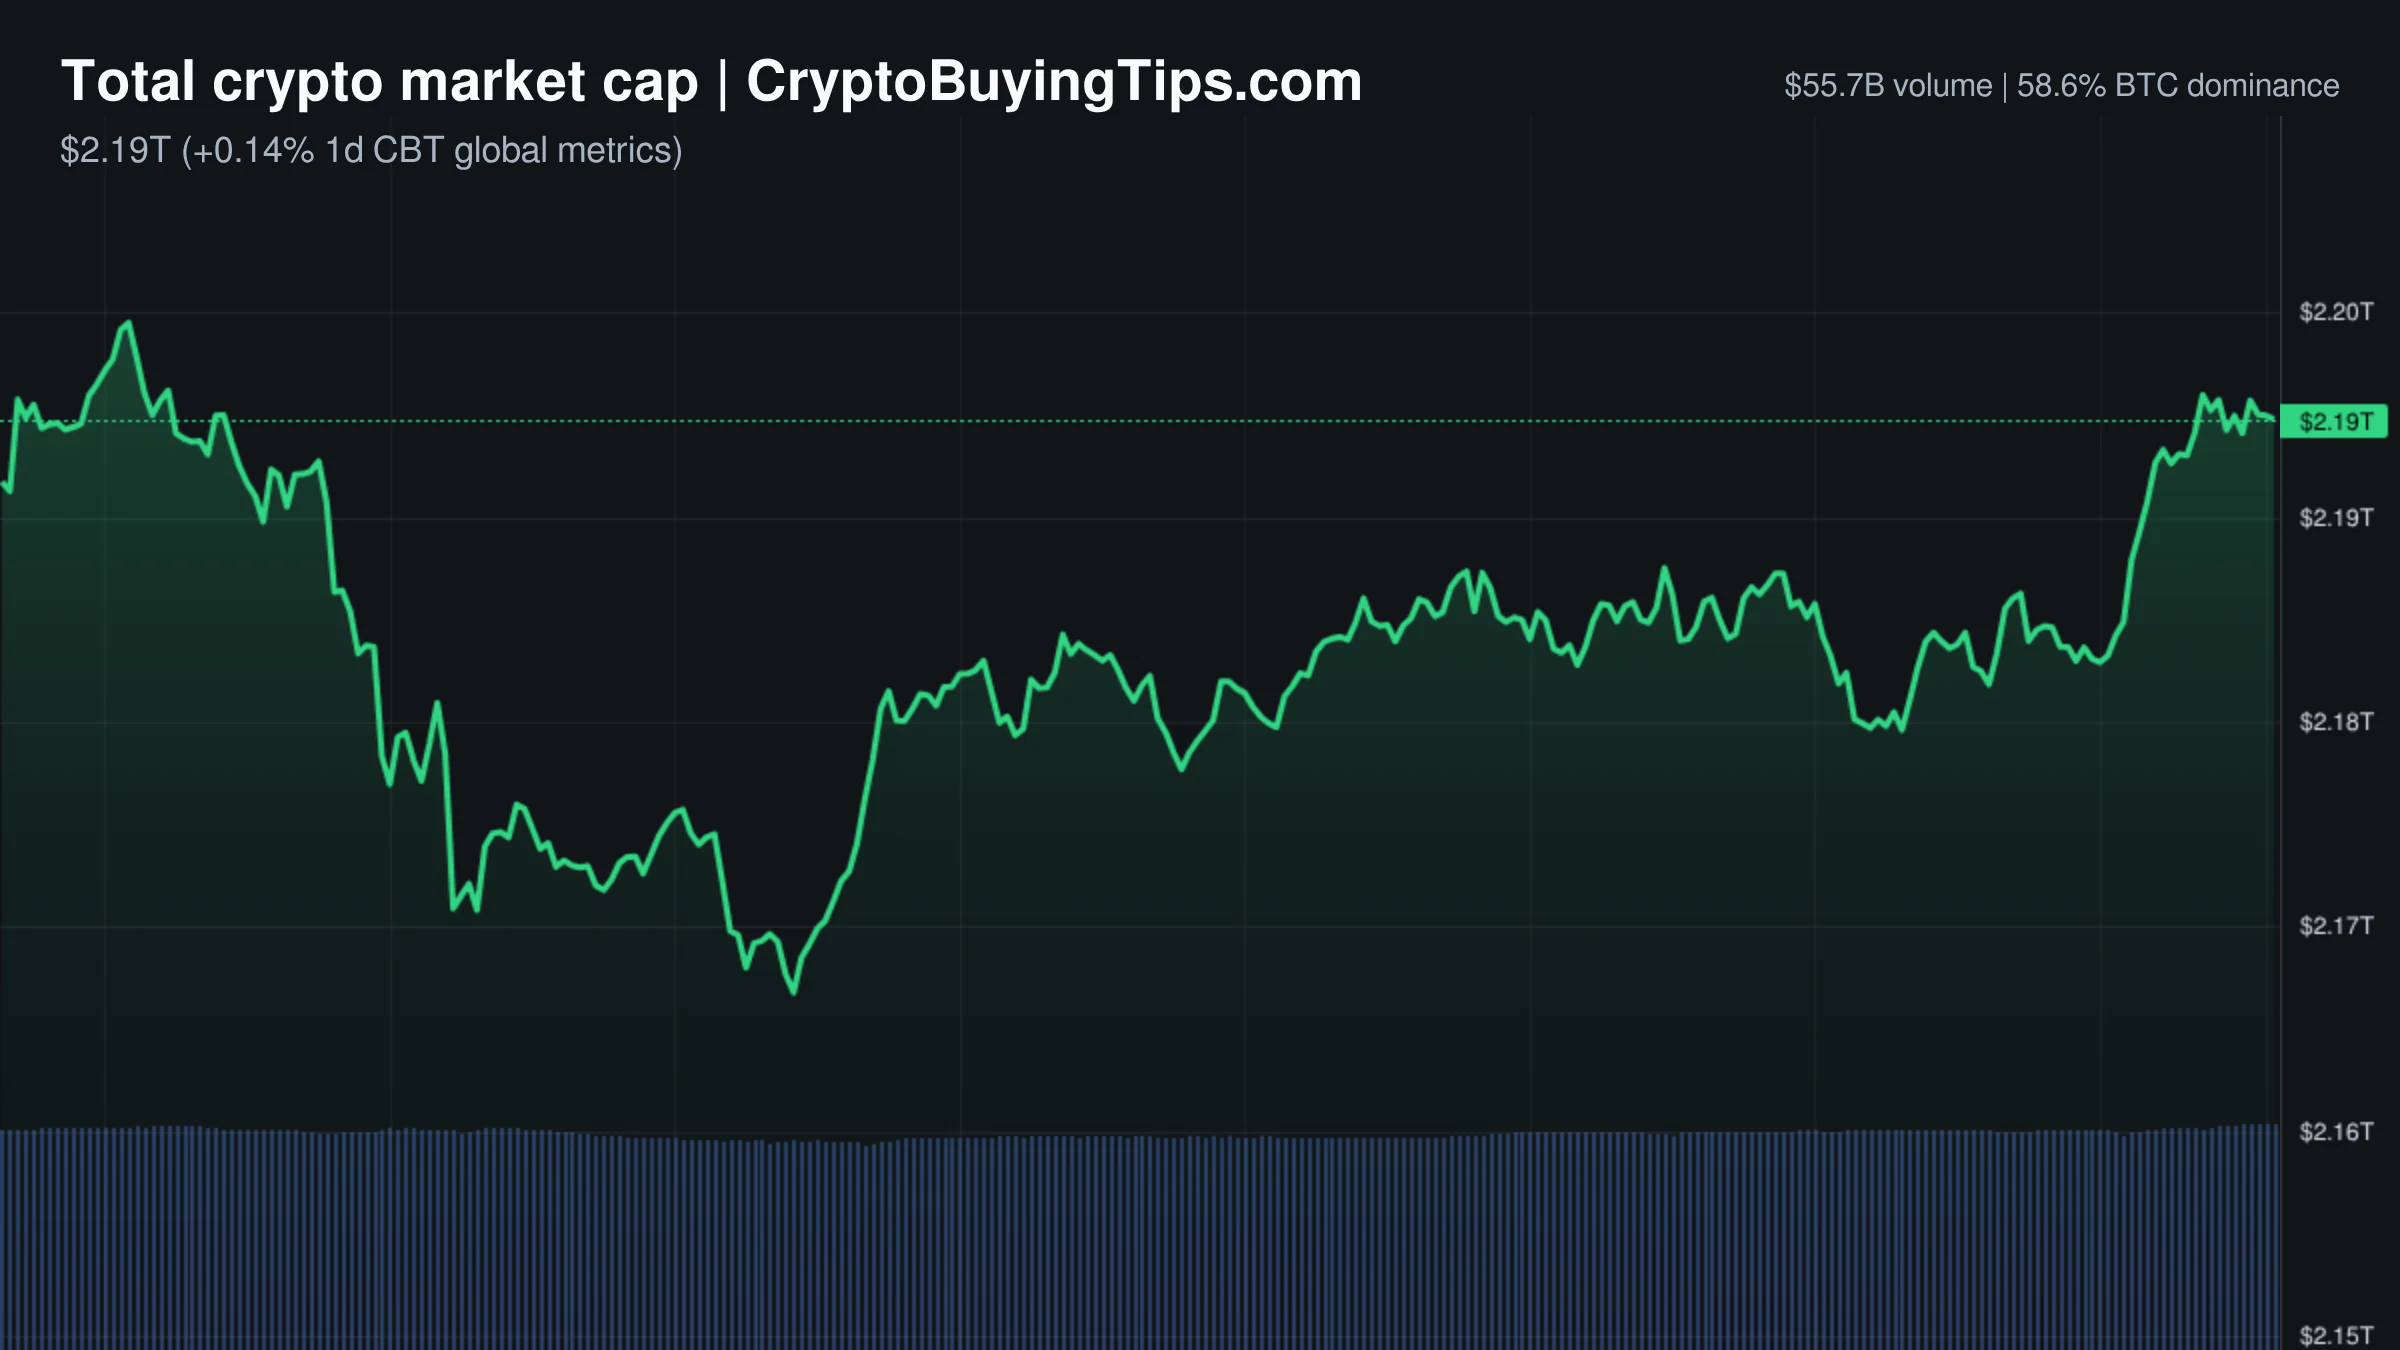
The total market cap sits at $2.56T, reflecting a marginal increase of 0.17%. While the price action appears stagnant, a massive surge in activity is happening under the surface. Trading volume jumped nearly 23% to $91.68B, and stablecoin volume rose by over 28%. This level of activity usually indicates a major shift in positioning or a heavy hedging cycle.

There is a stark disconnect between price and sentiment. The Fear and Greed Index is at 39, placing the market firmly in Fear, yet the CMC20 and CMC100 indices are both slightly positive. This divergence suggests that traders are anxious despite the lack of a price crash. The surge in stablecoin volume often means capital is sitting on the sidelines, waiting for a clear signal to enter or exit.

Liquidity is concentrated in derivatives, where volume reached $791.46B. With open interest in perpetuals at $559.57B, the market is heavily leveraged. High open interest combined with a Fear rating often precedes a volatility spike, as a small move in either direction can trigger a cascade of liquidations.

Bitcoin and Ethereum

Bitcoin daily market structure chart for the crypto market overview

Bitcoin is trading at $76,913.92, maintaining a dominance of 60.20%. The asset is in a neutral to bullish phase, recovering from February lows in a V-shaped pattern. Recent data shows that the rally toward $80K triggered the fastest growth in BTC perpetual futures open interest seen so far in 2026. Most of this new derivatives capital flowed into Binance. Implied volatility for the asset is currently 41.74%.

Ethereum remains flat at $2,114.75 with a dominance of 9.97%. The network is seeing extremely low activity, with gas fees at a negligible 0.14 Gwei. This suggests a lack of on-chain demand or a lull in DeFi interactions. Implied volatility for ETH is higher than Bitcoin at 55.52%, which indicates that traders expect more erratic price swings for the second largest asset in the short term.

Top crypto prices

Bitcoin holds the top spot at $76,913.92, up 0.17%. Ethereum is unchanged at $2,114.75. BNB is slightly up at $639.09, while XRP has dipped 0.54% to $1.37. Solana is trading at $84.53, gaining 0.21%. TRON is down 0.31% at $0.3549. Hyperliquid is a notable outlier among the top ten, climbing 5.96% to $48.01.

News driving today's market

Regulatory developments are providing a mix of institutional optimism and immediate friction. The SEC has approved several entities, including the NYSE and Nasdaq, to proceed with tokenized stock initiatives. This is a major step for the industry. We previously covered tokenized stocks explained, and the current move by the SEC suggests that the transition of traditional equities to the blockchain is moving from theory to execution.

In Europe, Zerohash secured the first EMI license under MiCA for stablecoin and brokerage services. This provides a clear legal path for stablecoin adoption in the EU. Similarly, the UK financial watchdog and central bank released a roadmap for tokenization and institutional settlement. These moves contrast with the situation in the US, where the White House crypto deadline continues to loom as a source of uncertainty.

Security failures are weighing on sentiment. Echo Protocol suffered a $77M exploit due to an admin key compromise, and Aave recently restored borrowing limits after a separate $230M exploit. These events remind the market that DeFi security remains a primary risk. On the corporate side, Bitcoin Depot filed for Chapter 11 bankruptcy, with its stock crashing 71% premarket. This highlights the fragility of crypto-adjacent businesses facing regulatory pressure.

Social intelligence

On-chain data from CryptoQuant shows that capital is flooding back into exchanges. The surge in BTC perpetual futures open interest suggests a high-conviction bet on the $80K level, but the heavy concentration on Binance makes the market vulnerable to a localized liquidity squeeze.

Echo Protocol has since regained control of its admin key and burned the remaining 955 eBTC held by the attacker. The team reports that the compromise was limited primarily to Monad, though some exposure on Aptos occurred. This quick response may prevent a total collapse of confidence in the protocol, but the initial exploit remains a bearish signal for cross-chain bridge security.

BNB Chain is also in the spotlight following a report on the BSC post-quantum cryptography migration. This technical upgrade is necessary for long-term security, though it typically doesn't drive immediate price action.

Altcoin Spotlight

Hyperliquid is the standout performer among the top assets, gaining nearly 6% today. While most of the market is sideways or fearful, HYPE is seeing strong buying pressure. This move comes as the broader market shifts toward high-performance derivatives platforms, and Hyperliquid is capturing a significant portion of the trader interest that is rotating out of stagnant legacy alts.

What to watch next

The market is currently a powder keg of high leverage and low sentiment. The most immediate catalyst is the release of the Fed minutes and the Senate deadline for Meta's stablecoin proposal. If the Fed signals continued rate hikes, the current "Fear" sentiment will likely intensify, potentially triggering a liquidation event for the massive amount of long open interest currently sitting at $80K.

Traders should monitor the Altcoin Season Index, which is currently at 33. We are firmly in a Bitcoin season. Until this index climbs toward 75, most capital will likely stay in BTC or move into a few high-momentum assets like HYPE. The key level to watch is the $80,000 mark for Bitcoin; a clean break above this with sustained volume could flip the Fear index to Greed and spark a wider altcoin rally.

Crypto Market Overview | Leveraged Volatility Risk | May 18, 2026
Sigrid Voss·

Crypto Market Overview | Leveraged Volatility Risk | May 18, 2026

Market overview

The crypto market is currently in a short term bearish correction, with the total market cap sitting at $2.63T, down 1.81% over the last 24 hours. While the price action is negative, the underlying activity suggests a market driven by aggressive hedging and leverage rather than a simple sell off. Trading volume has surged to $101.0B on spot markets, but the real story is in the derivatives sector. Derivatives volume has exploded to $906.11B, nearly ten times the spot volume, which indicates that traders are heavily positioned in perpetuals and futures to speculate on the current volatility.

Sentiment has shifted toward fear, with the Fear and Greed Index landing at 38. This risk aversion is mirrored in traditional markets, as the S&P 500 and NASDAQ both closed in the red. The dominance of Bitcoin remains high at 58.23%, while Ethereum holds 9.64%. Stablecoin dominance is currently 10.12%, suggesting a decent amount of capital is sitting on the sidelines waiting for a clearer entry point. With the Altcoin Season Index at 32, the market remains firmly in a Bitcoin season, as most altcoins are failing to outperform the primary asset during this dip.

Bitcoin and Ethereum

Bitcoin is trading at $76,592.6, reflecting a 1.70% decline. The price action is struggling against a heavy supply overhang. On chain data shows that over 7.8 million BTC are currently held at a loss, creating a psychological weight that the market must absorb before any sustained move higher is structurally credible. This pressure is compounded by a broader risk off mood tied to geopolitical tensions in the Middle East.

Ethereum has seen a sharper decline, dropping 3.38% to $2,104.77. Beyond the price drop, the network state is unusually quiet. Gas fees are extremely low, ranging between 0.2 and 0.26 Gwei, which suggests a significant drop in on chain activity and congestion. This lack of network utility during a price correction often points to a lack of immediate buying pressure from DeFi users.

Top crypto prices

Bitcoin leads the market at $76,592.6, down 1.70%. Ethereum follows at $2,104.77, down 3.38%. BNB is priced at $639.98, a 1.63% decrease. XRP sits at $1.38, down 2.14%. Solana is trading at $84.39, down 2.05%. TRON remains relatively stable at $0.3552, down 0.46%. Hyperliquid is a notable outlier, gaining 3.78% to reach $45.18.

News driving today's market

Geopolitical instability is the primary driver of current market stress. Reports suggest that Iran may be utilizing Bitcoin as an insurance market for shipping through the Strait of Hormuz. While this proves the utility of the asset in extreme scenarios, the accompanying risk off sentiment has led to massive outflows. CoinShares reported $1.07 billion in weekly outflows from crypto investment products, with Bitcoin losing $982 million and Ethereum losing $249 million. We previously covered Tokenized Stocks Explained for more background.

Security failures in the DeFi space are also weighing on sentiment. The Verus Ethereum bridge was drained of $11.6 million, including 1,625 ETH and 103.6 tBTC. This is part of a growing string of cross chain infrastructure exploits that damage confidence in bridge security.

On the regulatory front, there is a mix of progress and peril. Grayscale and VanEck have amended their US spot BNB ETF filings, which could provide a significant catalyst for BNB if approved. Additionally, Galaxy Digital secured a New York BitLicense, signaling a continued institutional push into the space. However, the Senate crypto market structure bill is reportedly at risk of failing if it does not clear a floor vote by August. We previously covered the White House Crypto Deadline, and this potential Senate failure adds to the uncertainty surrounding US legislation.

Social intelligence

The prevailing narrative on social media is one of caution and macro awareness. Bank of Japan Governor Haruhiko Katayama has urged close monitoring of financial markets, which traders are interpreting as a signal for increased volatility. This coincides with reports of Iranian plans to rebuild the South Pars gas field, an event that impacts global energy markets and risk sentiment.

On chain analysts are focusing on the "underwater" nature of Bitcoin holdings. The fact that 7.8 million BTC are held at a loss creates a ceiling of resistance, as investors often sell when they finally break even. This data suggests that the current price level is a battleground between long term holders and those looking to exit their positions.

Altcoin Spotlight

Hyperliquid is currently defying the broader market trend, posting a 3.78% gain. This momentum is tied to the launch of the first pre IPO perpetual market for SpaceX on the platform. By offering synthetic exposure to SpaceX at a reference valuation of $1.78 trillion, Hyperliquid is attracting traders looking for novel assets that are not yet available on traditional exchanges. This move differentiates the protocol from standard perpetual platforms and is driving demand for the HYPE token.

Trading ideas worth watching

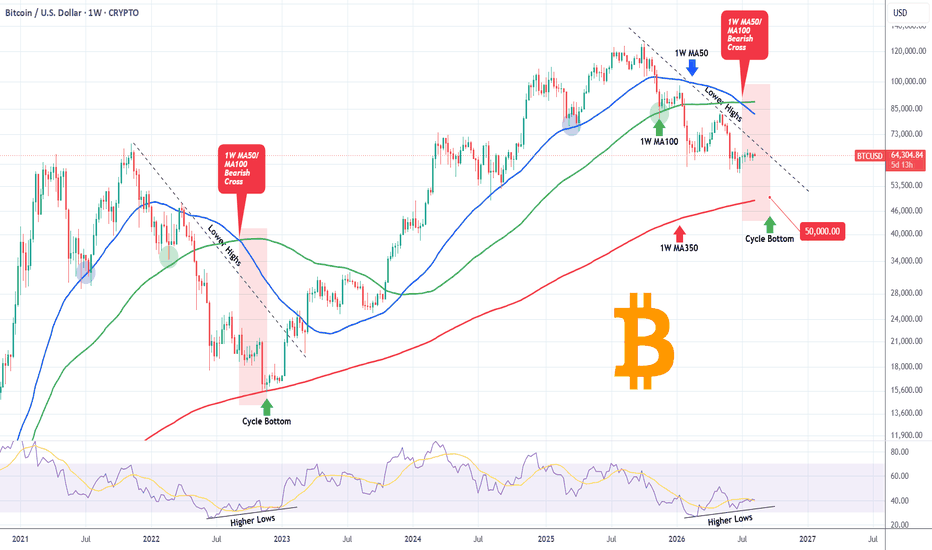
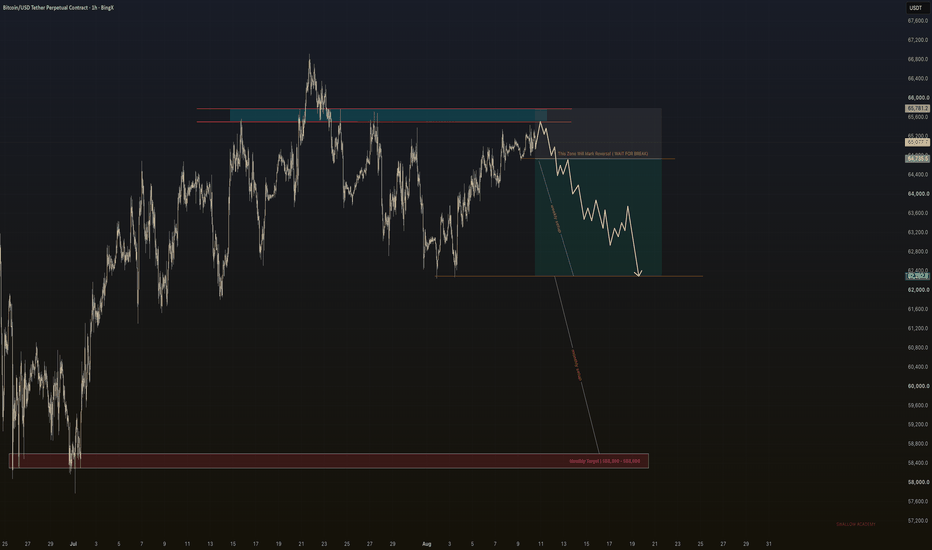
One bearish setup for Bitcoin focuses on the 1D MA200 rejection. The asset recently closed the week with a strong rejection on this moving average, which historically acts as major resistance during bear cycles. Analysts point to a fractal from the 2018 bear cycle, where a similar rejection occurred roughly 220 days after the cycle top. If this pattern repeats, the market could see weeks of sideways movement followed by a drop toward the 1.5 Fibonacci extension, with a target around $41,250.

Redrawn ETHUSDT 1D trading idea chart for Ethereum & the Crash Toward $1,000Trading idea chart: BTCUSD - BITCOIN The scary timing of this 1D MA200 rejection

Conversely, some traders view the current Ethereum consolidation as a fake out. This bullish perspective dismisses crash scenarios toward $1,000 as mere fear and argues that the market is actually preparing for a massive wave. From this view, the next easy target for Ethereum is above $3,000, suggesting that any dip is a buying opportunity.

A more neutral take on Bitcoin suggests a correction phase has been activated. While the long term trend remains bullish within a large rising channel, the short term momentum has broken below a recent low. This indicates that a deeper pullback toward the lower bound of the blue channel is likely before the next leg up.

What to watch next

The immediate focus for traders is the tension between institutional adoption and geopolitical instability. While the prospect of a BNB ETF and new BitLicenses for firms like Galaxy are positive, they are currently being drowned out by the risk off sentiment surrounding Iran.

Watch for any movement in the Fear and Greed Index; if it dips further into the 30s, we may see a more aggressive liquidation event given the massive $503.44B in open interest for perpetuals. The market is heavily leveraged, and a sudden move in either direction could trigger a cascade of liquidations. Finally, the August deadline for the Senate crypto bill remains a critical date that will determine if the US provides a clear regulatory framework or continues to leave the industry in a state of uncertainty.

Crypto Market Overview | Volume collapse signals | May 17, 2026
Sigrid Voss·

Crypto Market Overview | Volume collapse signals | May 17, 2026

Market overview

The crypto market is in a strange state of contradiction. While the total market cap sits at $2.70T with a slight 24h increase of 0.75%, the underlying activity is disappearing. Trading volume has plummeted across the board. Spot volume is down over 41%, and derivatives volume has crashed by 46.10%. This divergence is a red flag. Usually, when prices drift higher on such low volume, it suggests a lack of conviction from buyers rather than a strong bullish move.

Sentiment is currently neutral, with the Fear and Greed Index at 42. This matches the broader macro environment where the S&P 500 and NASDAQ are both sliding, dropping 1.20% and 1.51% respectively. The market is effectively in a waiting room. Capital is staying concentrated in Bitcoin, which maintains a dominance of 58.27% to 60.17% depending on the data source. With the Altcoin Season Index at 28 to 35, we are firmly in a Bitcoin Season. Money is not rotating into alts yet.

Bitcoin and Ethereum

Bitcoin is trading at $78,420.2, struggling to hold the $79,000 level. The price action is caught between institutional confidence and macro fear. On one side, the Abu Dhabi sovereign wealth fund Mubadala is aggressively adding to its iShares Bitcoin Trust positions, adding over $90 million recently. On the other side, geopolitical uncertainty and Iran-related war fears are dragging the price down.

Ethereum is priced at $2,192.84. The network is ghost-town quiet, with gas fees sitting at an incredibly low 0.22 to 0.24 Gwei. This lack of on-chain congestion reflects the broader volume collapse. ETH is also facing institutional headwinds. SEC filings reveal that the Harvard endowment has completely exited its $86.8 million position in BlackRock's spot Ethereum ETF. This exit, combined with a 43% cut to its Bitcoin holdings, suggests some prestige institutions are taking chips off the table.

Top crypto prices

Bitcoin leads the market at $78,420.2, up 0.65%. Ethereum follows at $2,192.84, seeing a 0.94% gain. BNB is relatively flat at $654.43. XRP has outperformed the majors with a 1.50% rise to $1.42, while Solana is up 1.22% at $86.9. TRON sits at $0.3552, up 0.97%. Hyperliquid is the standout gainer among the top ten, jumping 5.83% to $43.28.

News driving today's market

Regulatory developments in the US are the primary driver of current sentiment. The advancement of the CLARITY Act in the Senate is providing a tailwind for XRP, as traders bet on legal clarity pulling in institutional money. A16z has described the act as a boon for domestic innovation. This follows a period of intense regulatory pressure, and we previously covered the White House Crypto Deadline which has kept the market on edge.

Institutional appetite for altcoin ETFs is also picking up. VanEck and Grayscale have filed amendments for BNB ETFs, and Canary Capital is pushing for a staked TRX ETF. These filings suggest that the "ETF-ization" of the market is moving beyond just the two largest assets. We previously covered Tokenized Stocks Explained for more background.

However, the DeFi sector is struggling with a crisis of complexity. The $293 million KelpDAO hack is a stark reminder that yield-seeking behavior often overrides security. Many users are choosing high returns over protection, leaving billions at risk. This systemic fragility makes the current low-volume environment feel more precarious.

Social intelligence

On-chain data shows a clear divergence in whale sentiment. @lookonchain reported a whale (0x50b3) executing a massive hedge or directional bet by opening a 25x short on $50.55M of ETH while simultaneously going 20x long on $25.27M of BTC. This is a classic "pair trade" that bets on Bitcoin outperforming Ethereum.

Political influence is also surfacing in the data. A Washington Post report indicates that over one-fifth of Trump administration officials hold crypto assets, with disclosed holdings totaling at least $193 million. This level of insider adoption generally suggests a more favorable regulatory environment in the long term, though the immediate impact is often just more noise in the short term.

Altcoin Spotlight

Hyperliquid deserves attention today. While most of the market is flat or sliding on low volume, HYPE surged 5.83% to $43.28. In a regime where Bitcoin dominance is crushing most altcoins, a move of this magnitude indicates strong localized demand or a specific catalyst that is decoupling it from the broader altcoin slump.

Trading ideas worth watching

For Cosmos, there is a bullish setup forming on the daily chart. An inverse head and shoulders pattern has developed, which usually signals a trend reversal. The price is consolidating near the neckline and the 100 SMA at 1.894. A daily close above the 2.050 to 2.100 region would confirm the breakout, with a primary target around 2.400.

Trading idea chart: BTCUSDT - BTC Triple Top Signals Possible Drop Toward 73KRedrawn ATOMUSDT 1D trading idea chart for ATOM/USDT: Inverse Head and Shoulders Ready to Trigger

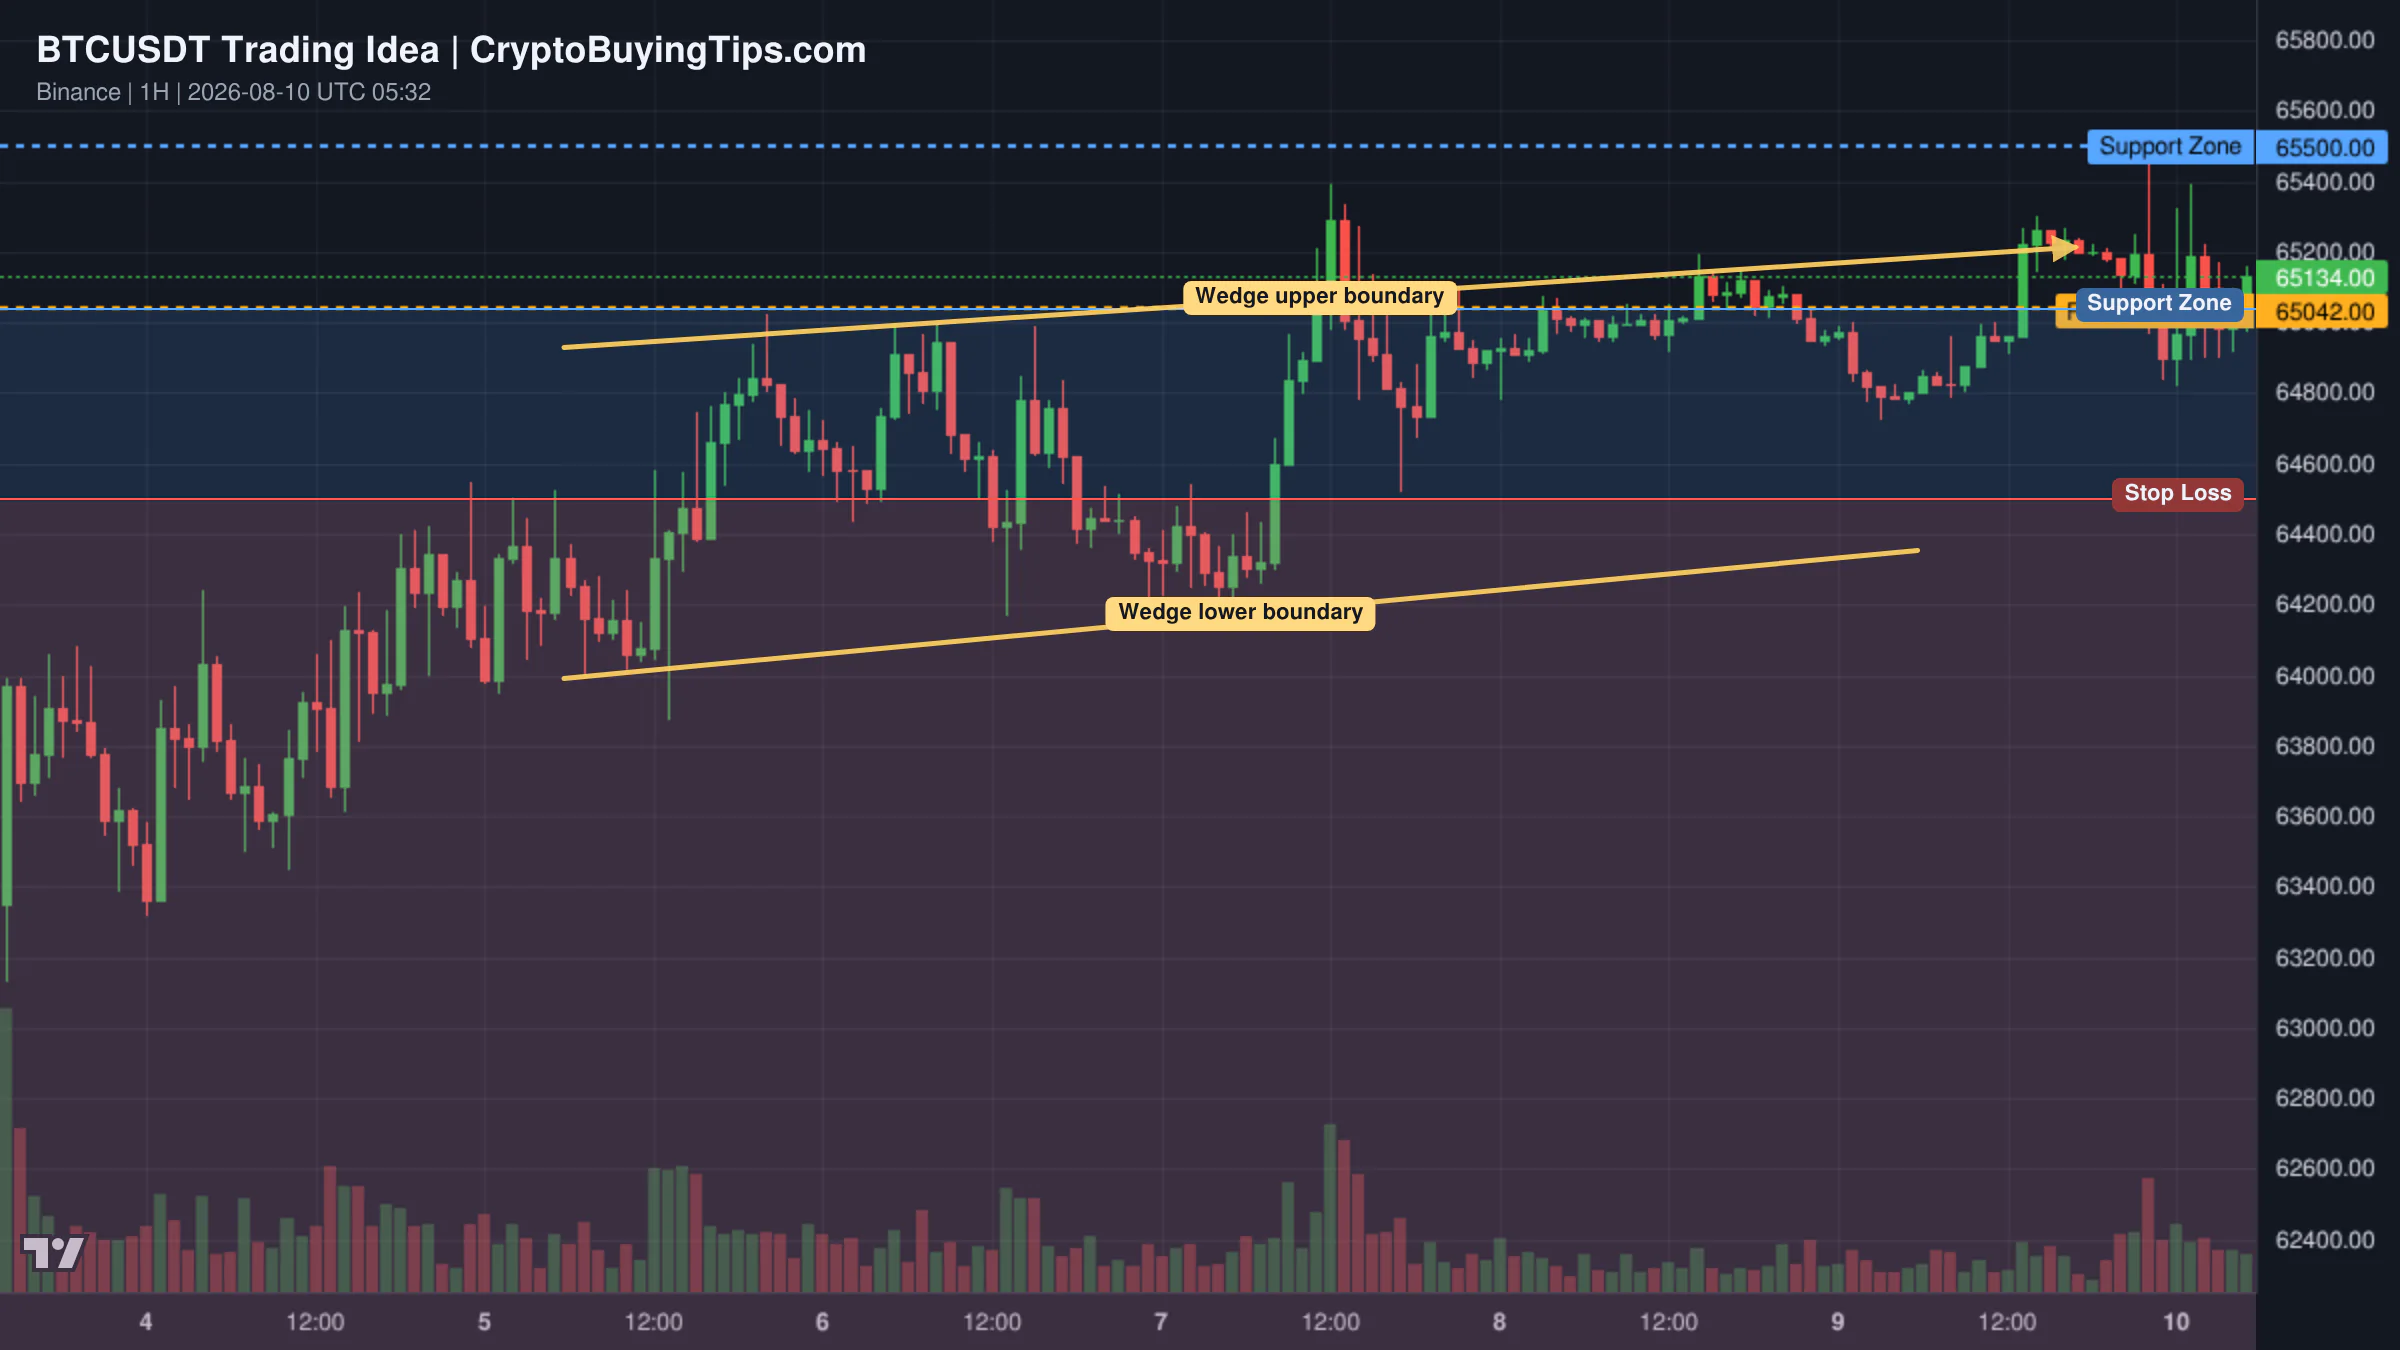
Bitcoin presents two conflicting narratives. One bearish view points to a triple top pattern on the 240-minute chart, suggesting a potential drop toward 75,650 or even 73,000 after breaking the neckline. Conversely, a more bullish daily perspective argues that the current dip is just a normal retrace after 40 days of growth. This view suggests that as long as BTC stays above $70,000, the macro trend remains hyper-bullish, with a major invalidation level only appearing below $68,000.

What to watch next

The immediate focus is the volume gap. Prices are holding, but the 40% crash in trading activity is an anomaly that usually precedes a volatile move. If volume returns on the downside, the Bitcoin triple top could trigger a slide toward 73k. If volume returns on the upside, the path to $80,000 is clear.

Keep an eye on the US Treasury and CFTC. With the CLARITY Act moving forward, the appointment of new CFTC commissioners will be a major signal for whether the US is actually moving toward a supportive framework or just playing political games. Finally, the Ethereum gas fees are too low. For ETH to regain dominance, we need to see on-chain activity return, not just ETF trading.