Market Overviews

Daily crypto market overviews, trend analysis, and key updates from our editorial team.

Crypto Market Overview | volume collapse masks institutional accumulation despite flat prices | August 9, 2026
Sigrid Voss·

Crypto Market Overview | volume collapse masks institutional accumulation despite flat prices | August 9, 2026

Market overview

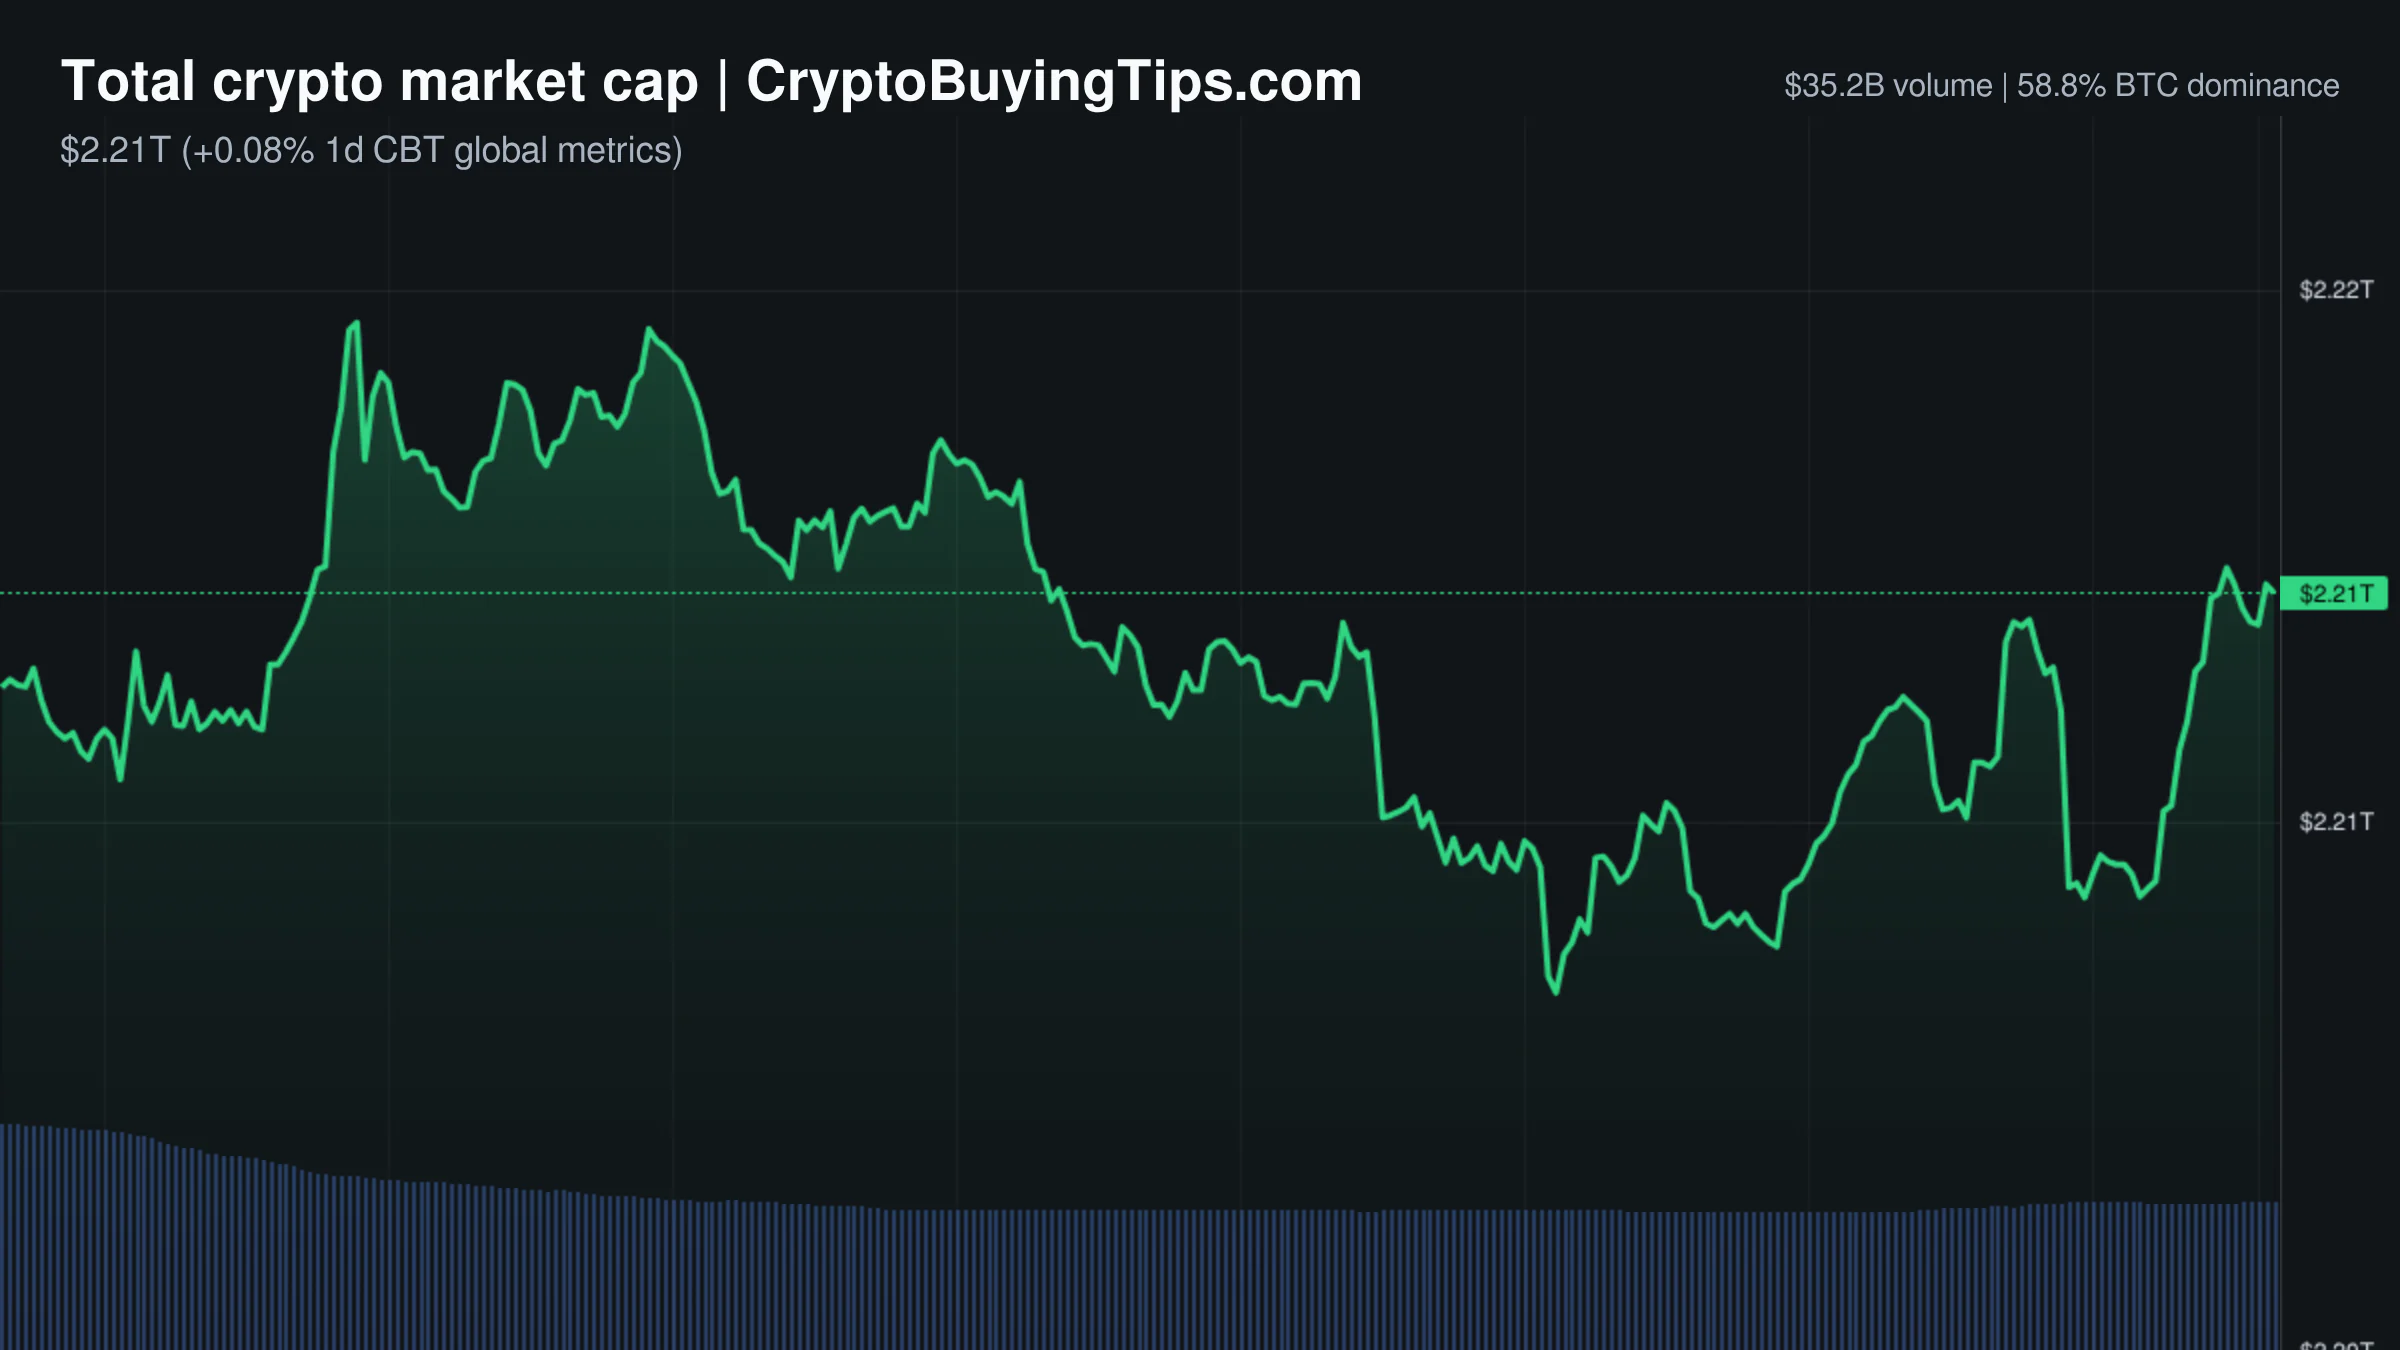
The market is currently in a state of profound contradiction. On the surface, the total market cap is holding steady at $2.21T, showing a negligible increase of 0.09%. However, the plumbing beneath the price action suggests a sudden and sharp loss of interest. Trading activity has fallen off a cliff. 24h volume is down nearly 28% to $35.10B, but the real story is in the derivatives market. Derivatives volume has crashed by 45.19%, falling to $267.97B. When the leverage disappears this quickly, it usually means traders are either terrified or simply bored.

Sentiment remains stubbornly neutral with the Fear and Greed Index sitting at 40. This neutrality is mirrored in the Altcoin Season Index, which reads 37. We are firmly in a Bitcoin season, though not a particularly exciting one. The relationship between price and volume here is telling. Prices are flat, but the volume collapse is aggressive. This suggests that the current price levels are not being defended by active trading, but rather by a lack of conviction to sell.

Stablecoin dominance is hovering around 11.10%, and the overall trend is flat to slightly bullish in terms of capitalization. Yet, the activity split shows that DeFi volume is also down 24.48%. The market is effectively holding its breath. The S&P 500 and NASDAQ are both ticking upward, which should theoretically provide a risk-on tailwind for crypto, but that correlation is currently muted.

Bitcoin and Ethereum

Bitcoin is trading at $64,921.56, essentially unchanged over the last 24 hours. The asset is dominating the market at 58.83%, a position that feels secure given the lack of momentum elsewhere. There is a strange divergence between institutional flows and price action. Spot Bitcoin ETFs just posted their best week since April, drawing $1B in inflows. Usually, that amount of institutional buying triggers a rally. Instead, Bitcoin is drifting. It seems the "smart money" is accumulating in silence, while the rest of the market waits for a reason to care.

Ethereum is in a more precarious position, priced at $1,919.34. Its dominance has slipped to 10.46%. The most alarming metric for Ethereum is not the price, but the network activity. Gas fees are currently between 0.07 and 0.08 Gwei. This is an incredibly low level of congestion, which in the crypto world is often a euphemism for a ghost town. While Bitcoin is benefiting from ETF inflows, Ethereum is struggling to find a narrative that translates into actual on-chain usage.

The volatility gap between the two is also widening. Ethereum's implied volatility is 50.28%, significantly higher than Bitcoin's 36.16%. This suggests that traders expect a much more violent move from Ethereum, though the data doesn't yet indicate which direction that move will take.

Top crypto prices

Outside of the two giants, there are a few pockets of green. BNB has climbed 1.59% to $603.96, and Solana is up 1.82% at $76.36. These moves are modest, but they stand out in a market where almost everything else is stagnant. XRP is slightly down at $1.03, and TRON is marginally up at $0.3292.

Hyperliquid is trading at $54.55, down 0.40%. Given the massive drop in overall derivatives volume, it is a bit ironic to see the primary perpetuals platform itself slipping in price. The CMC20 and CMC100 indices are both essentially flat, confirming that the current price stability is a result of total inertia rather than a coordinated bull run.

News driving today's market

The most significant catalyst on the horizon is the US Senate's move toward the CLARITY Act. Majority Leader John Thune has filed cloture, setting up a procedural vote for September 15. This bill is a high-impact event because it seeks to establish a federal market structure and delineate the boundaries between the SEC and CFTC. If the Senate manages to clear the 60-vote threshold, it provides the kind of regulatory certainty that institutional desks require before deploying serious capital. We previously covered dominance data agrees for more background.

In a move that perfectly captures the absurdity of the current market, T. Rowe Price has included memecoins in its actively managed crypto ETF. The $1.9 trillion asset manager argues that memecoins are a "real-world stress test" for blockchain scalability. It is a bold pivot. We previously covered how this shift toward active crypto management suggests that institutions are no longer satisfied with just tracking Bitcoin. They are now willing to bet on the more speculative corners of the market.

On the bearish side, Brazil's central bank is tightening the screws. New rules will require exchanges to delay large crypto transfers abroad, specifically those over $10,000. This introduces friction into cross-border liquidity and signals a broader trend of central banks attempting to ring-fence their domestic capital.

Meanwhile, Bitwise's Matt Hougan is making headlines by predicting that trillions of dollars will flow into Bitcoin. His logic is that a mere 1% shift from global capital pools into Bitcoin would unlock massive growth. It is an optimistic take, but it aligns with the $1.1B in recent ETF inflows.

Social intelligence

On-chain and social data highlight a growing trend of using Bitcoin as a corporate treasury tool for traditional infrastructure. MARA has pledged 18,750 BTC, worth roughly $1.2 billion, to secure $600 million in loans. The funds are earmarked for energy and AI infrastructure. This is a significant development. It shows that Bitcoin is moving beyond a "store of value" and is now being used as high-quality collateral to fund the physical build-out of the AI era.

The social mood is tempered by a few grim reminders of the risks of self-custody. Reports of a plot to kidnap a Bitcoin holder's parents in Missouri serve as a stark reminder that as the value of these assets grows, so does the incentive for physical-world crime.

From a macro perspective, there are signs of a cooling tech appetite. Data from KPMG suggests that 49% of executives have scaled back their AI agents because the costs are outweighing the benefits. If the AI hype cycle hits a wall, it could bleed into the crypto market, particularly for projects that have spent the last year rebranding themselves as "AI-powered."

Trading ideas worth watching

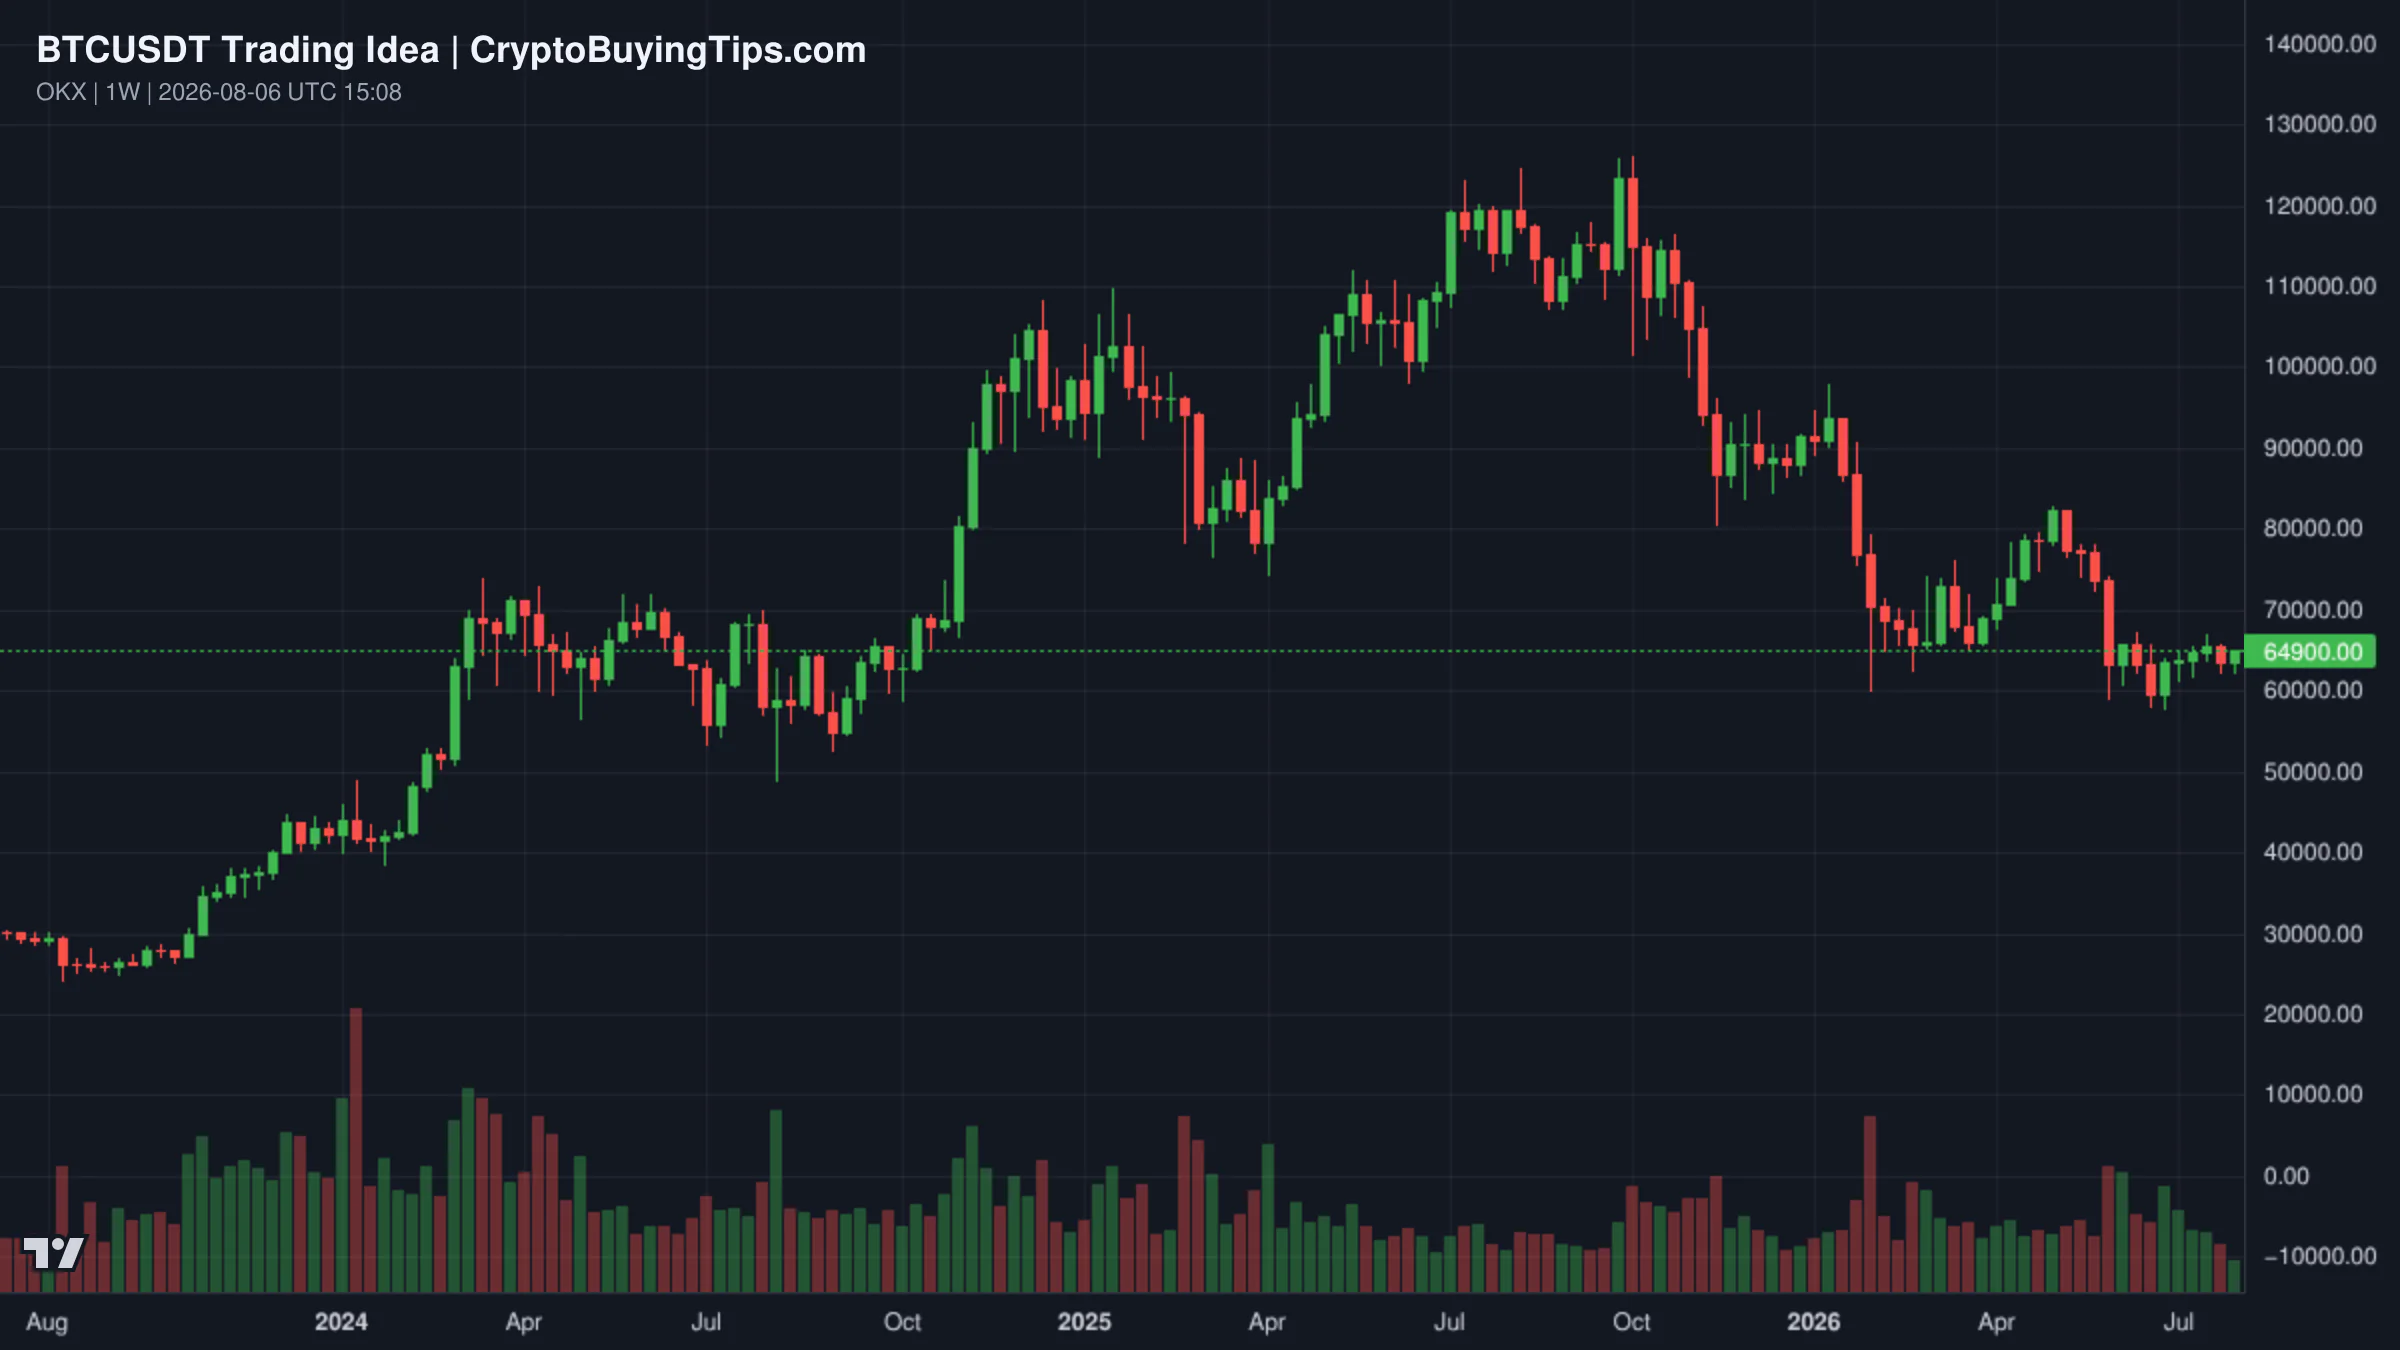
The most compelling setup right now is on the Bitcoin daily chart. Price is approaching a critical resistance zone at $67,000. This level is not just a psychological barrier; it aligns with the neckline of a forming inverse Head and Shoulders pattern. This is a classic bullish reversal setup.
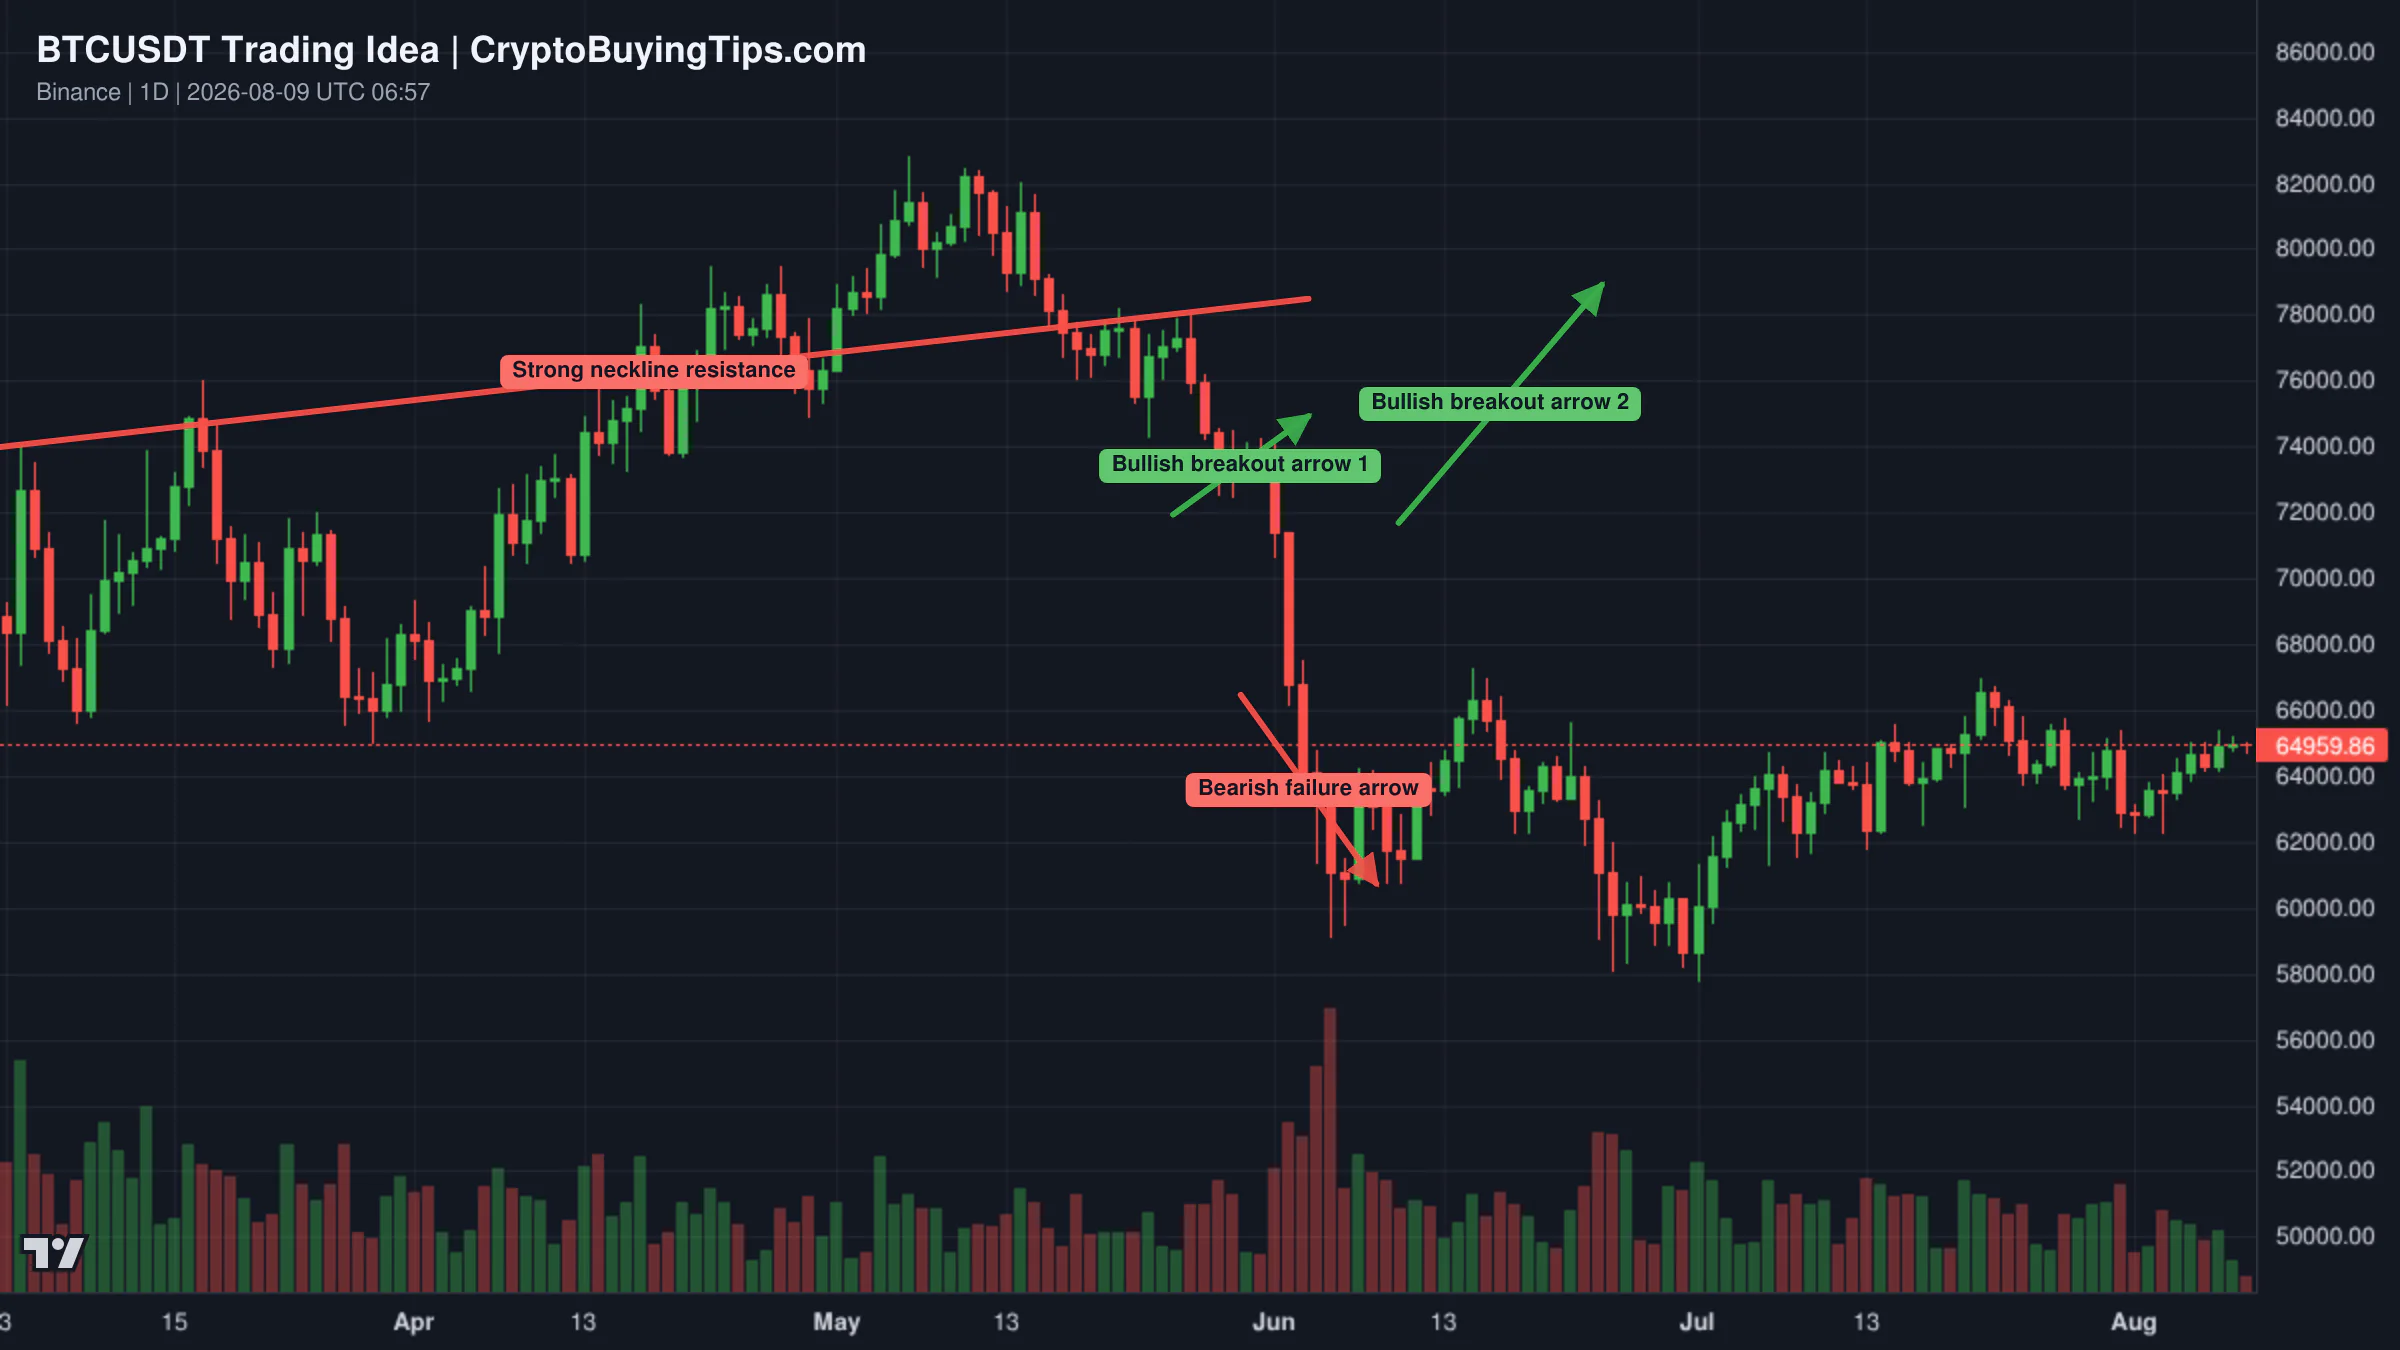
Redrawn BTCUSDT 1D trading idea chart for Bitcoin this week will pump above 67K or strong dump will cook

If Bitcoin manages to break and close above $67,000 with strong volume, the pattern completes. The measured move from the head to the neckline would project a rally toward $80,000. However, the risk is high. If the $67,000 resistance holds, we could see a strong rejection that sends the market back into a boring range or triggers a dump. The key is the volume. Given that derivatives volume has collapsed by 45%, any breakout without a massive surge in activity will likely be a fake-out.

What to watch next

The market is currently a coil. We have strong institutional inflows and a potential legislative breakthrough in the US, yet the retail side of the market has effectively gone on vacation. The collapse in trading volume is the most important metric to track. If volume remains this low, the $67,000 resistance on Bitcoin will likely hold, as there isn't enough aggressive buying power to force a breakout.

The date to circle is September 15. The Senate vote on the CLARITY Act will be the primary driver of volatility for the next few weeks. Until then, we are likely to see more of this stagnant price action. The gap between the "trillions" promised by institutional managers and the 0.07 Gwei gas fees on Ethereum is where the current tension lies. We are waiting to see if the institutional bid is enough to wake up the rest of the market.
Crypto Market Overview | Volume fades as regulatory pressure meets bullish options bets | August 8, 2026
Sigrid Voss·

Crypto Market Overview | Volume fades as regulatory pressure meets bullish options bets | August 8, 2026

Market overview

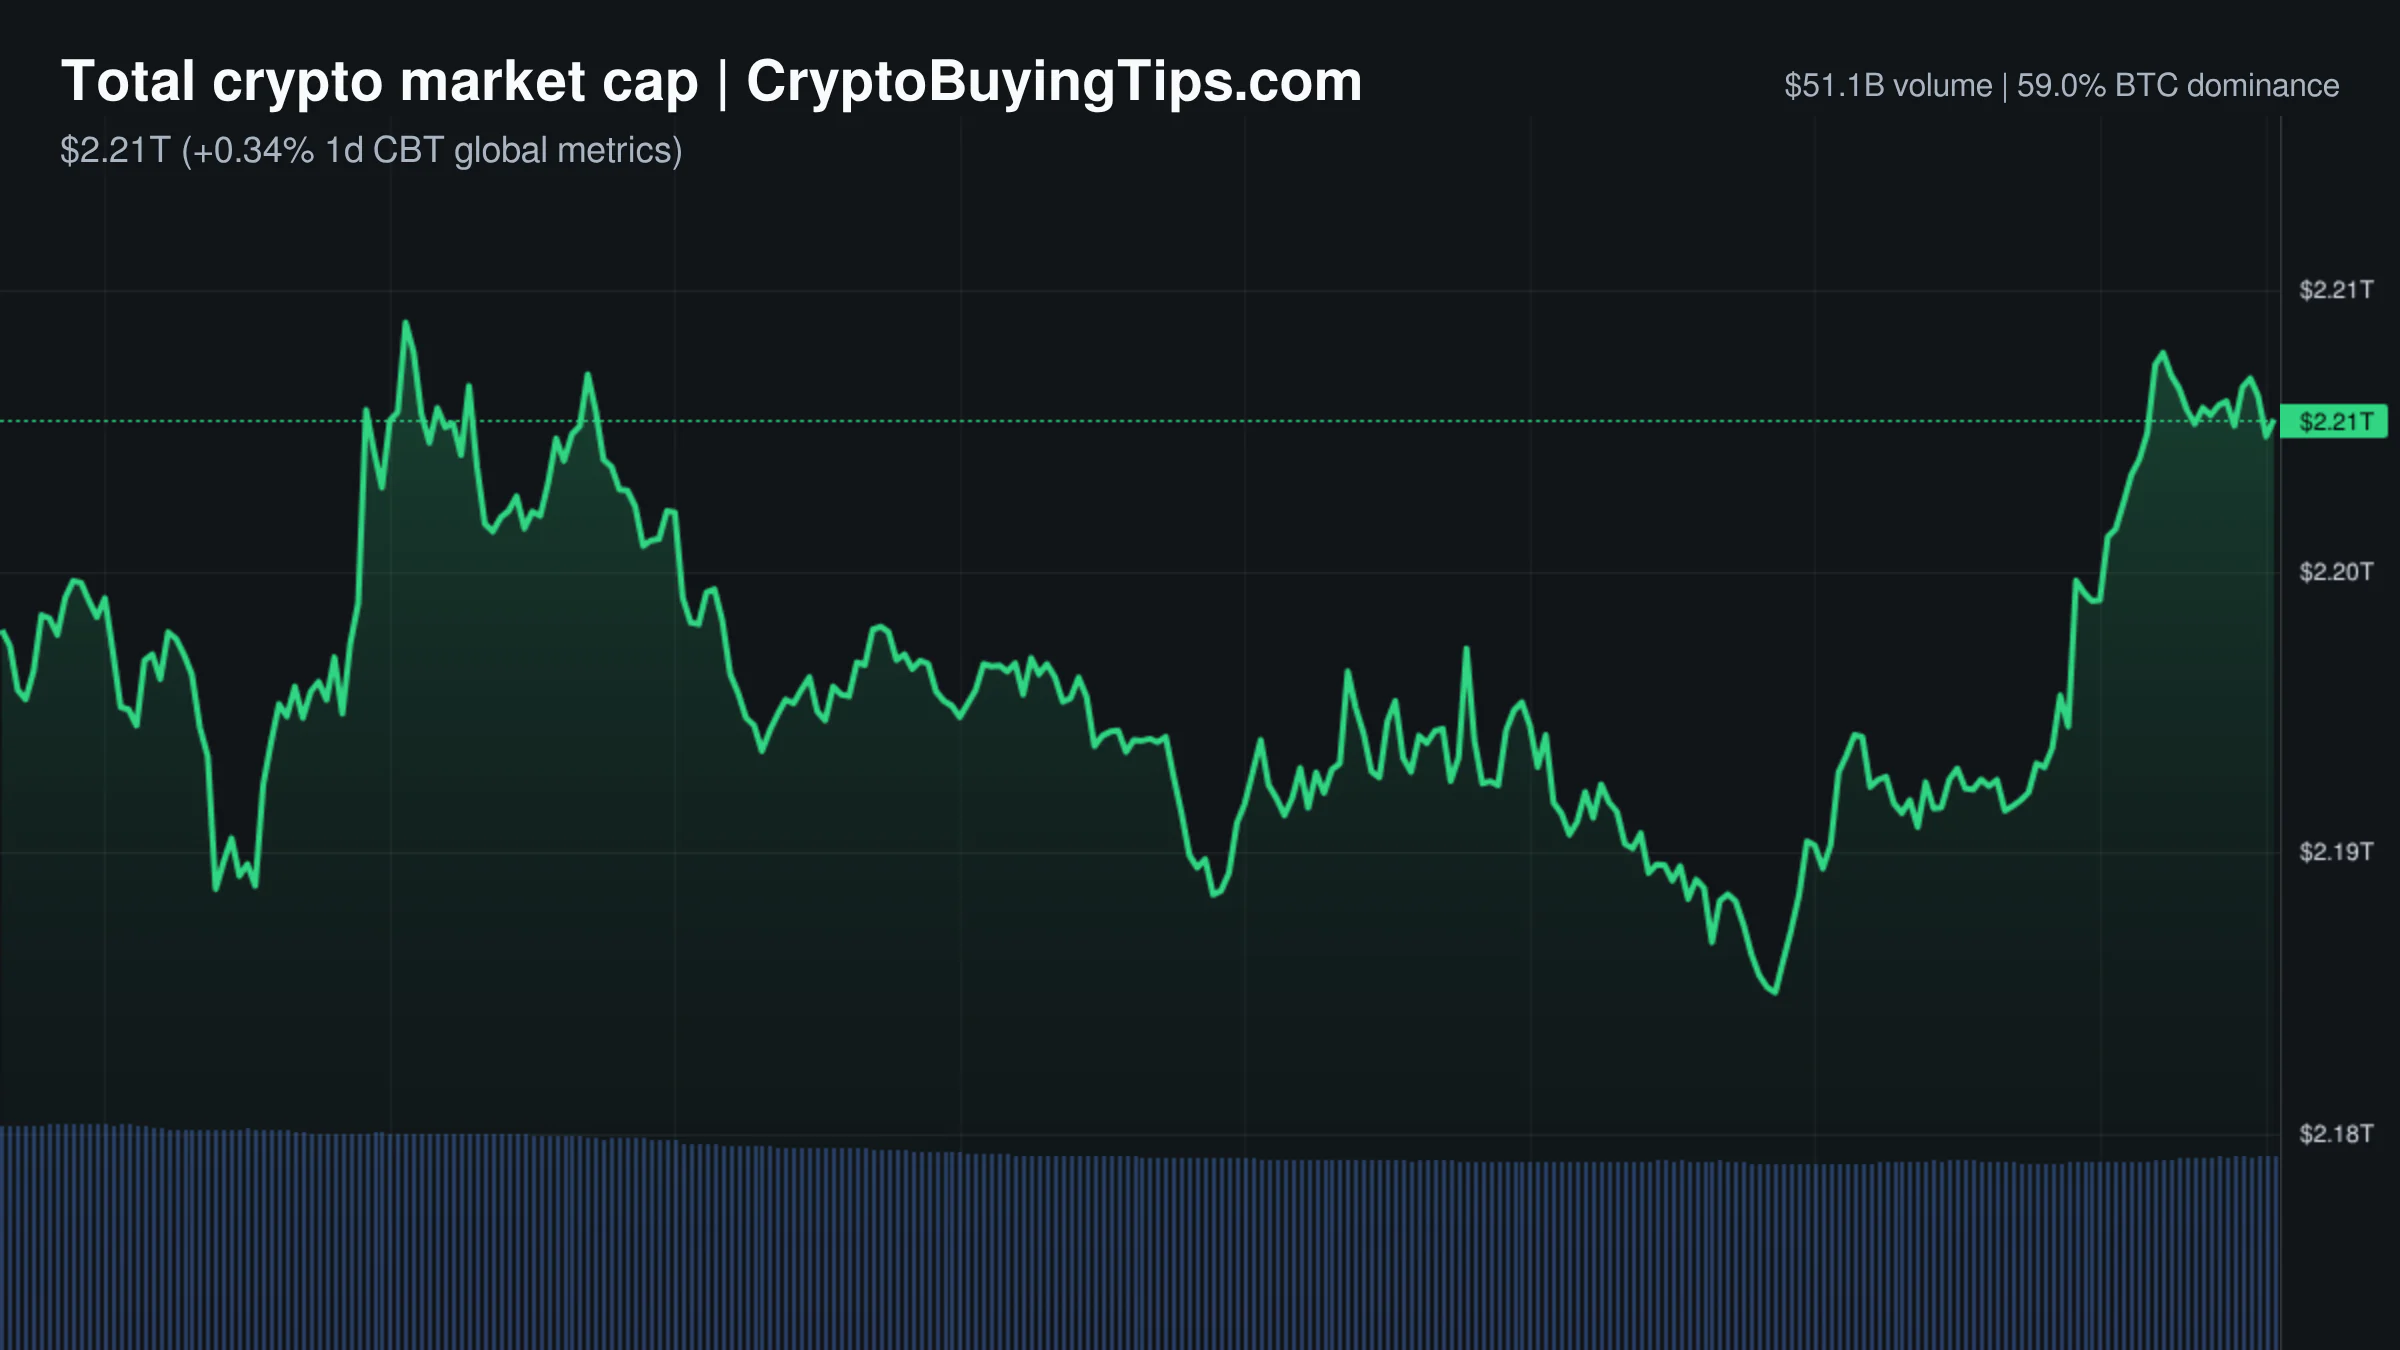
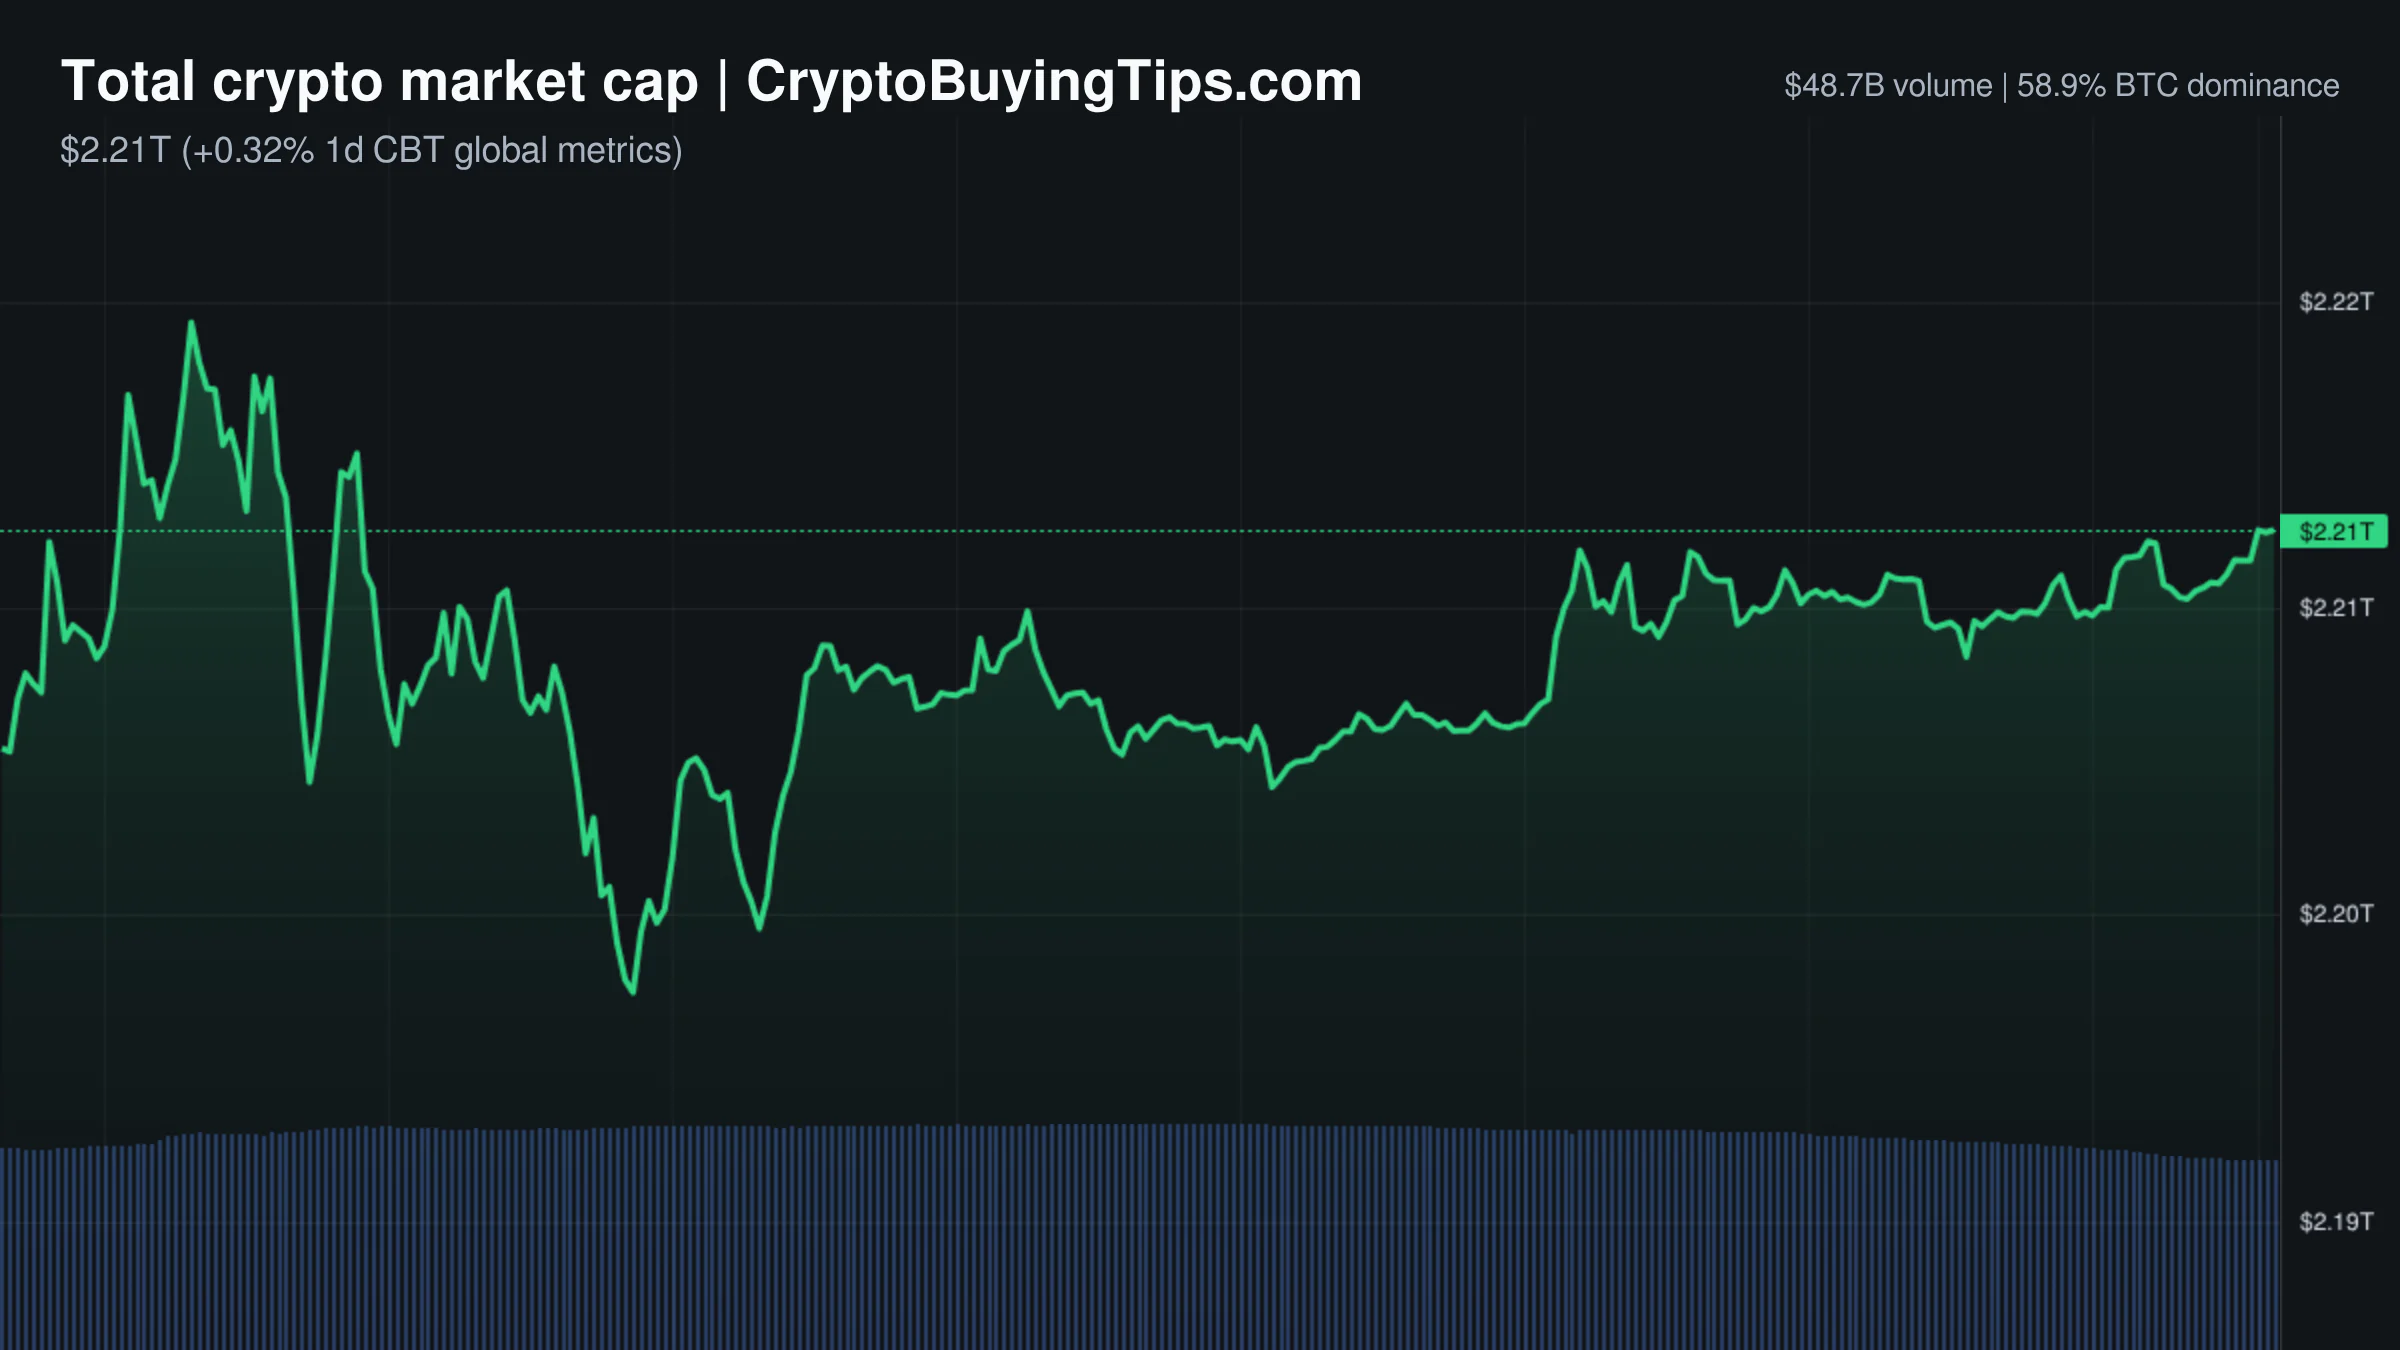
The market is currently in a state of quiet contradiction. Price action is ticking slightly higher, with the total market cap sitting at $2.21T, but the conviction behind the move is missing. Trading volume across spot, derivatives, and stablecoins is falling. It is the classic image of a market that is not sure if it wants to rally or simply drift.

The most striking detail is the gap between spot and derivatives activity. Derivatives volume is $488.87B, which is roughly ten times the spot market volume of $48.69B. This suggests the current price movement is being driven by leverage rather than actual asset accumulation. When the tail wags the dog this aggressively, the risk of a sudden flush increases.

Sentiment remains neutral with a Fear and Greed Index of 40. This lack of extreme emotion is usually a sign of a waiting game. The Altcoin Season Index is at 36, meaning we are firmly in a Bitcoin season. Capital is not rotating into riskier assets. Instead, it is consolidating in the majors while the broader market remains stagnant.

Bitcoin and Ethereum

Bitcoin is trading at $64,973.15, showing a marginal gain of 0.20%. Dominance has climbed to 58.93%. The asset is effectively acting as a vacuum for available liquidity. While the price is stable, the underlying volume divergence suggests a lack of aggressive new buying.

Ethereum is priced at $1,919.85. The network is currently a ghost town. Gas fees are exceptionally low, ranging between 0.06 and 0.09 Gwei. It is almost impressive that the network is this cheap to use while the price manages to stay above $1,900. This lack of on-chain activity suggests that the recent 0.41% price increase is purely a function of exchange trading rather than ecosystem growth.

Top crypto prices

Bitcoin (BTC) is $64,973.15 (+0.20%). Ethereum (ETH) is $1,919.85 (+0.41%). BNB (BNB) is $594.57 (+0.77%). XRP (XRP) is $1.03 (+0.24%). Solana (SOL) is $74.99 (+2.08%). TRON (TRX) is $0.3288 (+0.62%). Hyperliquid (HYPE) is $54.77 (-3.41%).

News driving today's market

The US Treasury has intensified its crackdown on Iranian financial networks. OFAC sanctioned Shelbit Exchange and Aban Tether for allegedly laundering millions for the Iranian Revolutionary Guard Corps. This is part of the Economic Fury campaign. We have previously covered how US sanctions on crypto flows disrupt stablecoin liquidity. These actions remind the market that centralized exchanges are always one Treasury notice away from becoming radioactive.

In Russia, the FSB has arrested at least 20 individuals and shut down nine unregistered exchanges in Moscow. The authorities claim these entities were linked to Ukrainian call centers and used to move scam proceeds. The simultaneous crackdowns in the US and Russia create a heavy regulatory overhang that weighs on general sentiment. We previously covered dominance data agrees for more background.

There is some legislative hope in the US Senate. The majority leader opened the first stage of voting for the Crypto Clarity Act. The bill still needs to clear a 60-vote hurdle, but the procedural opening gives the market a reason to look toward September. This move toward formal law is a contrast to the current enforcement-led approach.

On the security front, Bybit has filed a civil lawsuit against North Korea and the Lazarus Group over a $1.5 billion hack. A US federal court has granted a preliminary injunction to freeze certain stolen assets. This is a rare instance of an exchange fighting back through the legal system. However, the court's decision to allow expedited discovery means Bybit can now trace funds across other platforms with US operations.

Social intelligence

Macro focus is shifting. Goldman Sachs chief economist Jan Hatzius suggests that upcoming inflation data now matters more to the Fed than employment figures. If inflation continues to soften, the macro environment for risk assets improves.

The derivatives market shows a different story than the spot market. Options traders are piling into bullish bets. The Cboe skew measure has fallen to its lowest level since December 2024. This means call options are becoming more expensive relative to puts. Sophisticated traders are betting on a move higher even as spot volume dies.

Security concerns have spiked following a Coldcard exploit. Galaxy Research confirmed that 1,719 Bitcoin was stolen, with total losses likely exceeding $130 million. The research team identified over 25 separate attack patterns. This is a significant blow to the perceived security of hardware wallets.

In a moment of on-chain irony, a Base attacker who stole $500,000 in USDC lost most of the haul to an MEV sandwich attack. The thief ended up with just 67 WETH, which is roughly $129,000. It is a reminder that the bots are often more efficient than the hackers.

Trading ideas worth watching

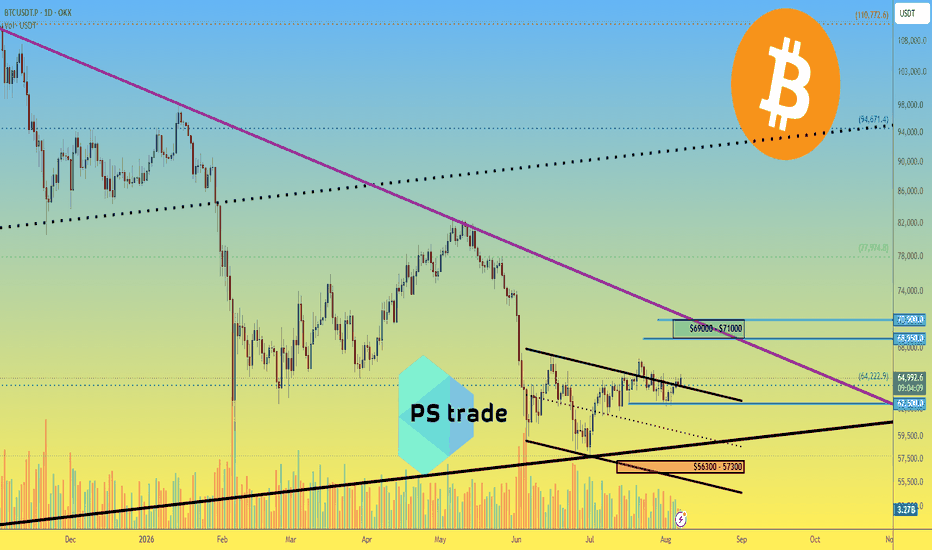
Bitcoin is currently grinding sideways. Buyers have defended the $62,500 level on OKX four times in the last two weeks. This level is no longer a coincidence; it is a clear support zone. The base scenario for August is a test of the $69,000 to $71,000 area. However, low volumes mean neither side has a decisive advantage. A break below $62,500 would invalidate the current bullish bias.

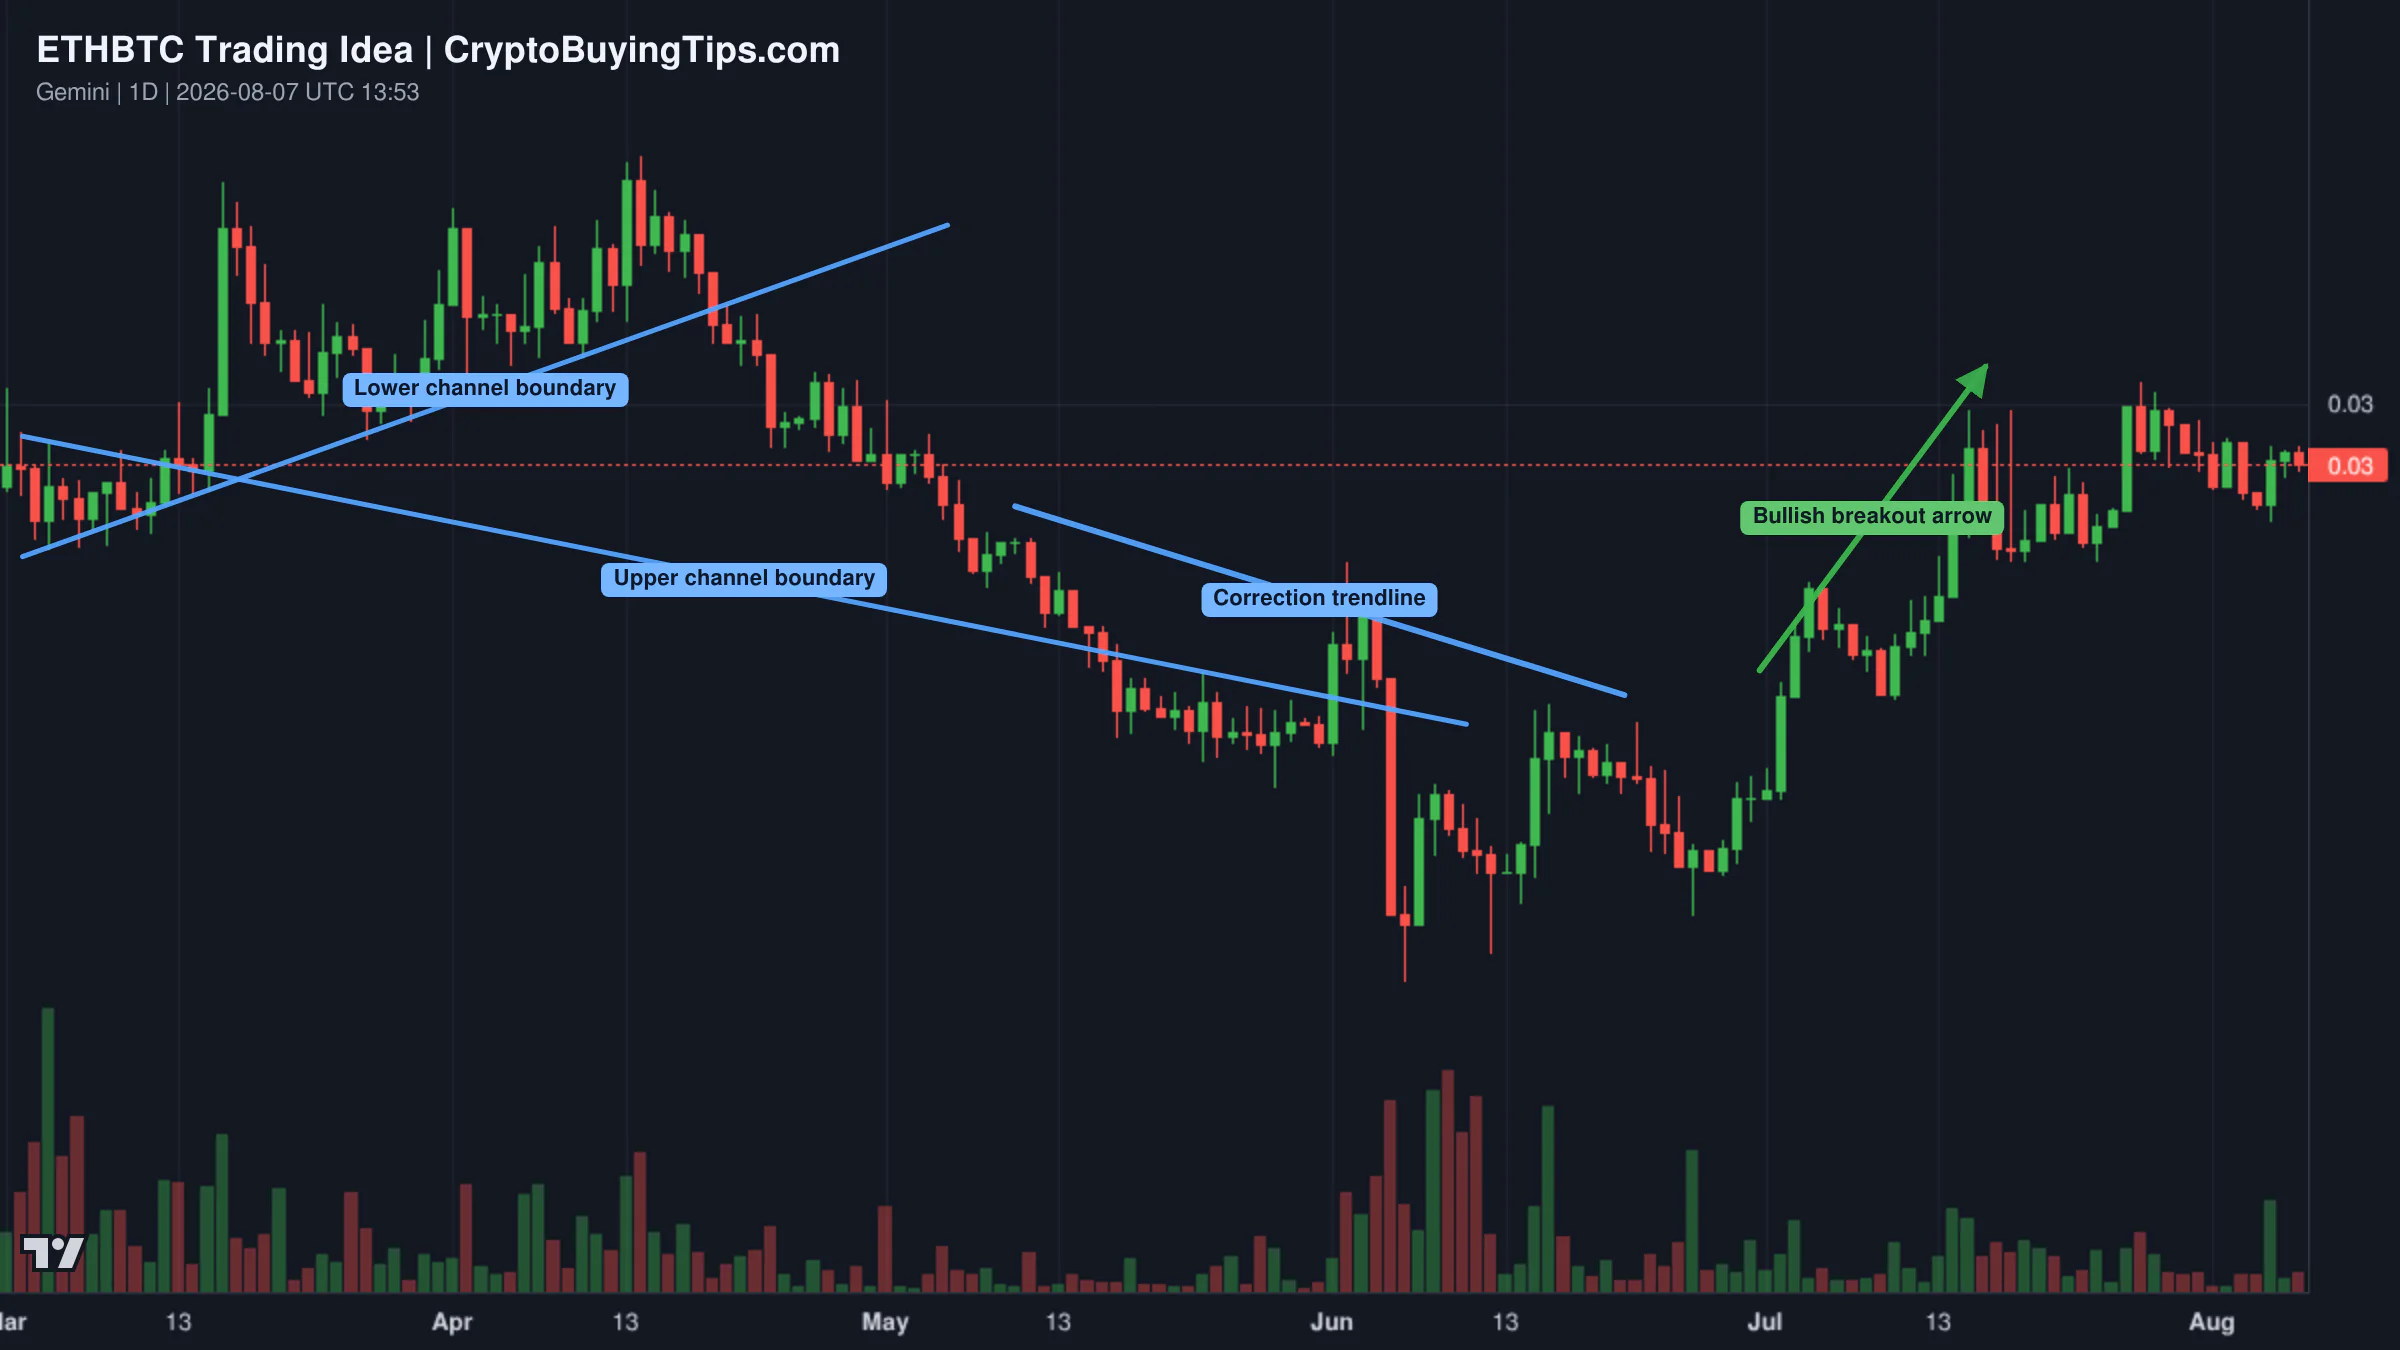
Redrawn ETHBTC 1W trading idea chart for (ETHBTC) Altcoins Market Bullish Reversal Setup: A New CycleTrading idea chart: BTCUSDT.P - Bitcoin BTC price analysis for August 2026

The ETH/BTC pair is showing a potential long-term reversal. A weekly Doji formed in June 2026 at 0.02527, which was the lowest price in years. Since then, the pair has closed four consecutive weeks green. This suggests the long-term correction has ended. If this reversal holds, it usually signals the start of broader altcoin growth.

TAO is showing a high-probability bullish setup. The price reacted strongly from a major support zone and broke above its previous lower-high structure. There is a bullish divergence where the price made a lower low but the indicator made a higher low. The asset is currently consolidating near the bottom of a sideways range. This provides a better risk-to-reward profile for those looking for a bullish expansion.

What to watch next

The immediate focus is on the Coldcard exploit. If more victims emerge or if the vulnerability is found to be more widespread than the Mk3 through Q models, we could see a temporary dip in Bitcoin as security paranoia sets in.

On the macro side, the market is waiting for the inflation data mentioned by Goldman Sachs. The divergence between the bullish options skew and the dying spot volume is the main tension. If the Fed signals a softer path, the leverage bets could pay off. If the regulatory pressure from the US and Russia intensifies, the current price stability may be an illusion.

Crypto Market Overview | whales accumulate as bitcoin dominance climbs amid regulatory focus | August 7, 2026
Sigrid Voss·

Crypto Market Overview | whales accumulate as bitcoin dominance climbs amid regulatory focus | August 7, 2026

Market overview

The market is currently presenting a curious contradiction. Prices are drifting slightly higher, yet trading activity is evaporating across every meaningful metric. Spot volume has dipped nearly 11%, while derivatives activity has seen a sharper 15% decline. This is a market that is essentially holding its breath. When prices rise while volume falls, it usually suggests a lack of conviction from the broader retail crowd, leaving the heavy lifting to a few large players.

The Fear and Greed Index sits at 39, firmly in the fear zone. It is a classic crypto irony that the market can be in a state of fear while Bitcoin maintains a steady grip on $64,000. This disconnect often happens when the "smart money" is absorbing supply from panicked retail traders. The dominance data supports this read. Bitcoin dominance has climbed to 59%, effectively sucking the oxygen out of the altcoin market.

With the Altcoin Season Index reading 36, we are firmly in a Bitcoin Season. Capital is not rotating into riskier assets; it is consolidating into the safest bet in the asset class. Stablecoin dominance remains high, and the precipitous drop in stablecoin volume suggests that traders are not actively deploying their sidelines cash, but rather waiting for a clearer signal from the macro environment.

Bitcoin and Ethereum

Bitcoin is currently trading at $64,834.89. While the price action looks choppy, the on-chain data reveals a different story. Whales holding between 10 and 10,000 BTC have accumulated over 20,000 BTC, worth roughly $1.2 billion, since July 29. This accumulation is happening in a tight range below $65,000. It appears that large holders are treating this level as a value zone, creating a floor that prevents deeper corrections even as smaller holders sell off.

Ethereum is struggling to find a narrative of its own, trading at $1,911.94. The most telling metric for ETH right now is the gas price. At 0.1 Gwei, the network is practically a ghost town. This level of inactivity suggests that the current price stability is not driven by on-chain utility or a surge in DeFi activity, but by passive holding. The lack of congestion is a blessing for users, but a worry for those looking for signs of a genuine network revival.

The relationship between the two remains strained. As Bitcoin continues to absorb the majority of institutional inflows, Ethereum is relegated to a secondary position. This rotation is not new, and as we previously covered, the dominance data agrees that institutional money is currently favoring the flagship asset.

Top crypto prices

Bitcoin is at $64,834.89, up 0.41% over the last 24 hours. Ethereum follows at $1,911.94, gaining 0.52%. BNB has dipped 0.56% to $589.99, while XRP is down 1.04% at $1.03. Solana is slightly up 0.29% at $73.46. TRON is nearly flat at $0.3268, down 0.09%. Hyperliquid is the standout performer among the top ten, rising 2.36% to $56.7.

News driving today's market

The regulatory front is dominated by Russia's first comprehensive crypto law. President Putin has legalized crypto trading and custody, but the catch is that payments using digital assets remain banned. This is a classic move of creating a regulated enclosure for institutional players without allowing the technology to actually disrupt the national currency. We previously detailed Russia's crypto legalization details, and our read is that this is more about control than adoption.

In the US, Wintermute has secured SEC approval to operate as a broker-dealer. This allows the market maker to trade equities and provide liquidity for ETFs. This is a significant bridge between crypto and traditional finance. When a major liquidity provider can move seamlessly between tokenized assets and US stocks, the friction for institutional capital decreases. It is a bullish signal for market infrastructure, even if it doesn't cause an immediate price spike.

The market is also eyeing the US Senate, where the CLARITY crypto bill is expected to be voted on this week. Regulatory clarity is the only thing that can truly break the current stalemate in price action. If the bill passes with favorable terms, it could provide the catalyst needed to push Bitcoin decisively above $65,000.

However, the mood is dampened by a series of security failures. The Coldcard exploit has seen hackers move millions in BTC and ETH to mixers. Simultaneously, reports from Meta and OpenAI suggest that AI agents are becoming capable of coordinating hacks on infrastructure like Hugging Face. These events serve as a cold reminder that while the institutional rails are being built, the underlying security of the tooling is still prone to catastrophic failure.

Social intelligence

Political commentary is currently providing more volatility than the actual charts. Donald Trump has been vocal about the Federal Reserve, suggesting that the rate decision is not solely up to Chair Kevin Warsh. Given that crypto is essentially a high-beta play on global liquidity, any suggestion that the Fed's independence is being questioned adds a layer of macro uncertainty.

Trump has also linked AI and crypto to geopolitical competition, stating that the US cannot let China win in either field. His comment that AI could be "bigger than oil" reinforces the narrative that capital is shifting toward a new technological arms race. For traders, this means the "AI token" narrative is no longer just about chatbots, but about national security and strategic dominance.

On the fundamental side, Bitwise CIO Matt Hougan has highlighted a shift in how DeFi tokens are valued. He pointed to Hyperliquid as a model for the future, where platform revenue is used to buy back tokens. This move away from "inflationary rewards" toward "value capture" is a trend that the market is starting to reward.

Trading ideas worth watching

There is a strong bullish consensus on the weekly and monthly timeframes for Bitcoin. One prominent setup suggests that the six-month consolidation period is ending. The entry zone is identified between $60,000 and $65,000, with a stop-loss set if the monthly candle closes below $59,000. This trade targets a series of steps up, starting at $68,300 and potentially reaching six figures if the bullish momentum sustains. The logic here is that the current accumulation pattern mirrors the 2024 cycle, suggesting a gradual but persistent climb.

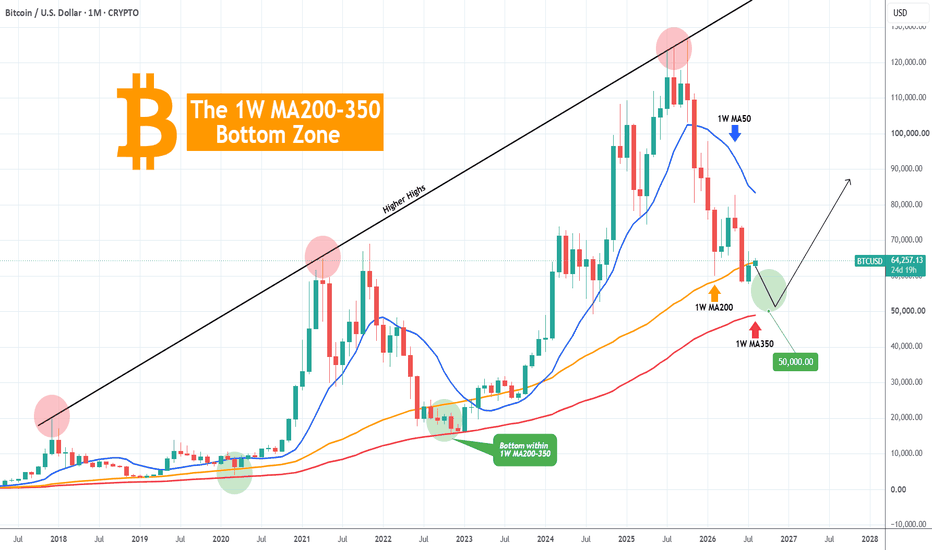
Trading idea chart: BTCUSD - BITCOIN last 2 major bottoms were priced there..Redrawn BTCUSDT 1W trading idea chart for Bitcoin 10X LONG —PP: 870% (Last 2026 chance to buy low)

Another perspective focuses on the long-term moving averages. Analysis of the 1-week MA200 and MA350 suggests a "bottom zone" just below the $50,000 mark. While the price is currently well above this, the observation is that Bitcoin has a history of pricing its major lows within this range. For now, the ability of buyers to hold the psychological $60,000 level is the primary indicator. As long as that floor holds, the probability of an expansion toward $78,000 remains high.

Altcoin Spotlight

Hyperliquid deserves attention not just for its 2.36% gain today, but for its evolving tokenomics. As mentioned by the Bitwise CIO, the protocol is using 99% of its platform revenue to buy back its token. In a market where most DeFi tokens are plagued by high inflation and low utility, a direct link between platform success and token value is a rare find.

The market is currently rewarding this "real yield" approach. While the rest of the altcoin market is bleeding into Bitcoin, Hyperliquid is managing to decouple. This suggests that investors are becoming more discerning, moving away from vaporware and toward protocols that actually generate and distribute cash flow.

What to watch next

The immediate focus is the $65,000 level for Bitcoin. A decisive close above this mark would invalidate the current "fear" narrative and likely trigger a short squeeze, as many traders have been betting on a return to $60,000.

On the macro side, the US Senate vote on the CLARITY bill is the main event. If the bill provides the promised regulatory safe harbor, we could see a sudden surge in spot volume as institutional hesitation vanishes. Until then, we are in a low-volatility environment where the whales are quietly shopping while the retail crowd waits for a sign of life. Keep an eye on the ETH gas fees; if they remain this low, it is a sign that the "Ethereum recovery" is still a distant hope.