Market Overviews

Daily crypto market overviews, trend analysis, and key updates from our editorial team.

Crypto Market Overview | Institutional adoption meets geopolitical risk | May 13, 2026
Sigrid Voss·

Crypto Market Overview | Institutional adoption meets geopolitical risk | May 13, 2026

Market overview

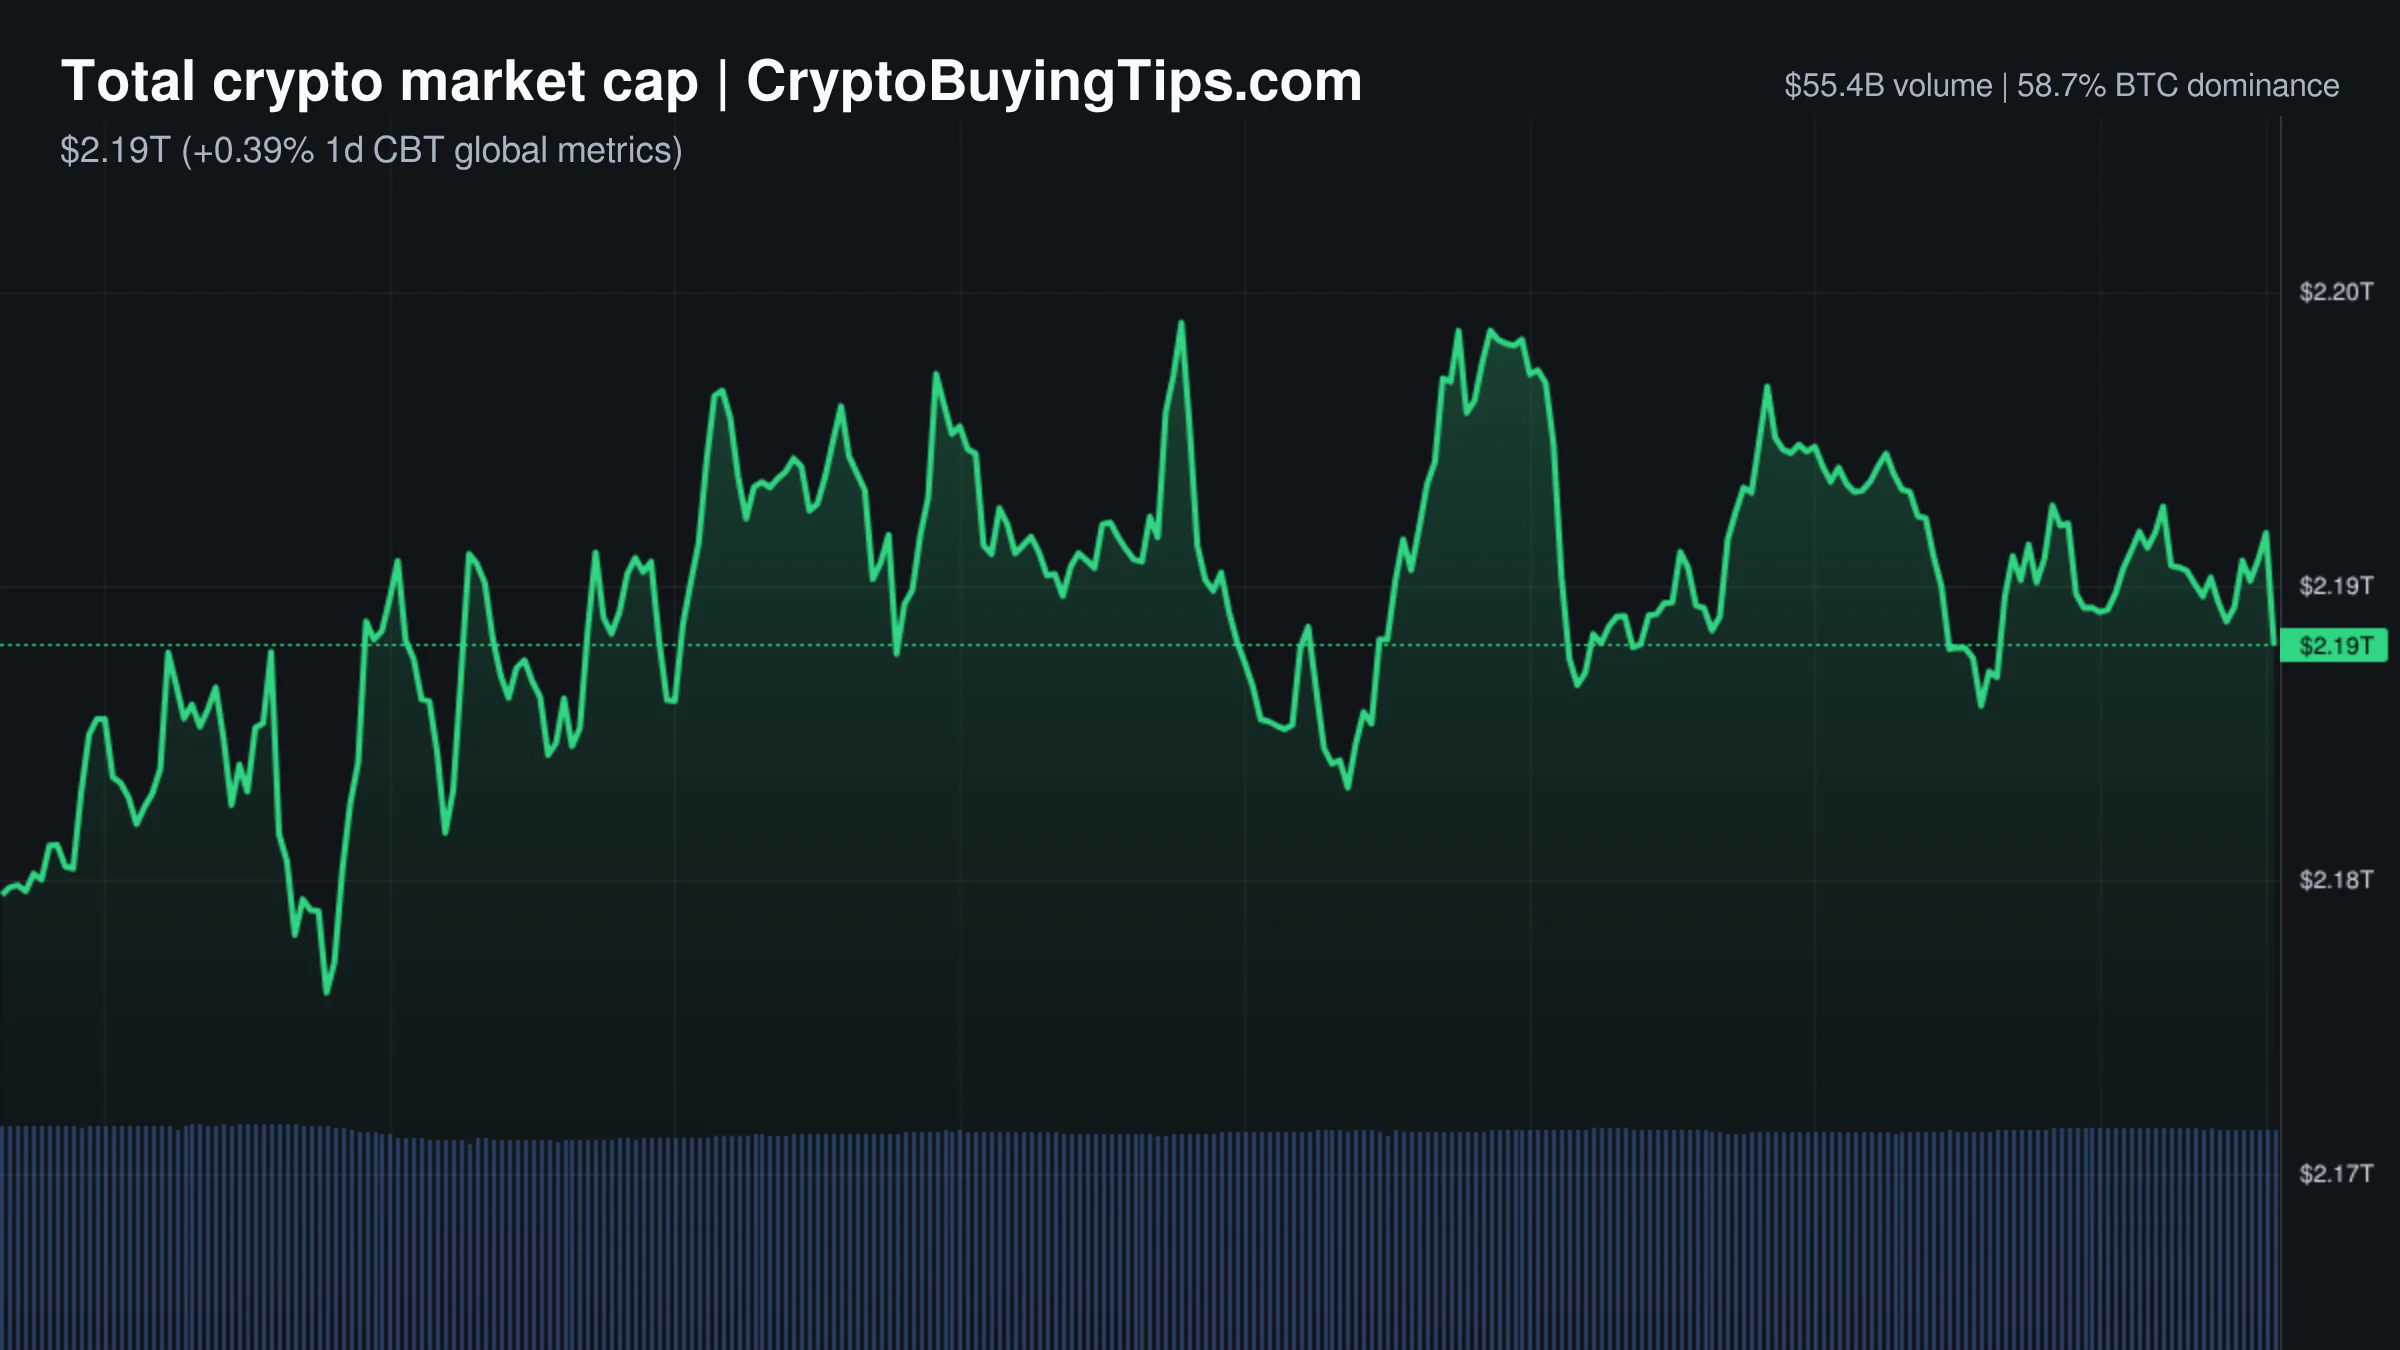
The crypto market is currently in a state of neutral consolidation, with the total market cap sitting at $2.76T. While the 24h change is nearly flat at -0.10%, the underlying data suggests a complex tug-of-war between institutional onboarding and macroeconomic risk. Trading volume remains substantial at $101.9B, but the split between spot and derivatives activity is telling. Derivatives volume is significantly higher at $734.33B, though it has dipped nearly 3% in the last 24 hours, suggesting a slight cooling of leveraged bets.

Sentiment is perfectly balanced, with the Fear & Greed Index at 49. This neutral reading aligns with the Altcoin Season Index of 41, which indicates that we are still firmly in a Bitcoin season. Bitcoin dominance is holding a strong grip at 58.21%, meaning capital is not yet rotating aggressively into smaller assets. Interestingly, DeFi volume is up 7.08% despite the broader market dip, which points to a quiet rotation into decentralized protocols while the majors trade sideways.

The macro backdrop is weighing on risk appetite. Both the S&P 500 and NASDAQ are trading in the red, with the NASDAQ seeing a sharper decline of 0.85%. This correlation suggests that the current crypto stagnation is not an isolated event but a reflection of a broader risk-off mood in global equities.

Bitcoin and Ethereum

Bitcoin is trading at $80,230.87, down 0.78% over the last 24 hours. The asset is struggling to maintain a definitive breakout, with its dominance remaining high. The price action is currently trapped between institutional demand and short-term technical resistance. While the entry of retail customers via Charles Schwab provides a long-term liquidity tailwind, the immediate pressure is coming from the derivatives market, where open interest in perpetuals remains massive at $459.17B.

Ethereum is priced at $2,285.62, showing more resilience than Bitcoin with a modest 0.20% decline. The network state is notably quiet, with gas fees sitting at a very low 0.69 Gwei for fast transactions. This lack of congestion suggests a lull in on-chain activity, though the fundamental outlook is bolstered by the Ethereum Foundation's rollout of the Clear Signing standard to combat phishing. The focus for ETH is now on whether institutional tokenization projects, such as the one filed by JPMorgan, can translate into actual network demand.

Top crypto prices

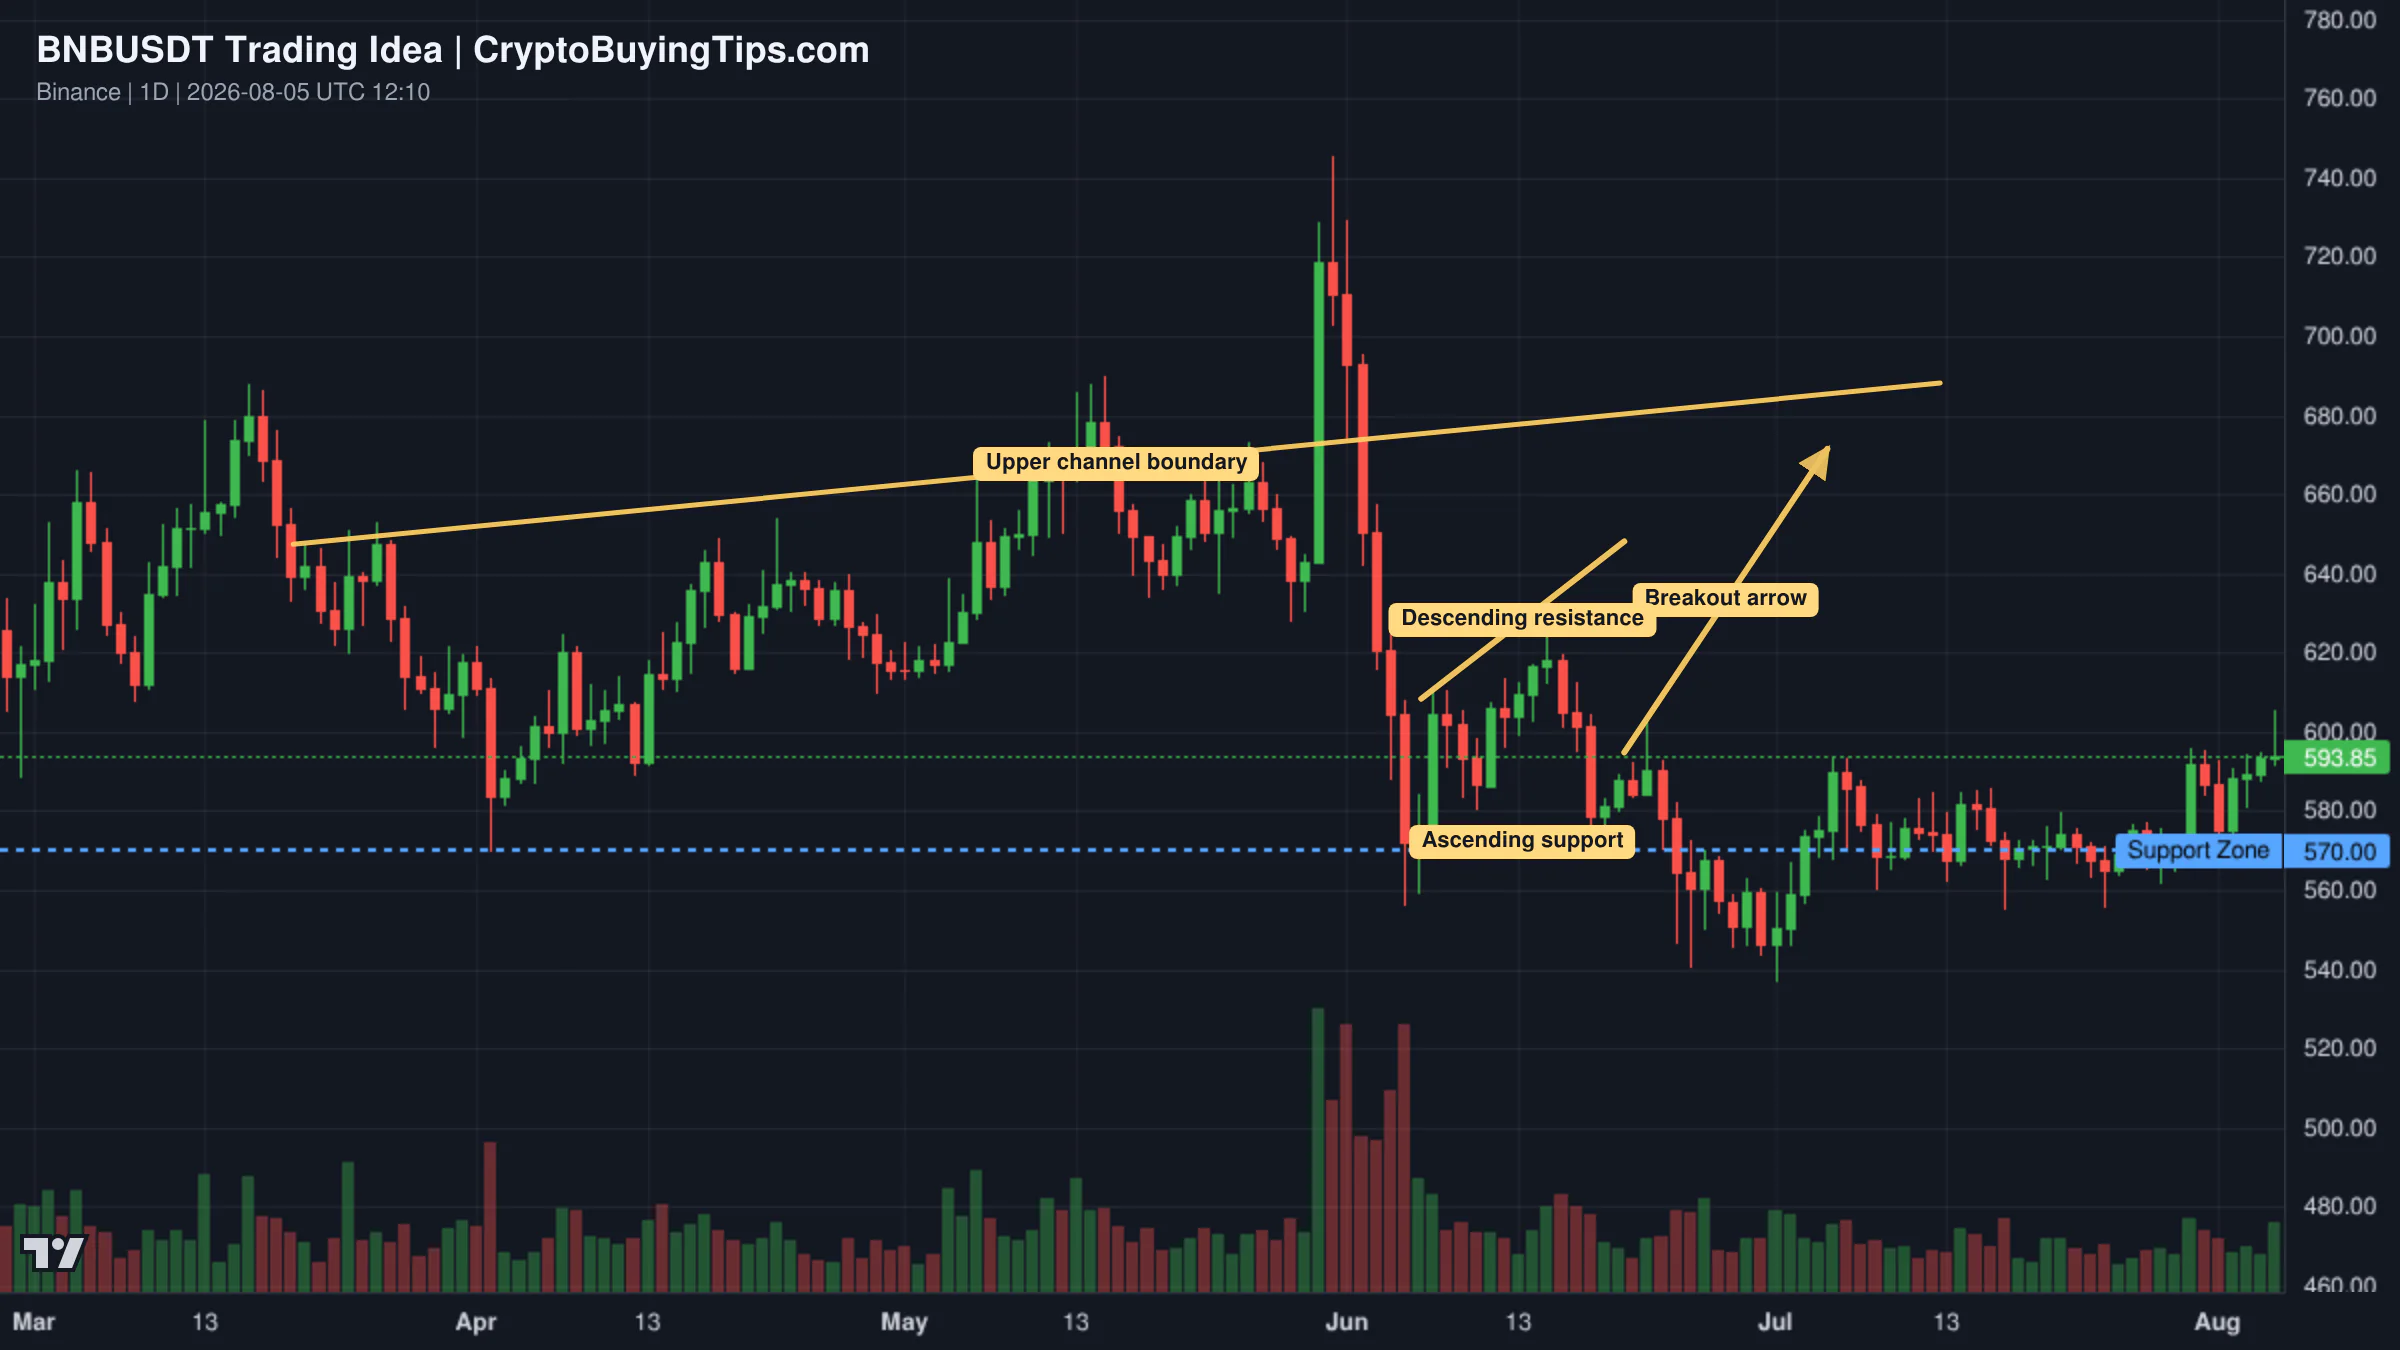
The market leaders are seeing mixed results. BNB is a notable outlier among the top assets, climbing 1.75% to $673.4. XRP is down 1.17% at $1.43, while Solana has faced a sharper correction of 2.14%, bringing its price to $93.15. TRON remains relatively stable at $0.3503. Hyperliquid has seen a significant 4% drop, currently trading at $39.23.

News driving today's market

Institutional adoption is the primary bullish driver. The launch of "Schwab Crypto" for retail clients and the partnership between Kraken and Franklin Templeton to develop on-chain investment products suggest that the bridge between Wall Street and crypto is widening. These moves are echoed by the DTCC enlisting Chainlink for collateral management, which shifts blockchain from a speculative tool to a core piece of financial infrastructure. We previously covered how Tokenized Stocks Explained are changing the game for everyday investors, and these latest moves by JPMorgan and Franklin Templeton confirm that trend.

On the bearish side, regulatory and geopolitical risks are spiking. The US Treasury's freeze of $344M in USDT linked to Iran is a reminder of the centralized control over stablecoins. Arkham's mapping of these wallets increases the transparency of sanctioned flows, which we previously discussed regarding the US Crypto Sanctions Impact.

Furthermore, the confirmation of Kevin Warsh to the Fed board introduces uncertainty. Warsh is often viewed as a hawk, and his potential to replace Jerome Powell could lead to tighter monetary policy, which generally hurts high-risk assets. Finally, warnings from OpenAI and Anthropic regarding unauthorized AI startup shares have created a ripple of caution among investors who hold tokenized interests in AI-linked schemes.

Social intelligence

On-chain data reveals a massive institutional move, as @lookonchain reported that BlackRock deposited 861 BTC and over 44,000 ETH into Coinbase Prime. This is a high-signal event that usually precedes either a large-scale liquidation or a strategic rebalancing of institutional portfolios.

The mood on social media is heavily influenced by escalating geopolitical tensions. Reports from @DeItaone regarding Polish jets scrambling due to Russian strikes and Iran's claims that controlling the Strait of Hormuz would double its oil revenues are creating a "flight to safety" mentality. These events often push traders out of volatile altcoins and back into stablecoins or Bitcoin.

In the protocol space, the news from @WuBlockchain about the shutdown of Legend is a sobering reminder of the risks in the metaverse and DeFi sectors. Despite raising $15M from heavyweights like a16z and Coinbase Ventures, the app is going offline in July. This highlights that venture backing is not a guarantee of longevity.

Trading ideas worth watching

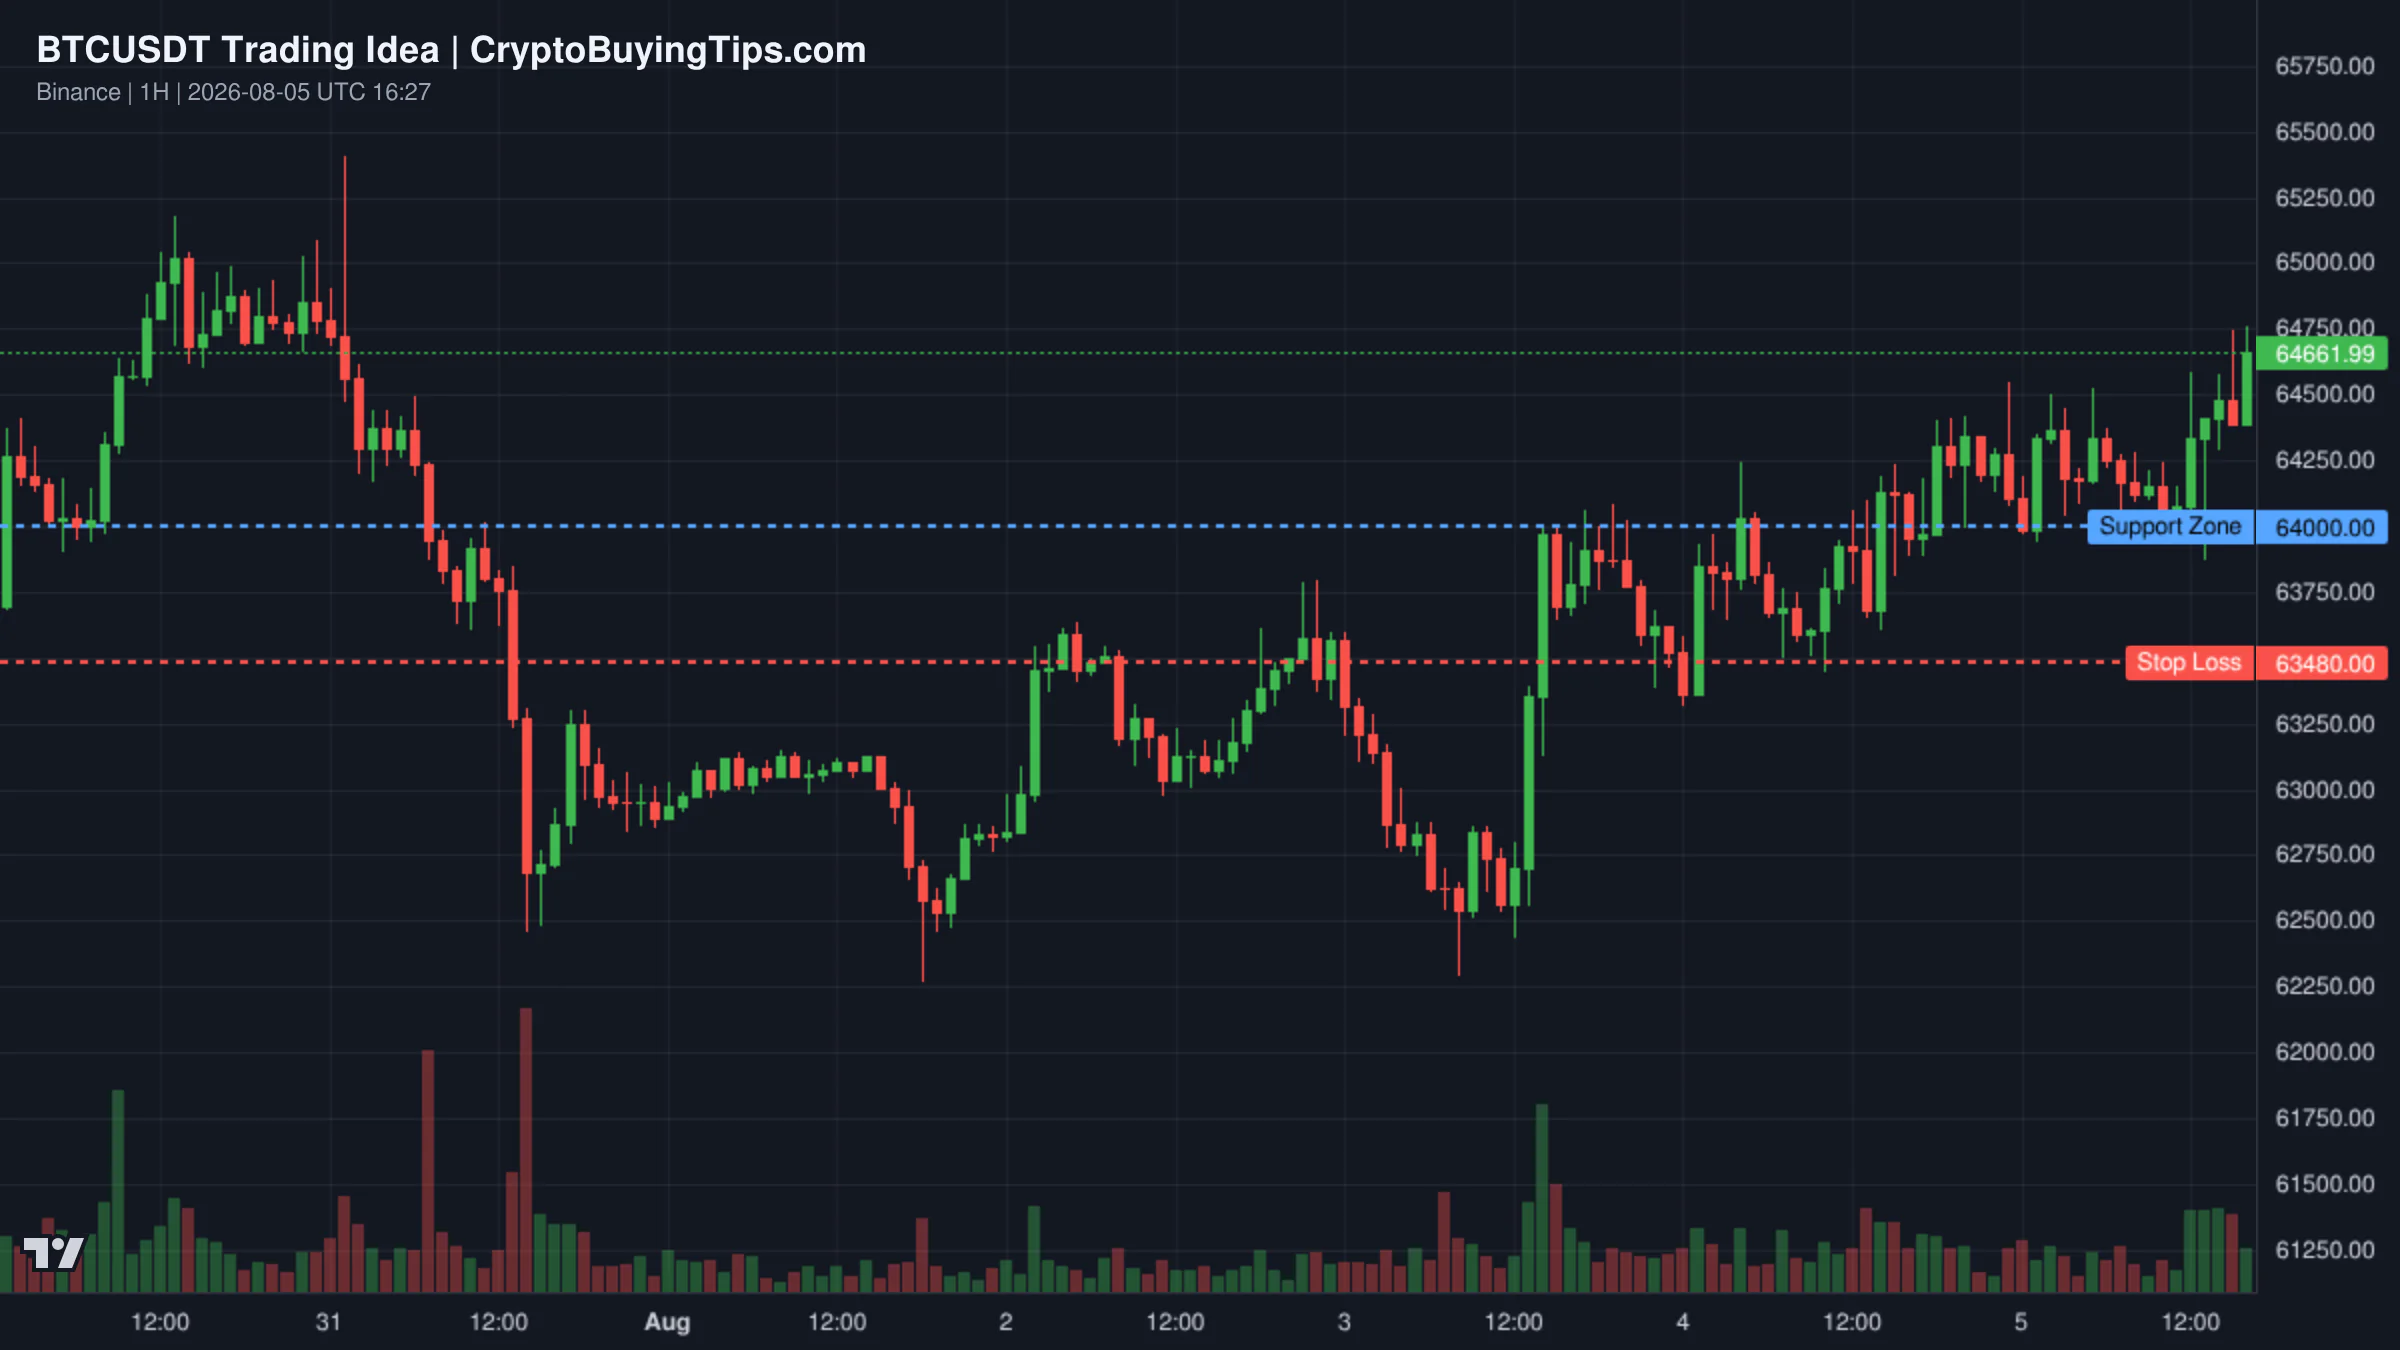
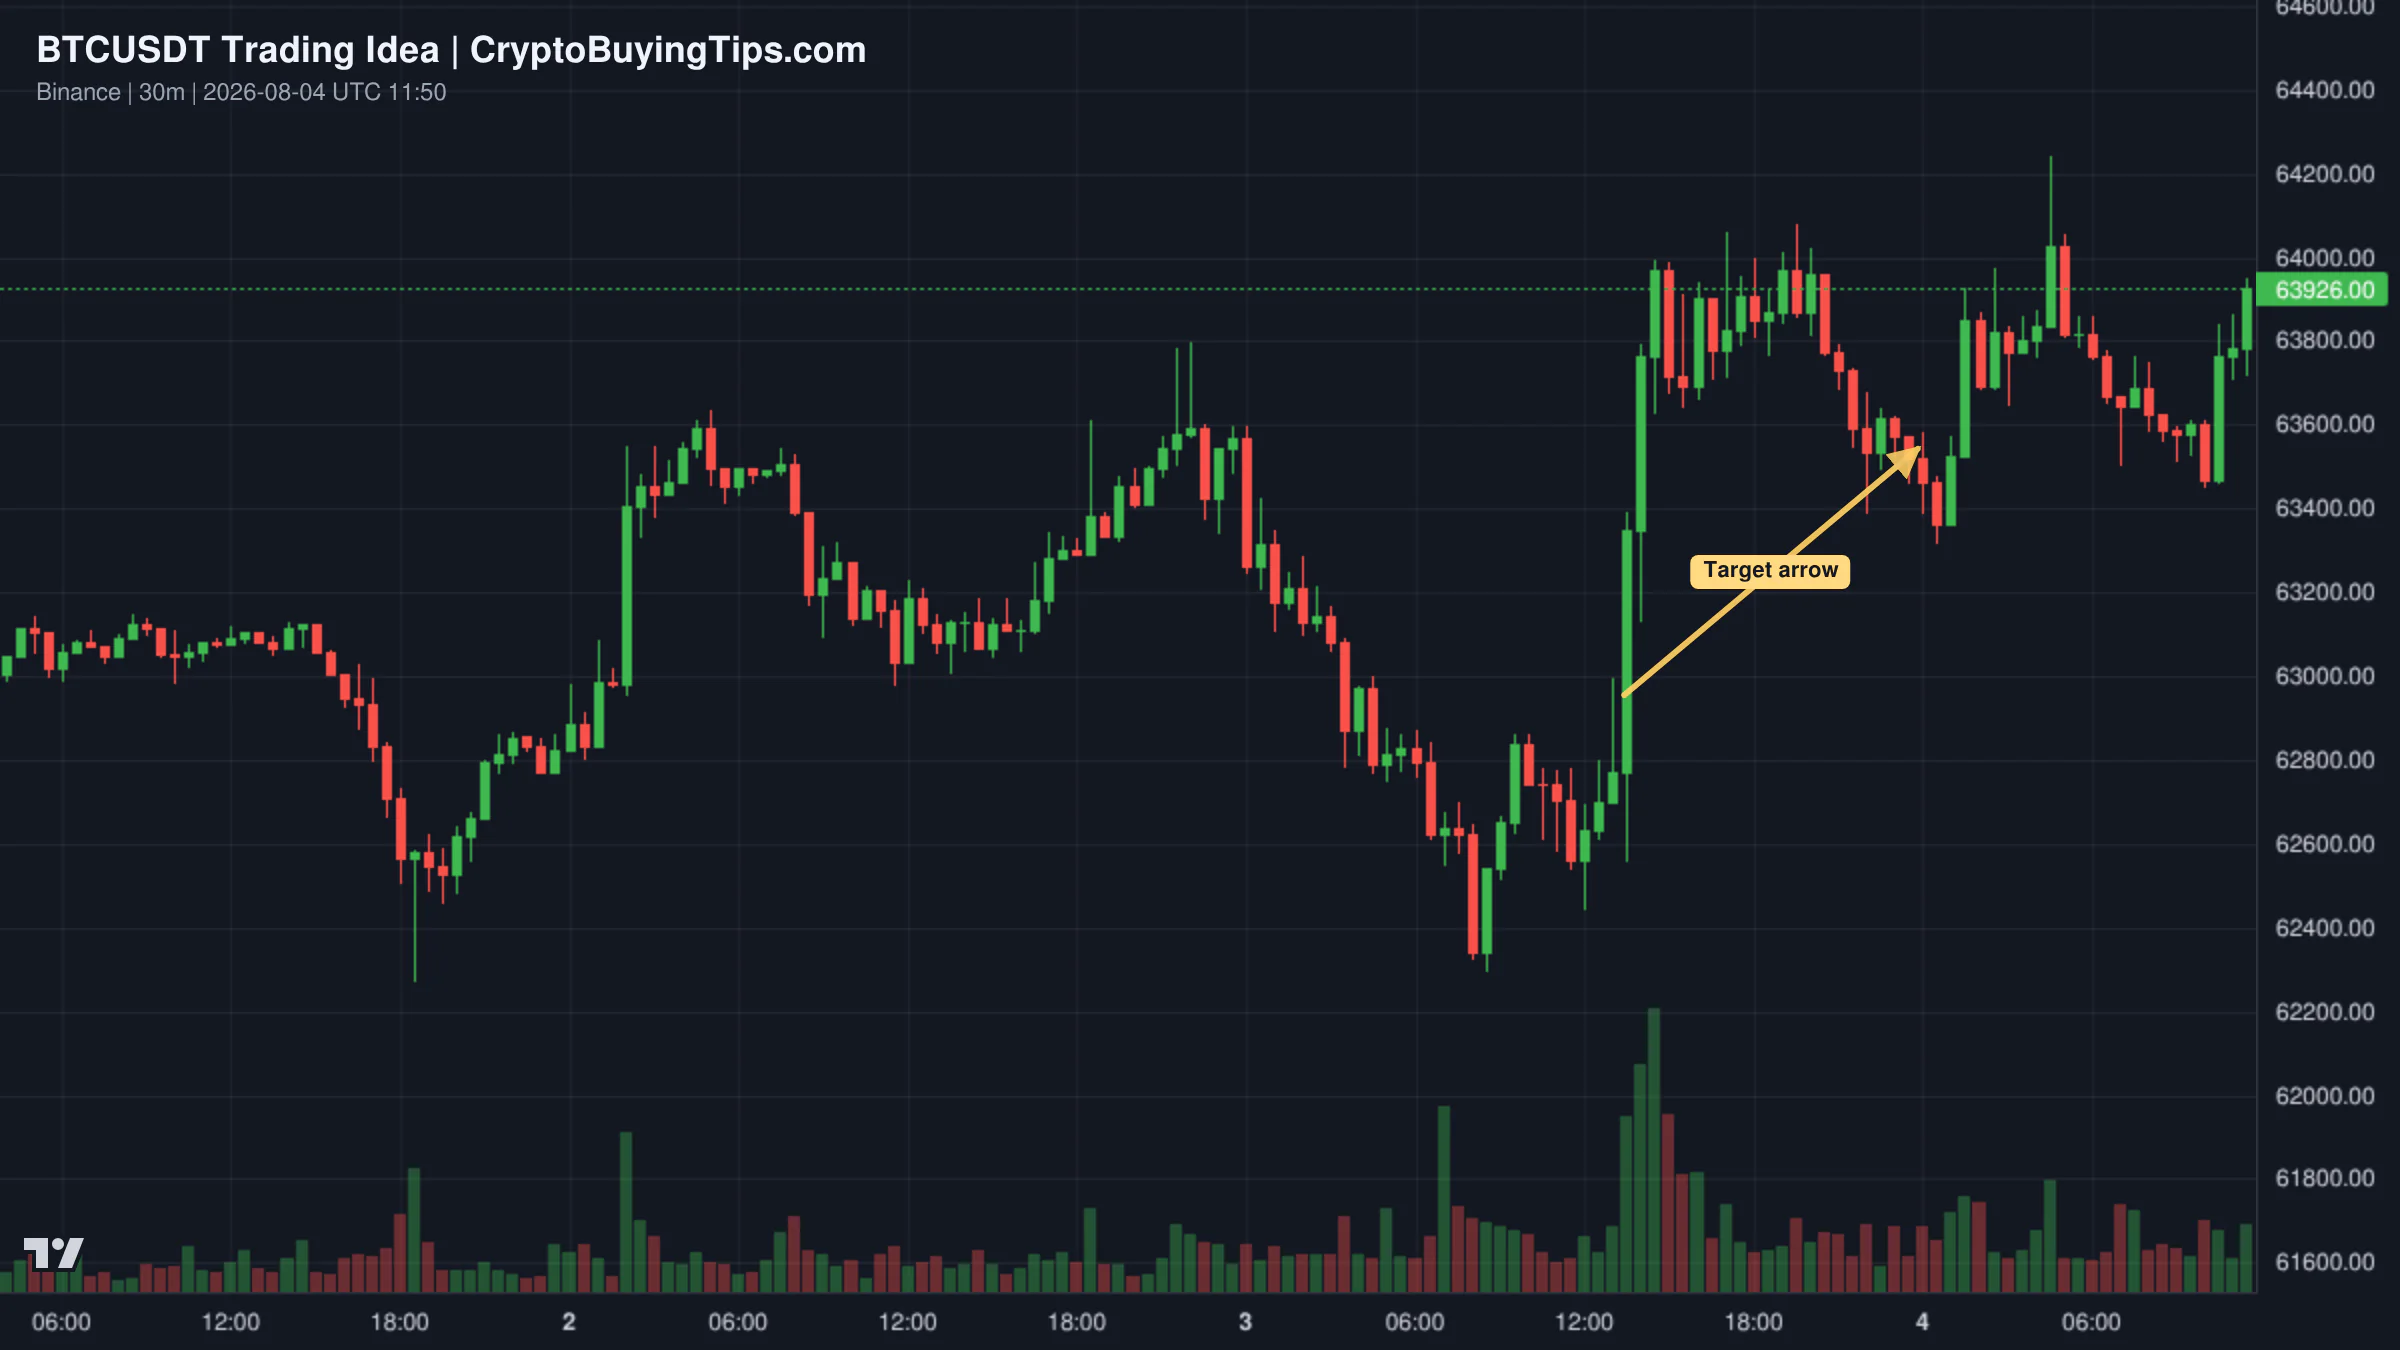
A bullish outlook on BTCUSDT suggests a correction is necessary before a move higher. The setup identifies a potential entry zone between $80,300 and $80,460. If Bitcoin holds this level, the targets are set at $81,460 and $82,150. This view assumes the current dip is a healthy pause rather than a trend reversal.

Trading idea chart: BTCUSDT - Bitcoin Looks Quiet _ But Pressure Is BuildingTrading idea chart: BTCUSDT - Bitcoin : Correction First, Then Continuation Higher

A more cautious short-term perspective on the 15-minute timeframe sees Bitcoin moving near a Potential Reversal Zone between $81,250 and $81,480. The analysis suggests that if support lines break, the price could attack the $80,380 to $80,800 zone. Traders are watching the $79,120 to $79,780 range as a major liquidation area for longs, which could accelerate a move downward.

A bearish technical take warns of double-top patterns on the 4-hour chart. This setup suggests that a close below key support on the 1-hour chart could trigger a drop toward $80,000, with a deeper target of $75,000 if the second double top is confirmed. The declining volume on each peak is the primary indicator here, suggesting that buying pressure is fading.

Smart Money Signals — Hyperliquid Leaderboard

Hyperliquid SHORT MERL leaderboard chartHyperliquid SHORT GMT leaderboard chart

High-conviction traders on Hyperliquid are currently leaning into short positions for several assets. A trader with a 647% 30-day ROI has opened a SHORT position in MERL at $0.0368 with a notional value of $1,441. Similarly, a trader with a 156% ROI is shorting GMT at $0.012.

The sentiment around TON is split. One top trader opened a LONG position at $2.3046 with $3,038 in notional value, while another, with a 782% ROI, entered a SHORT position at $2.1942. This divergence suggests that TON is currently a primary battleground for volatility.

What to watch next

The immediate focus is on the $80,000 psychological level for Bitcoin. If the double-top patterns mentioned in the technical analysis hold, we could see a rapid flush of long liquidations toward $75,000. However, the continued rollout of spot trading by firms like Charles Schwab provides a strong floor.

Keep a close eye on the Strait of Hormuz and the Russia-Ukraine border. Geopolitical shocks are the fastest way to kill a crypto rally, as they drive the S&P 500 down and force traders into cash. If the NASDAQ continues its slide, expect crypto to follow. Finally, watch the Ethereum gas fees. If they remain this low while JPMorgan launches its tokenized fund, it would suggest that institutional "on-chain" activity is happening in private silos rather than on the public mainnet.

Crypto Market Overview | Liquidity collapse & regulatory hope | May 12, 2026
Sigrid Voss·

Crypto Market Overview | Liquidity collapse & regulatory hope | May 12, 2026

Market overview

The crypto market is currently characterized by a sharp decline in activity and a cautious, neutral sentiment. While the total market cap sits at $2.77T, the most striking data point is the collapse in volume. Spot trading volume dropped by 19.31% to $88.05B, and stablecoin volume saw a similar plunge of 19.57%. This suggests a period of trader exhaustion or a strategic pause as participants wait for clearer macro signals.

Liquidity is tightening across the board. Derivatives volume fell 12.40% to $759.07B, and DeFi activity is notably muted, with 24h volume down 15.70%. The Fear and Greed Index remains neutral at 48, reflecting a market that is neither panic-selling nor aggressively buying. This stagnation is mirrored in traditional finance, where the S&P 500 and NASDAQ both closed in the red, with the NASDAQ falling 1.50%.

Bitcoin dominance is climbing, reaching 60.28% according to CoinMarketCap data. This upward creep in dominance, paired with an Altcoin Season Index of 39 to 47, confirms that the market remains in a Bitcoin Season. Capital is staying concentrated in the primary asset while altcoins struggle to maintain relative value.

Bitcoin and Ethereum

Bitcoin is trading at $80,461.05, down 0.47% over the last 24 hours. While the price remains high, the quality of the recent rally is under scrutiny. Analysis from Wintermute suggests the move above $80,000 looks more like a short squeeze than a healthy breakout. Open interest rose from $48 billion to $58 billion over the last month, but spot volumes are near two-year lows. This indicates that forced short covering, rather than new spot demand, drove the recent price action.

Ethereum has faced more pressure, dropping 1.94% to $2,268.8. Network activity is exceptionally low, with gas fees sitting between 0.51 and 0.91 Gwei. This lack of on-chain engagement suggests a lull in DeFi and NFT activity. Despite this, Ethereum remains a focal point of regulatory hope, as new legislative drafts could potentially exempt it from securities laws.

Top crypto prices

Bitcoin holds the top spot at $80,461.05 (-0.47%). Ethereum follows at $2,268.8 (-1.94%). XRP is trading at $1.42, showing a steeper decline of 2.93%. BNB remains relatively stable at $653.74 (-0.30%). Solana is priced at $94.47 (-0.61%), and TRON sits at $0.3479 (-0.88%). Hyperliquid is trading at $40.26, down 1.89%.

News driving today's market

Regulatory clarity in the United States is the primary bullish driver today. The Senate Banking Committee released the draft of the CLARITY Act, which contains provisions that could permanently exempt Bitcoin and Ethereum from securities laws. This is a major step toward institutional legitimacy. We previously covered the broader implications of Crypto Market Regulations and how the July 4 deadline is shaping the current environment.

Institutional adoption also continues to expand. Franklin Templeton is partnering with the parent company of Kraken to develop on-chain investment products, focusing on tokenized yield and blockchain-based funds. This trend toward bringing traditional assets on-chain is a theme we have explored before in our look at Tokenized Stocks Explained. Additionally, the DTCC is integrating Chainlink to build a blockchain-based collateral system, which could improve the efficiency of 24/7 automated collateral management.

On the bearish side, security concerns remain a drag on sentiment. CertiK reported that North Korean hackers stole $2.1 billion in 2025, accounting for 60% of all crypto losses. This "industrialized" theft is a reminder of the persistent risks in cross-chain networks. Aave is also dealing with a governance battle on Arbitrum to move $71 million in disputed exploit funds, adding a layer of uncertainty to the protocol. Conversely, Binance reported that its AI-powered security has blocked $10.5 billion in fraud since 2025, attempting to reassure users about exchange-level safety.

Social intelligence

On-chain data from @lookonchain reveals a divergence in ETF flows. While Bitcoin and Ethereum ETFs saw slight net outflows over the last 24 hours, Solana ETFs showed strong momentum with a 1D net flow of +259,129 SOL, worth approximately $24.62 million. This suggests a rotation of institutional interest toward Solana.

Macro sentiment is being influenced by geopolitical and fiscal shifts. @DeItaone noted that the scrapping of a planned NYC property tax hike could reduce the burden on wealthy individuals, which often correlates with an increased appetite for risk assets like crypto. Meanwhile, Michael Saylor continues to push the narrative of Bitcoin as "digital capital" in response to Ray Dalio, arguing that it is the superior global collateral compared to the "analog capital" of gold.

Trading ideas worth watching

Ethereum is currently forming a wedge pattern on the 4H timeframe. Analysis by KlejdiCuni suggests that ETH is in a corrective consolidation phase following a strong rally. If buyers can reclaim momentum above local resistance, the setup points toward a bullish expansion. Targets are set at $2,413, $2,500, and eventually $2,600. This is a classic volatility compression play where the price is squeezed before a breakout.

Redrawn ETHUSDT 240 trading idea chart for Ethereum Consolidates Before Potential Expansion Toward $2,600

For those looking at altcoins, Curve (CRV) is showing signs of a long-term bottom process. MasterAnanda notes that CRV has closed green for four consecutive weeks, a rarity during its previous long-term downtrend. The chart suggests a double-bottom formation mirroring late 2024. The primary target is the previous range high and the 0.148 Fibonacci extension level. This setup assumes that CRV is recovering in tandem with a broader market-wide bullish shift.

A more psychological approach to the current market is highlighted by TheSignalyst on BTCUSDT. The analysis warns against the word "maybe" in trading. In a consolidating market like today's, traders often move stops or increase risk based on hope rather than levels. The recommendation is to stick to a rigid structure: clear entry, stop, and invalidation points to avoid emotional trading during this low-volume period.

Redrawn BTCUSDT 240 trading idea chart for The Most Expensive Word in Trading: “Maybe”

Smart Money Signals — Hyperliquid Leaderboard

Hyperliquid SHORT CHILLGUY leaderboard chartHyperliquid SHORT SAGA leaderboard chart

High-confidence traders on Hyperliquid are currently positioning for downside moves in several mid-cap assets. A trader with a 542% 30-day ROI has opened a short position on CHILLGUY at $0.0191 with a notional value of $2,250.

SAGA is also a primary target for shorts. Two separate top-tier traders have entered sell positions; one at $0.0344 and another at $0.0309. This suggests a consensus among leaderboard traders that SAGA is overextended or facing strong resistance.

Additionally, a trader with an all-time PnL of $240.5K has opened a short on ONDO at $0.4373. The prevalence of short positions among these high-ROI accounts indicates a bearish outlook for these specific tokens, even as the broader market remains neutral.

What to watch next

The immediate focus for the market is the upcoming CPI release and the transition of the Fed chair. These macro catalysts will likely determine if the current low-volume consolidation breaks to the upside or triggers a deeper correction.

Traders should keep a close eye on Bitcoin dominance. If BTC continues to climb toward 61%, altcoins will likely remain suppressed regardless of positive news. However, the strong inflows into Solana ETFs could provide the spark needed to shift the market away from a pure Bitcoin Season. Finally, the formal vote on the CLARITY Act this Thursday will be the most significant regulatory event of the week, with the potential to fundamentally change the legal status of the two largest assets in the space.

Crypto Market Overview | High volume, neutral sentiment | May 11, 2026
Sigrid Voss·

Crypto Market Overview | High volume, neutral sentiment | May 11, 2026

Market overview

The crypto market is currently exhibiting a strange disconnect between activity and price action. While the total market cap sits at $2.79T with a marginal 24h increase of 0.26%, trading volume has exploded. Spot volume rose nearly 80%, and derivatives volume surged over 88% to reach $789.42B. This massive spike in churning without a corresponding price breakout suggests that traders are hedging positions or engaging in high-frequency scalp trading rather than bringing in fresh, aggressive capital.

Sentiment remains dead center with a Fear & Greed Index of 50. This neutrality is reflected in the Altcoin Season Index, which sits at 45, meaning neither Bitcoin nor altcoins are currently dominating the trend. The market is in a transition phase. With BTC dominance pinned around 60%, the flight to quality is still the primary structural theme. Stablecoin dominance is at 9.60%, indicating a decent amount of liquidity is sitting on the sidelines, waiting for a clearer directional trigger.

Bitcoin and Ethereum

Bitcoin is trading at $76,504.74, up 0.79% over the last 24 hours. The asset briefly touched $82,000 earlier today, though it failed to hold those levels. This volatility is likely tied to improving macro conditions and steady institutional appetite. Morgan Stanley's bitcoin ETF absorbed $194 million in its first month without seeing net daily outflows, which shows that institutional demand is becoming more consistent.

Ethereum is less active, priced at $2,261.81 with a slight 0.15% gain. The network state is remarkably quiet, with gas fees sitting between 0.45 and 1.03 Gwei. This low on-chain congestion suggests a lack of immediate catalyst for ETH and a general absence of the "degens" who usually drive network activity during a rally. Ethereum dominance is holding at 10.10%, keeping it in a stable but stagnant position relative to the broader market.

Top crypto prices

Bitcoin leads the market at $76,504.74. Ethereum follows at $2,261.81. XRP is priced at $1.37, down 0.21%. BNB is at $616.14, also down 0.21%. Solana sits at $83.25, down 0.06%. TRON showed some strength, rising 1.21% to $0.3270. Hyperliquid remains flat at $39.86.

News driving today's market

Institutional confidence is the main bullish driver. CoinShares reported that global crypto funds logged $858M in inflows for the sixth straight positive week. Much of this is tied to progress on the Clarity Act, which is improving the regulatory outlook for U.S. investors. This institutional trend is a shift away from the speculative volatility we saw in previous years. We previously covered how Tokenized Stocks Explained the move toward real-world assets is accelerating, and these fund inflows are a natural extension of that trend.

Regulatory wins are also appearing in the Middle East. Crypto.com received a Stored Value Facilities license from the UAE central bank. This allows Dubai residents to pay government fees using cryptocurrencies. This is a tangible use case for digital assets and increases the legitimacy of exchanges operating in the region.

However, there are bearish headwinds coming from Australia. The government is proposing changes to capital gains tax that would replace the 50% discount for assets held over a year. This could lead to a liquidity drop as Australian investors reassess their long-term holding strategies. On the technical side, the market is seeing a massive divergence between spot and derivatives volume. This is a pattern we've seen before; we previously discussed a Derivatives Volume Crash Signal where leverage shifts can signal a change in market health. Today, the extreme skew toward derivatives suggests the current price stability is being maintained by hedgers rather than spot buyers.

Social intelligence

Geopolitical tension is dominating the social feed. Reports of President Trump's upcoming arrival in Beijing on Wednesday evening are creating anticipation for new trade or regulatory discussions. Simultaneously, rhetoric regarding Iran is heating up. Tweets from @DeItaone highlight aggressive stances from the U.S. administration toward Iran, which typically triggers a risk-off environment. When geopolitical instability rises, traders often flee to Bitcoin as a safe haven, but it can also cause a general liquidation of riskier altcoins.

On the infrastructure side, @WuBlockchain is reporting that Digital Asset, the firm behind the Canton Network, is seeking a funding round at a $2 billion valuation led by a16z crypto. This is a strong signal that venture capital is still heavily betting on enterprise-grade blockchain infrastructure, even while the retail market remains neutral.

Trading ideas worth watching

There is a neutral setup for BTCUSDT on the weekly timeframe. Analysis suggests that two Exponential Moving Averages (EMAs) are acting as the primary decision points for the next trend. The immediate resistance level to watch is $82,483, with a secondary key level at $85,815. A rejection at these zones could shift the market structure from bullish to neutral or bearish. Patience is required here as the market tests these historical reversal zones.

Redrawn ASTERUSDT 1D trading idea chart for ASTER .. What Next ?Redrawn BTCUSDT 1W trading idea chart for #BTC/USDT Urgent Update! FOMO ends with Pain!

For those looking at altcoins, ASTERUSDT is showing a bullish accumulation pattern on the daily chart. The price has shifted from a downtrend into a range. A legitimate breakout above this range could lead to a significant move higher. The ideal entry is after a confirmed break and retest of the range ceiling.

Another bullish perspective on BTCUSDT suggests a path toward $100,000. This view posits that as Bitcoin clears $80,000, it will trigger a broader altcoin rally. We are already seeing momentum in projects like Sui, which is benefiting from staking events and protocol updates. Other assets like Cardano and XRP are also showing signs of breaking bullishly, suggesting that a Bitcoin rally will act as a tide that lifts the rest of the market.

Smart Money Signals — Hyperliquid Leaderboard

Hyperliquid SHORT STBL leaderboard chart

On the Hyperliquid leaderboard, a high-confidence trader (674% 30-day ROI) has opened a short position in STBL/USDC at an entry price of $0.0393. The notional value of the trade is $4,469.04. This move suggests that "smart money" is betting on a price decline for the STBL token, potentially anticipating a correction or a loss in stability for the asset.

Altcoin Spotlight

Sui is the standout performer today. The token has seen significant spikes, with some reports indicating a 25% to 50% jump. This move is driven by a combination of a massive staking event where Sui Group Holdings staked 108.7 million SUI and announcements from Mysten Labs co-founder Adeniyi Abiodun. The plan to introduce zero-fee stablecoin transfers and private transactions on the Sui network has created a surge of interest. This is a rare example of fundamental protocol news driving a sharp, vertical price move in a neutral market.

What to watch next

The immediate focus is on the $82,000 level for Bitcoin. If the asset can flip this resistance into support, the path to $90,000 becomes much clearer. However, the massive volume in derivatives without price movement is a warning sign. It suggests a high-leverage environment where a small move in either direction could trigger a liquidation cascade.

Keep an eye on the geopolitical developments in Beijing and the Middle East. These macro events often override technical analysis. Additionally, the Australian tax proposal could create a ripple effect of selling pressure from that region. If the market remains neutral and BTC dominance stays at 60%, expect altcoins to continue their choppy, fragmented movement until a definitive trend emerges.