Market Overviews

Daily crypto market overviews, trend analysis, and key updates from our editorial team.

Crypto Market Overview | Institutional adoption contrasts with low altcoin utility and high derivatives betting volume | August 5, 2026
Sigrid Voss·

Crypto Market Overview | Institutional adoption contrasts with low altcoin utility and high derivatives betting volume | August 5, 2026

Market overview

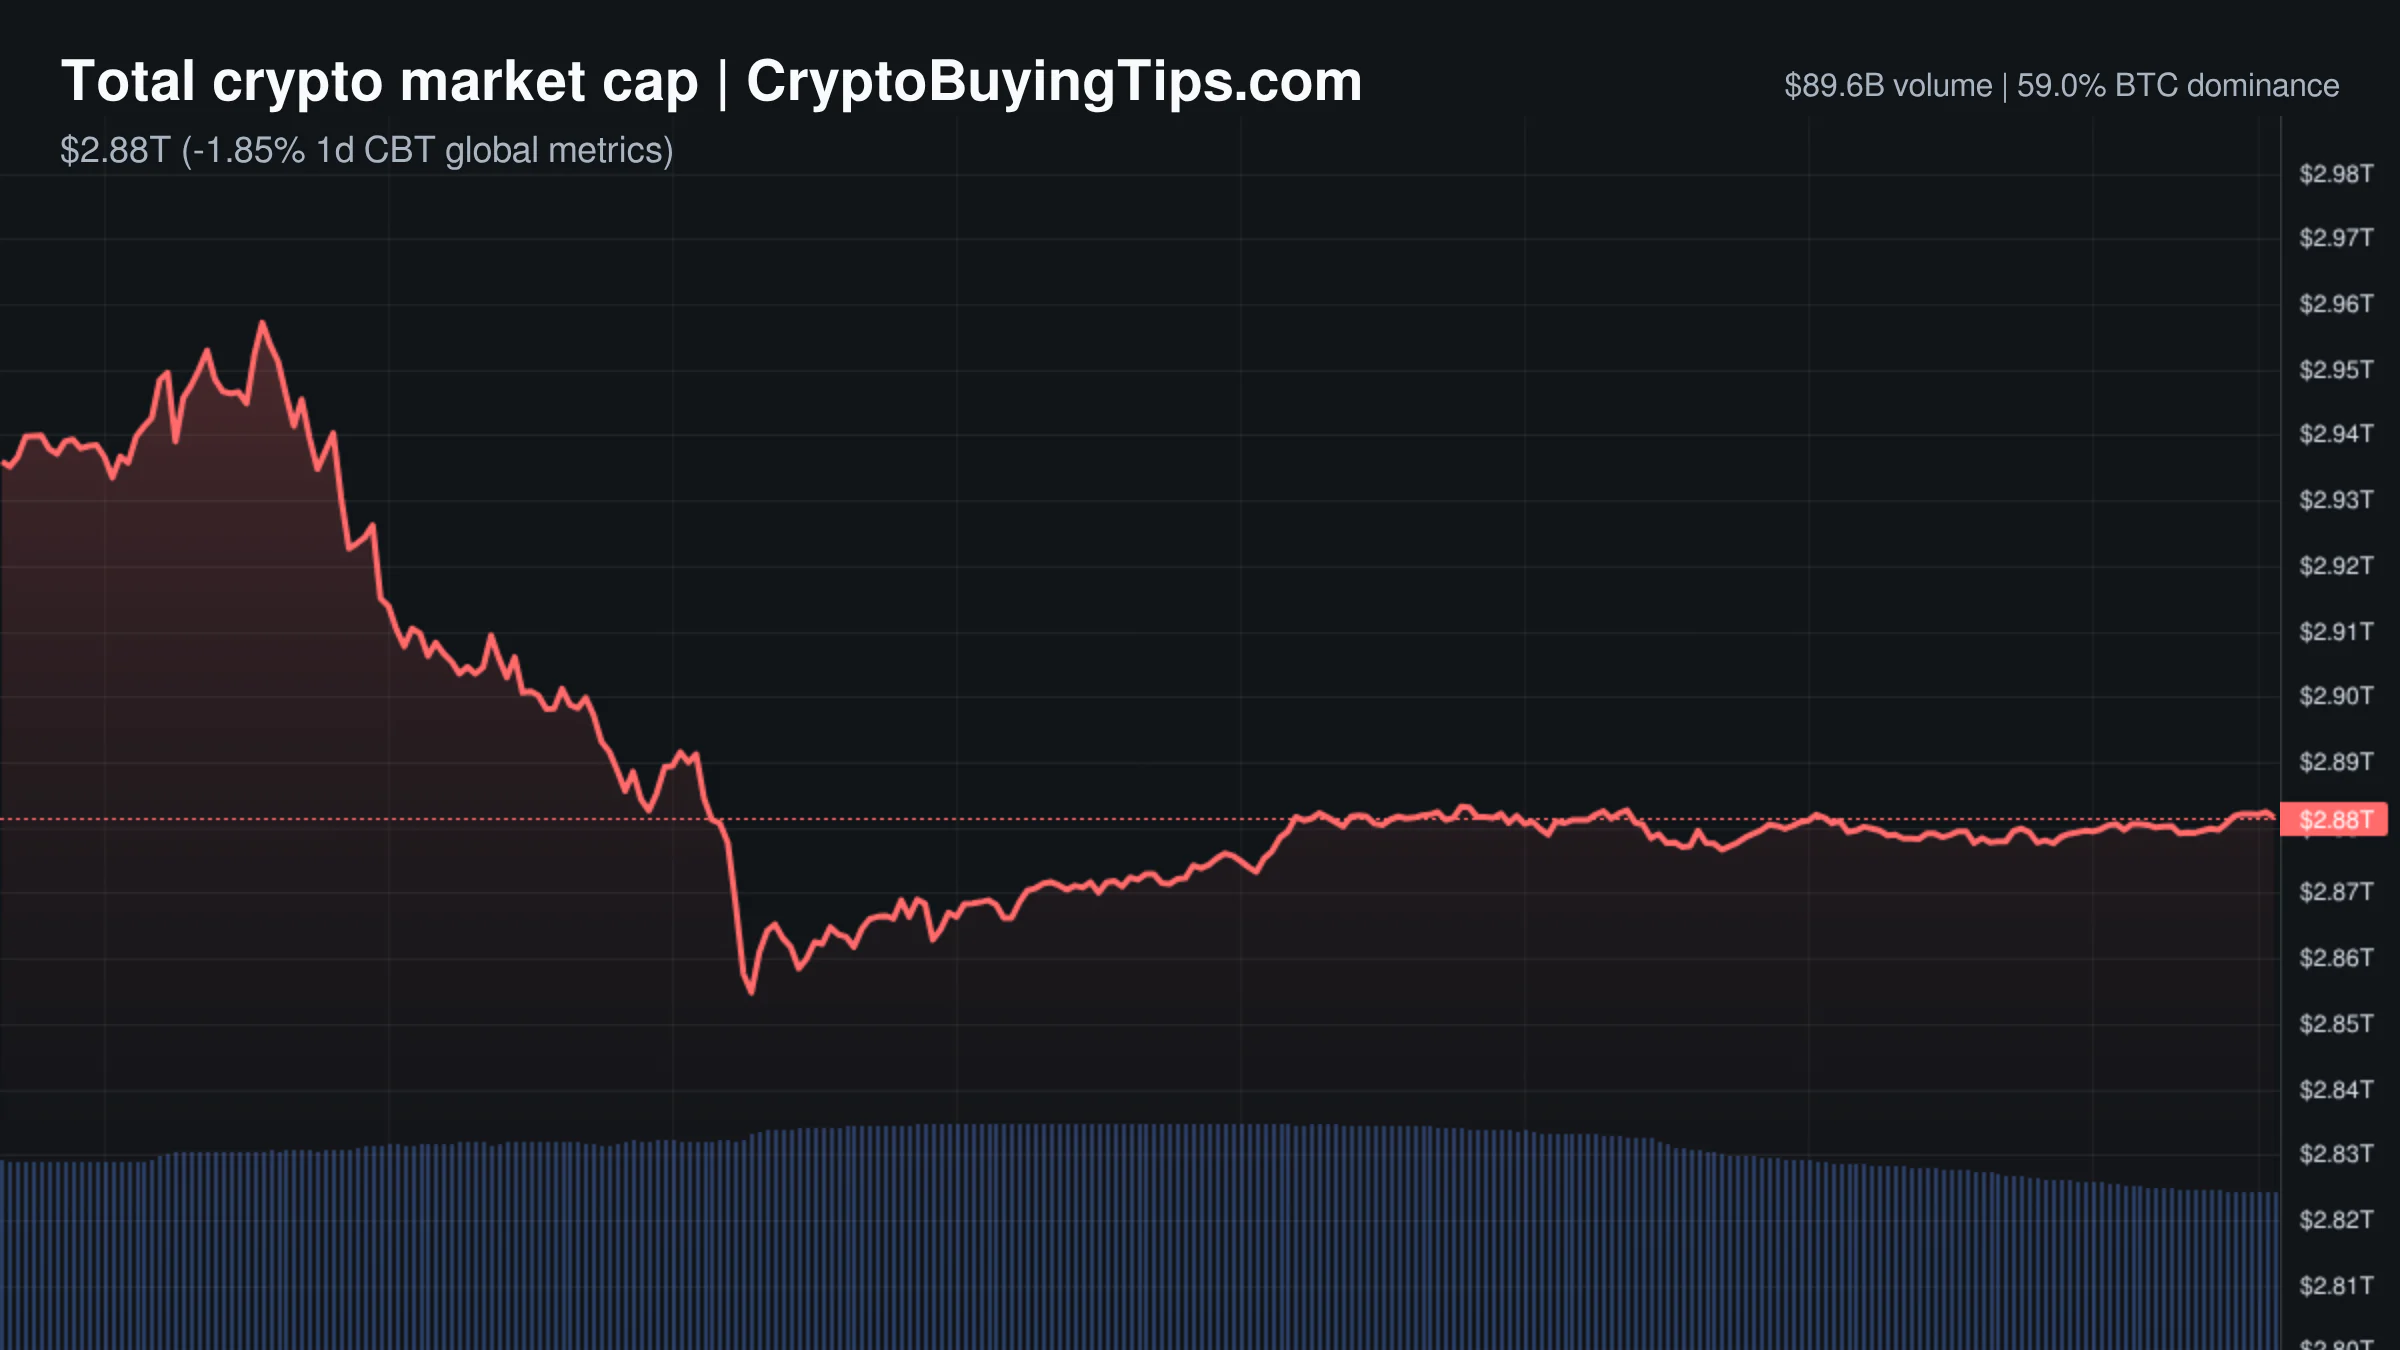
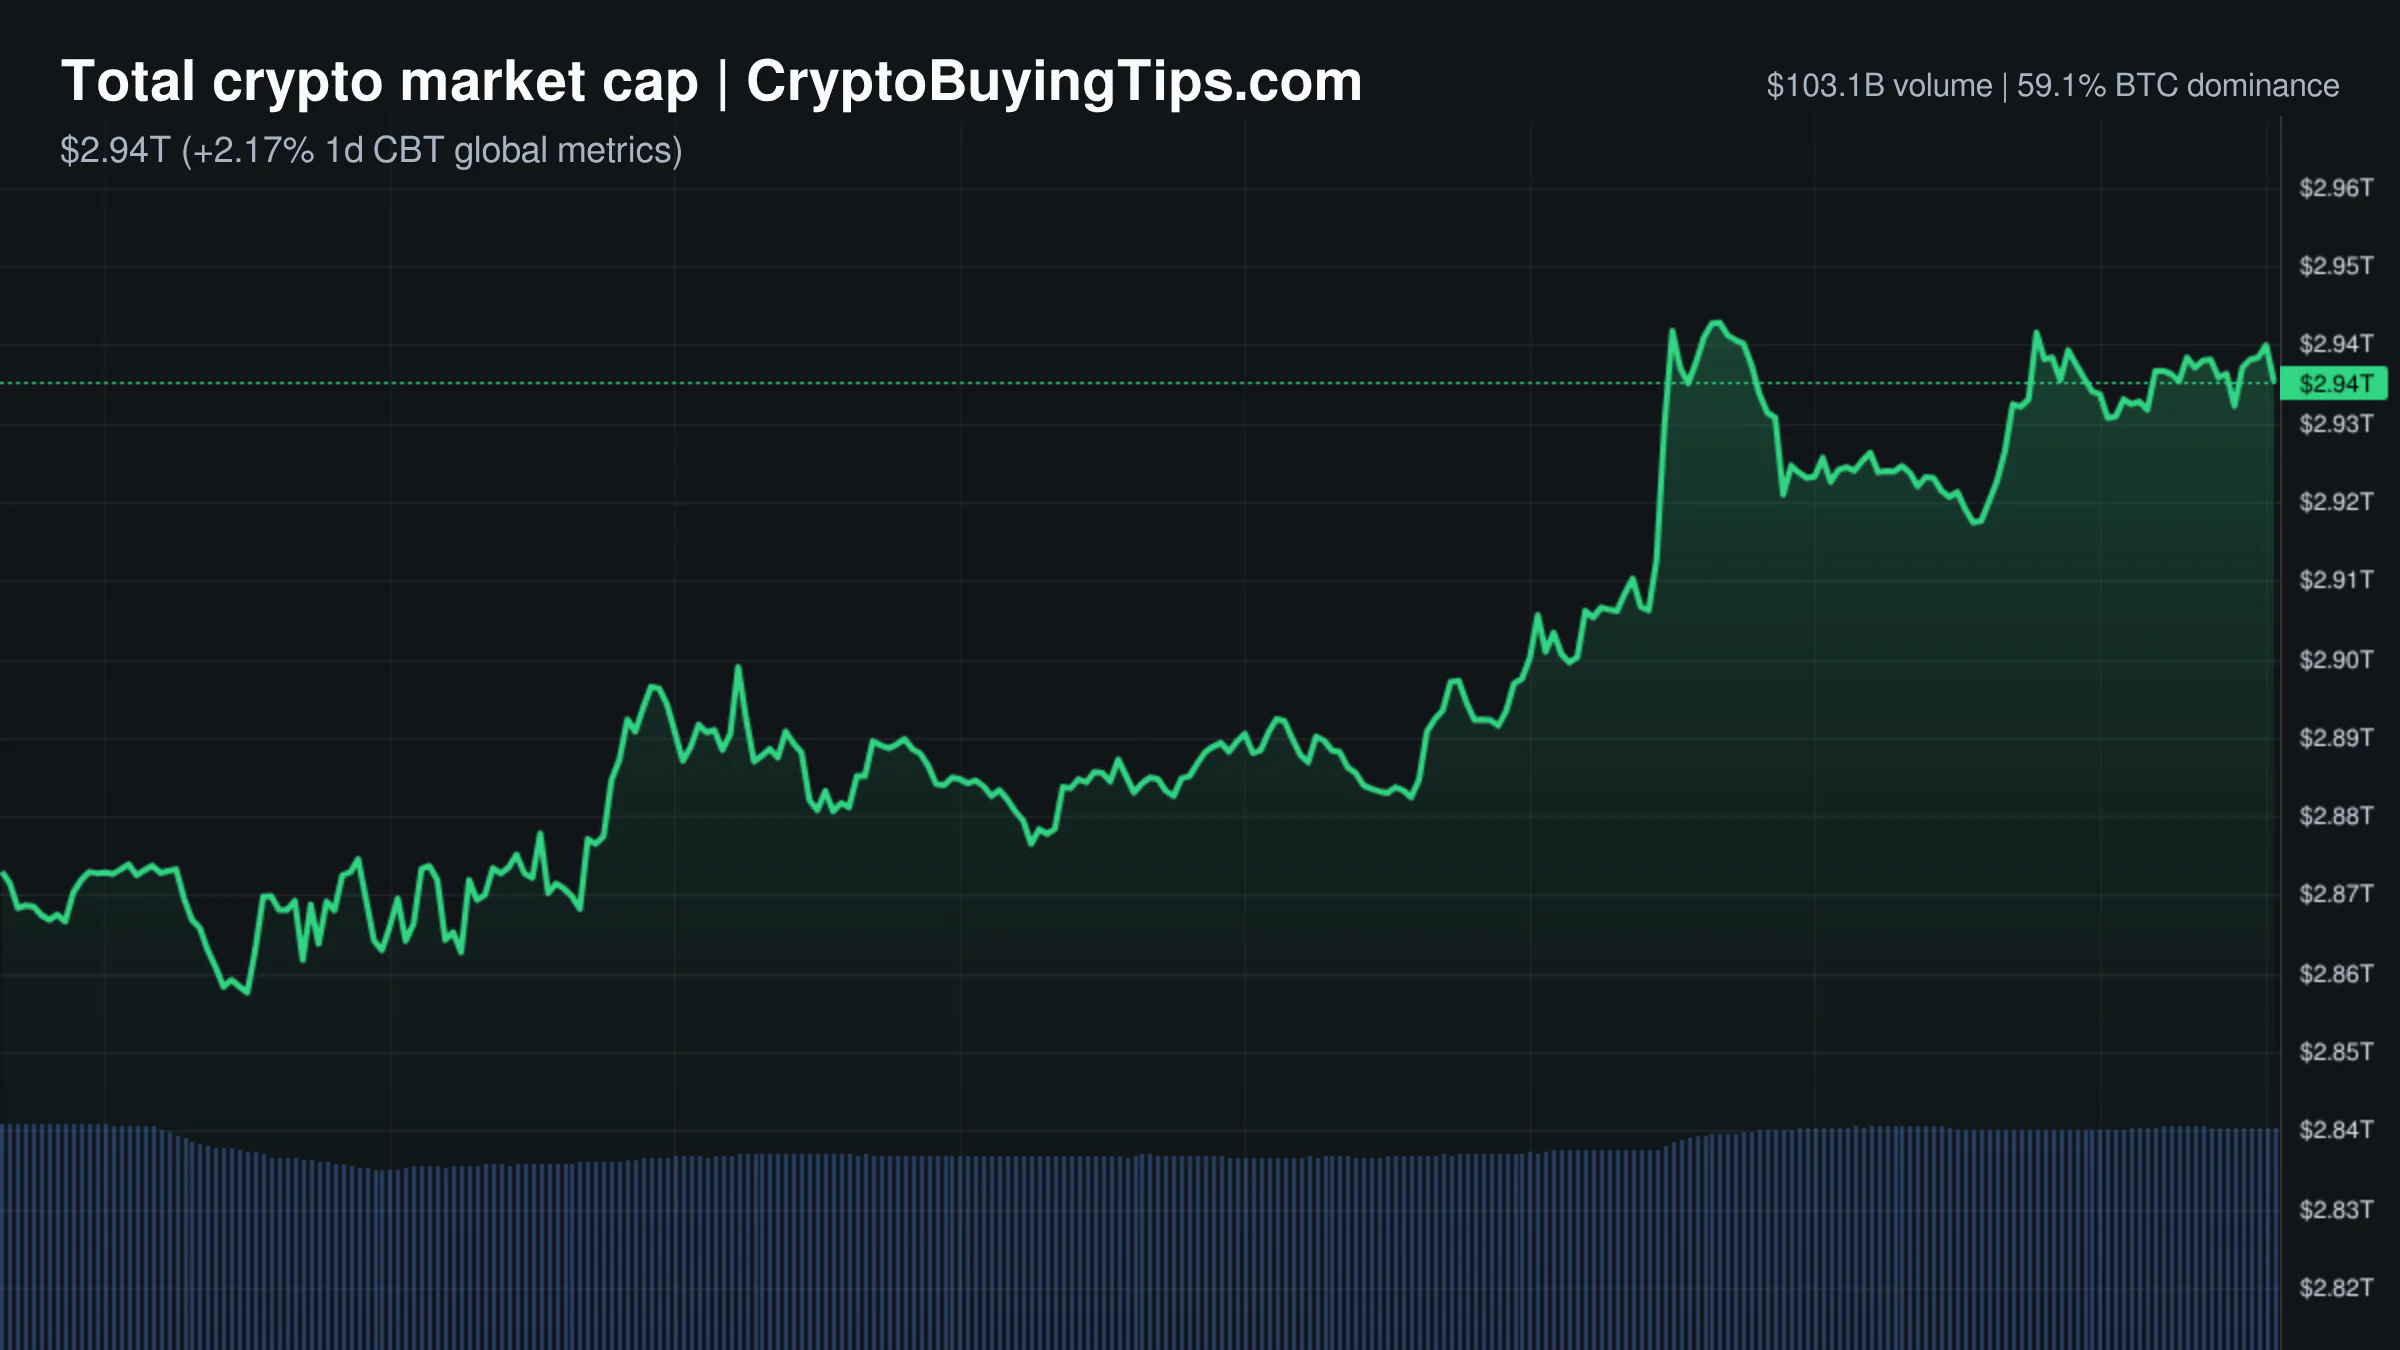
The market is currently presenting a curious contradiction. While the Fear and Greed Index sits at 38, suggesting a pervasive sense of anxiety among retail participants, the total market capitalization has edged up to $2.27 trillion. It is the classic crypto dichotomy: the crowd is terrified, but the numbers are marginally positive. We see a total market cap change of 0.33 percent, which is essentially a flatline, yet the underlying activity is skewed heavily toward speculation.

The most telling metric is the activity ratio. Derivatives volume is currently $585.51 billion, which is approximately 10.5 times higher than the $55.47 billion in spot volume. This suggests the current price action is not being driven by organic accumulation but by high-leverage bets. When derivatives volume expands while spot volume contracts, we are no longer looking at a market of buyers and sellers. We are looking at a giant casino where the bets are far larger than the actual chips on the table.

This internal fragility is contrasted by a stark divergence with traditional markets. The S&P 500 and NASDAQ are ripping higher, up 1.80 percent and 3.40 percent respectively. Usually, this risk-on appetite in equities spills over into crypto. Today, that bridge is narrow. Bitcoin dominance remains high at 56.52 percent, which confirms that capital is not rotating into altcoins. Instead, it is huddling in the largest asset for safety. The Altcoin Season Index at 20 indicates we are firmly in a Bitcoin season. Money is not flowing into the periphery; it is retreating to the center.

Bitcoin and Ethereum

Bitcoin is currently trading at $63,996.98. It remains the sole anchor for the market, maintaining a dominant grip on liquidity. The price action is stagnant, but the institutional narrative is attempting to provide a floor. We are seeing a push from the traditional side, with JP Morgan raising its target price to $240 for certain indices, which suggests that the "smart money" is looking past the current retail fear. However, the lack of spot volume suggests that these targets are theoretical until a real catalyst forces a breakout.

Ethereum is in a more complicated position. Trading at $1,865.79, it is the primary beneficiary of the tokenization trend, yet its network metrics are ghostly. Gas fees are currently between 0.09 and 0.12 Gwei. This is an incredibly low level of activity for a network that is supposedly the foundation for the future of global finance.

There is a widening gap between the PR and the plumbing. While BlackRock and JP Morgan use the network to tokenize hundreds of billions in funds, the actual on-chain utility for the average user has vanished. We previously covered how Ethereum market share vanishes while it undergoes a corporate makeover. The data today reinforces that read. The network is becoming a high-end settlement layer for institutions, but it is losing its identity as a vibrant ecosystem for retail DeFi.

Top crypto prices

The price action across the top assets is mostly sideways, with a few notable exceptions. Bitcoin is holding near $64,000, while Ethereum remains flat at $1,865.79. BNB has shown some strength, climbing 1.21 percent to $596.57.

On the downside, XRP has dipped 1.18 percent to $1.06. This move comes as realized volatility on Binance hits a three-month low, suggesting the asset is entering a period of stagnation. Solana is slightly up at $73.86, and TRON is nearly flat at $0.3281.

The standout performer is Hyperliquid, which has jumped 3.88 percent to $57.26. This gain is particularly interesting given the general apathy toward altcoins today.

News driving today's market

The dominant theme is the aggressive move by Wall Street to tokenize everything that isn't nailed down. BlackRock has tokenized $311 billion of European money market funds using JP Morgan's Kinexys platform on Ethereum. Simultaneously, Wells Fargo is preparing to launch tokenized deposits this fall for corporate clients. BNY is also moving into the space by adding crypto staking to its custody platform via a partnership with Galaxy.

This is a structural shift. We are seeing the "reverse bridge" in action, where traditional finance is not just buying crypto assets but adopting the underlying technology to fix their own inefficient settlement rails. We previously discussed how crypto exchanges reverse bridge the flow of capital. This institutional adoption is a long-term bullish signal, but it does not necessarily help retail prices in the short term. These tokenized assets are often "centralized receipts wearing blockchain paint," and they do not always create the same demand for the underlying token that a retail mania does.

On the regulatory front, the EU's MiCA list continues to expand, adding 12 more companies. This provides a clearer path for institutional entry in Europe. However, Taiwan is introducing a Travel Rule for domestic transfers in October. This adds a layer of compliance friction that usually dampens speculative fervor.

Finally, we have the "AI bubble" narrative. Arthur Hayes is suggesting that overleveraged AI spending will eventually crack, forcing governments to print money to bail out the sector. In his view, this would be the ultimate catalyst for Bitcoin to hit $1 million. It is a bold claim, but it aligns with the historical pattern of crypto acting as a hedge against monetary debasement.

Social intelligence

The social data reveals a hidden tension. On one hand, we have a massive contraction in stablecoin liquidity. USDT has seen its market cap fall by $4 billion over the last 60 days. This is nearing its sharpest contraction on record. When the primary stablecoin shrinks, it usually means capital is leaving the ecosystem or moving into other assets. It is a bearish signal that contradicts the slight price gains we are seeing.

On the other hand, geopolitical noise is creating a potential "risk-on" spark. Reports indicate that a deal to reopen the Strait of Hormuz could be days away, with the US and Iran progressing in talks. If this geopolitical chokepoint clears, the global risk appetite should improve. This would likely benefit the broader market, as it removes a significant layer of macro uncertainty.

Trading ideas worth watching

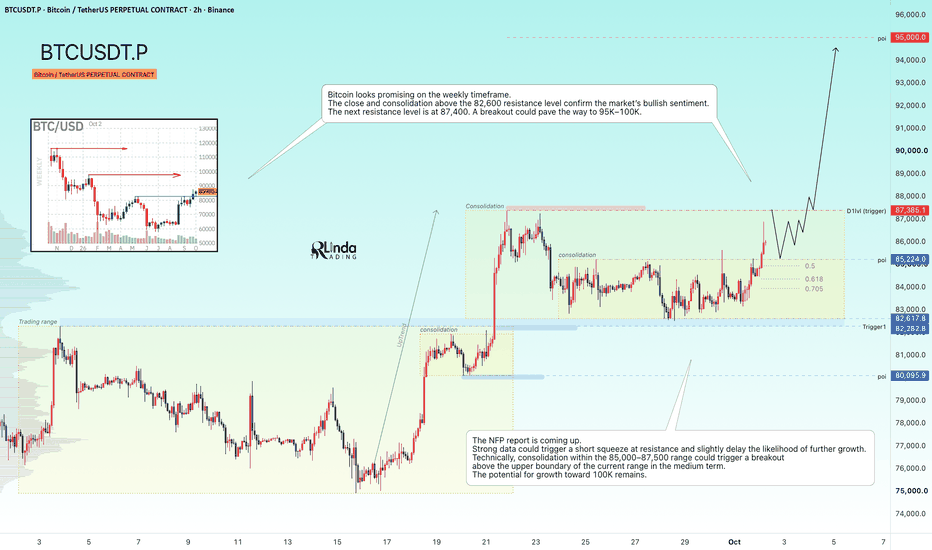
The Bitcoin setup is currently focused on the 64.6k level. Price has reacted well to a demand zone, and buyers are stepping in after a retest. As long as the price holds above the 100 SMA and the previous engulfed level acts as support, the path to $64,600 is open. However, if the demand zone fails, the momentum shifts back to the sellers quickly.

Redrawn BTCUSDT 30 trading idea chart for BTCUSDT Holding Demand, 64.6K in Focus

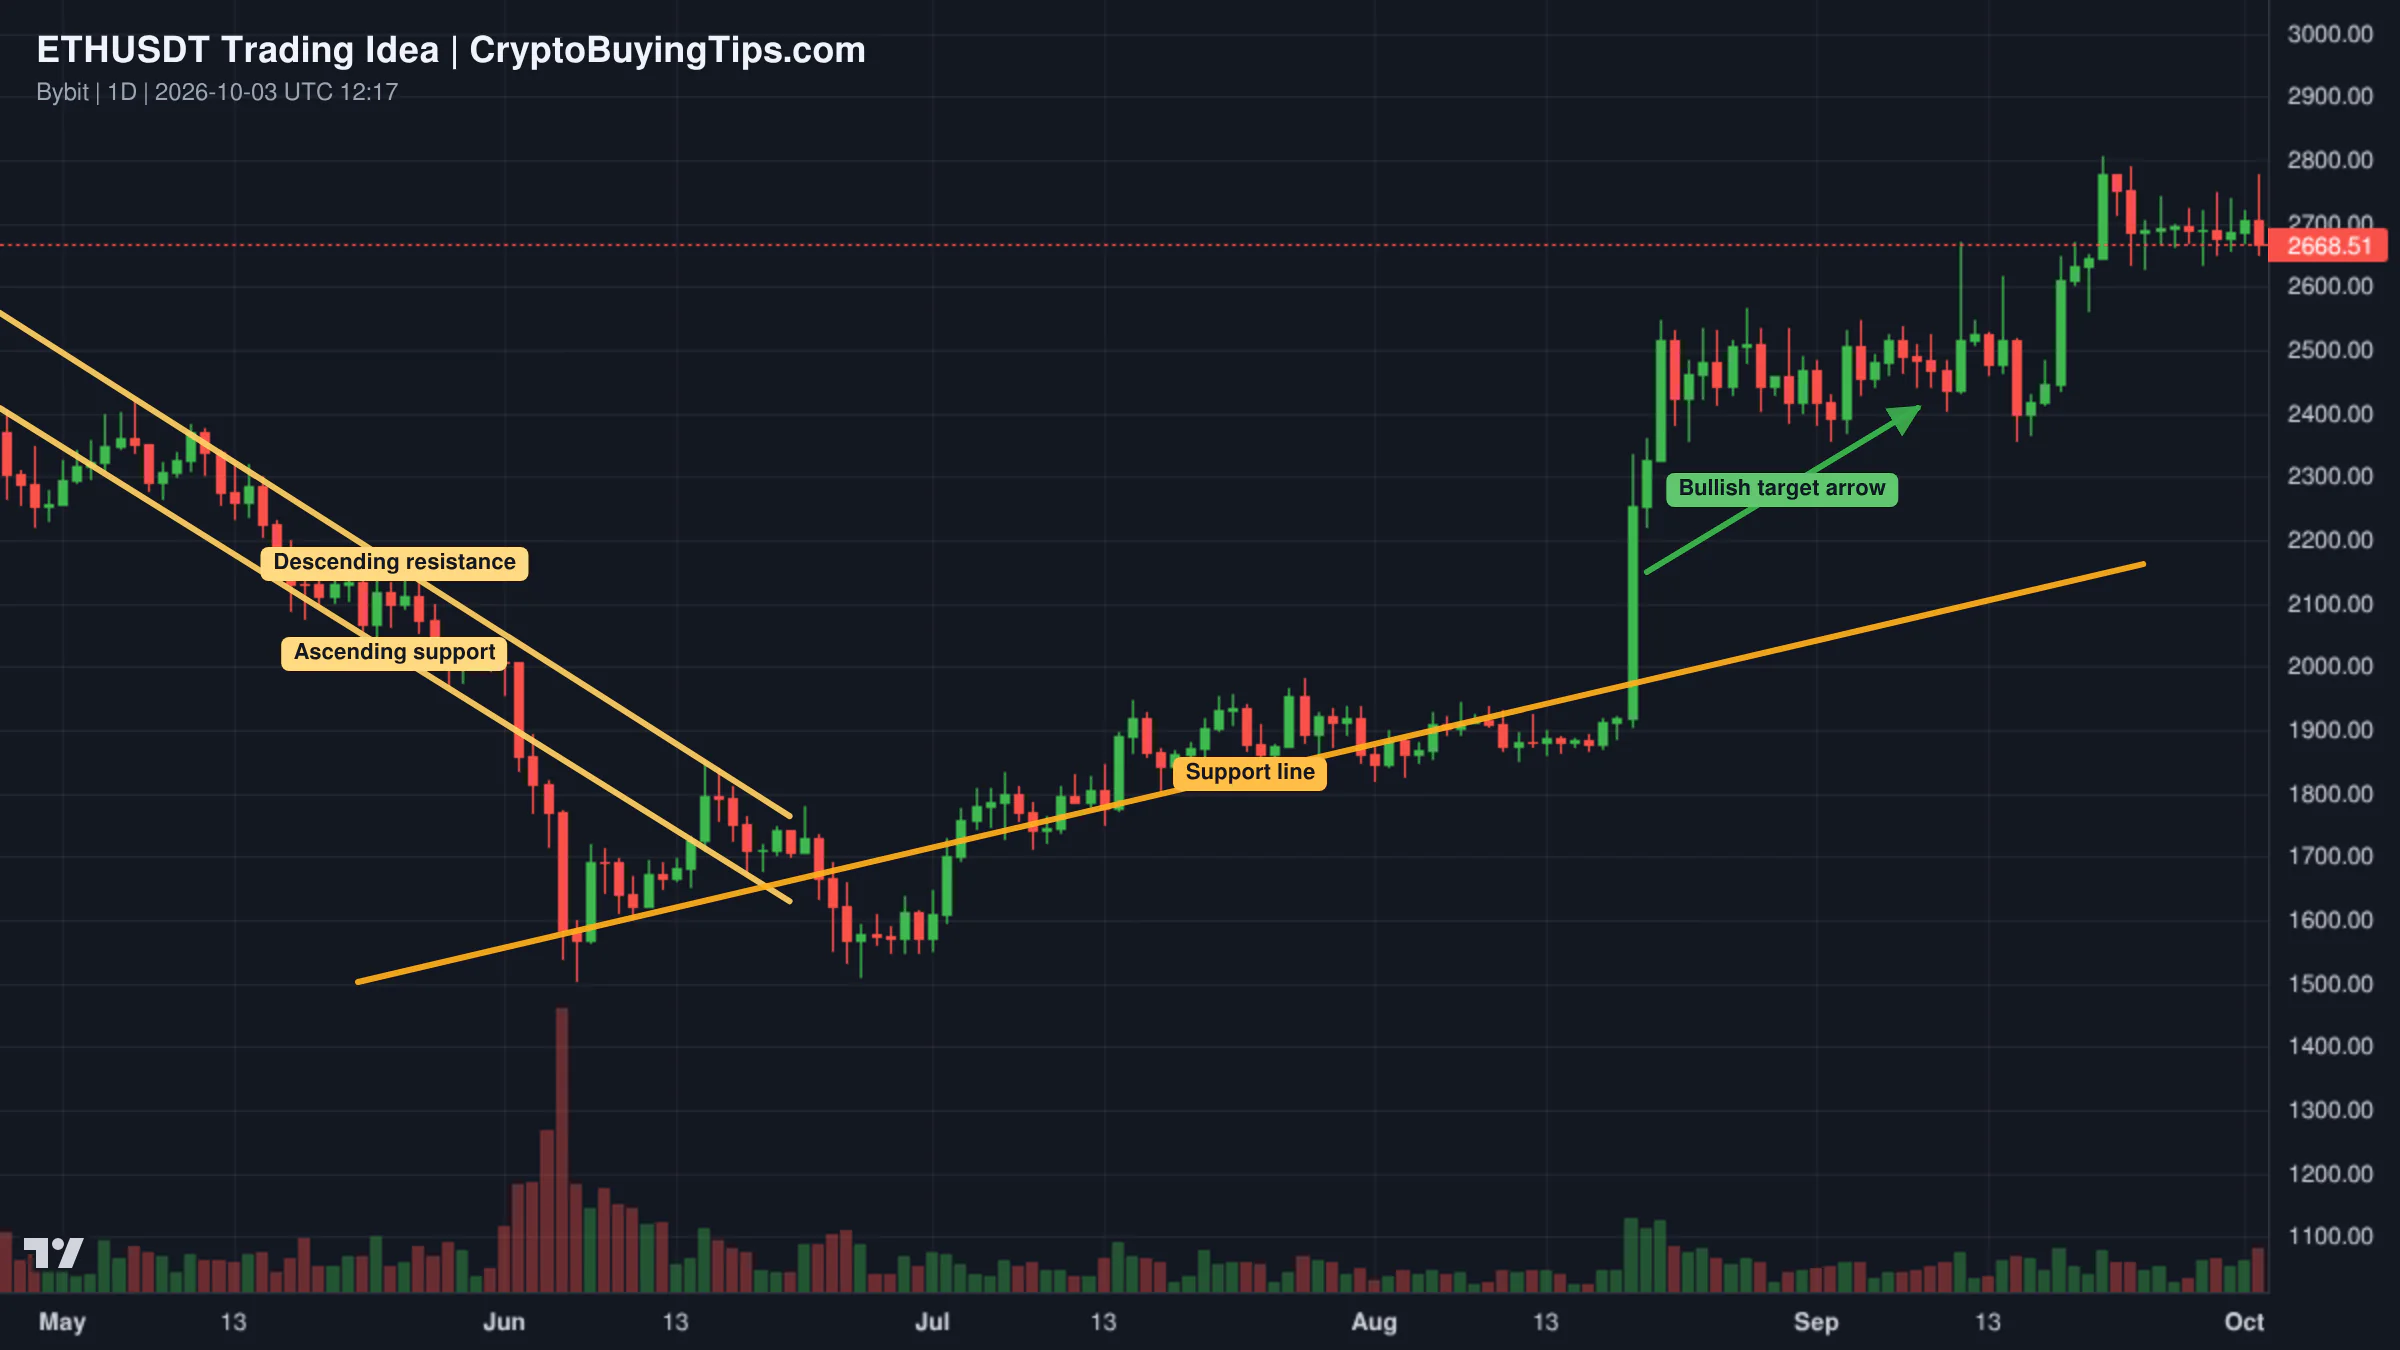
For Ethereum, there is a bullish triangle breakout play on the 2-hour chart. The price is bouncing off support near $1,872.62. The target is a multi-wave expansion toward $1,960. The strategy involves an initial rally to $1,900, a pullback to $1,890, and then a final surge. A close below $1,845 on the 2-hour timeframe would invalidate this setup.

Cardano is showing a long-term recovery pattern. Despite a local double-top that could signal a short-term retrace, the broader trend since June has been upward. The current read is that any dip is a normal fluctuation within a larger bull market. This is a higher-risk play given the general altcoin weakness, but the chart supports a long-term hold.

Redrawn ADAUSDT 1D trading idea chart for Cardano (ADA): 10X, Additional Growth, Cryptocurrency Trading &

Altcoin Spotlight

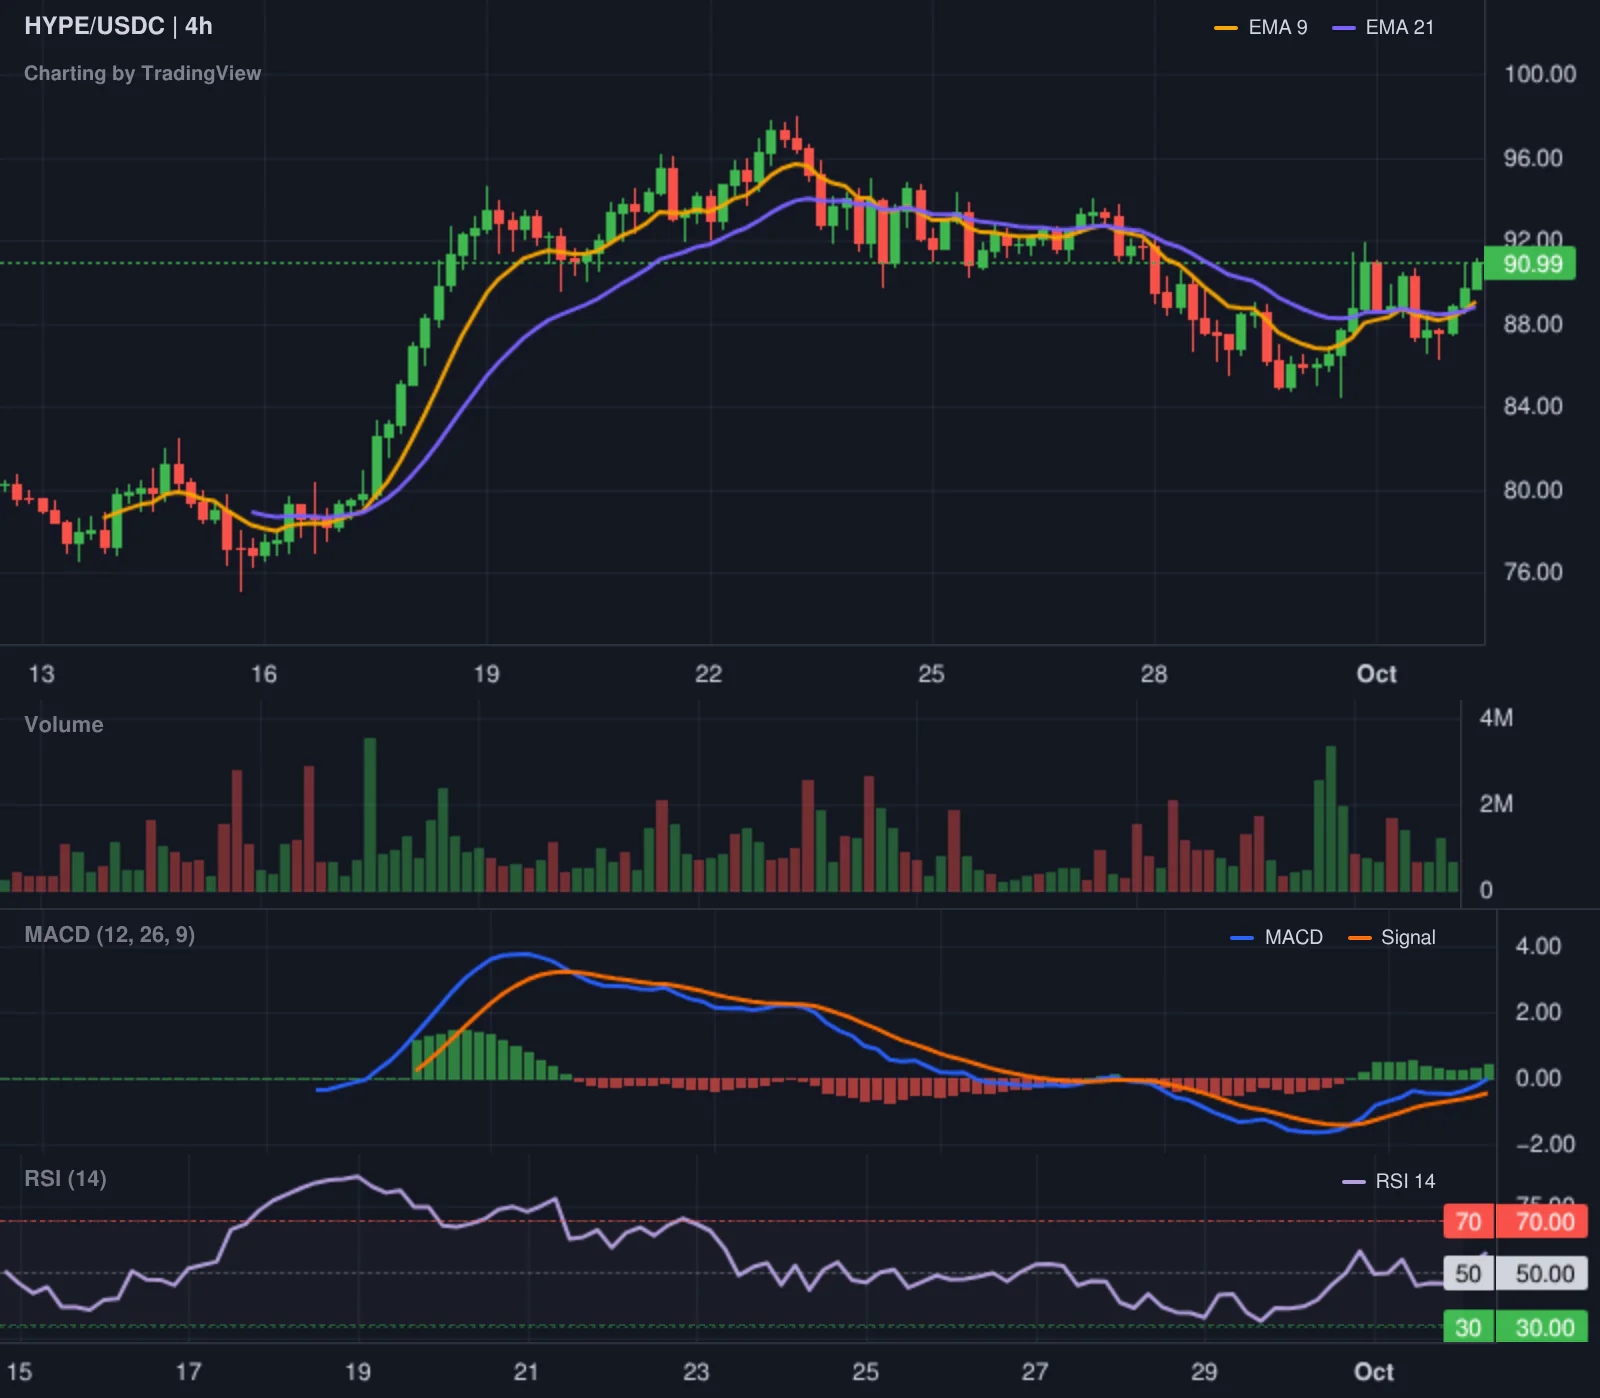
Hyperliquid deserves attention today. While the rest of the altcoin market is essentially asleep, HYPE has managed a nearly 4 percent gain. This is significant because HYPE is not just another token; it is the native asset of a platform that is currently benefiting from the massive derivatives volume we see across the market.

As the activity ratio of derivatives to spot continues to climb, platforms that can efficiently handle that leverage become the real winners. HYPE is essentially a bet on the "casino" aspect of the current market. While we generally dislike high-leverage environments, the data shows that the liquidity is moving there. HYPE is capturing that flow.

What to watch next

The immediate focus is the tension between institutional plumbing and retail sentiment. We have a market where the world's largest asset managers are tokenizing hundreds of billions of dollars, yet the average trader is in a state of "Fear." This suggests that the next leg of the bull market will not be driven by a retail frenzy, but by the slow, grinding absorption of assets into institutional portfolios.

We need to watch the USDT market cap closely. If the contraction continues, the lack of liquidity will make the market more volatile and prone to sharp drops, regardless of how many funds BlackRock tokenizes. Additionally, the potential Hormuz deal could be the catalyst that finally moves the Fear and Greed index back into the neutral or greedy zones. Until then, the market is a high-leverage game of waiting.

Crypto Market Overview | institutional tokenization drives capital flow despite fear sentiment | August 4, 2026
Sigrid Voss·

Crypto Market Overview | institutional tokenization drives capital flow despite fear sentiment | August 4, 2026

Market overview

The crypto market is currently operating in a state of strange contradiction. While the total market cap sits at $2.26T with a modest 24 hour increase of 1.21%, the sentiment remains firmly rooted in fear. The Fear and Greed Index is at 36, which suggests a level of anxiety that is not reflected in the actual price action. We see the CMC20 and CMC100 indices both climbing over 1.4%, yet the collective mood is one of deep suspicion. This gap between price and sentiment is often where the most interesting opportunities live, as retail traders typically wait for "extreme greed" before buying, while the indices climb in spite of them.

Liquidity is heavily skewed toward the derivatives market. With a 24 hour derivatives volume of $580.71B compared to a spot volume of $56.23B, the ratio is roughly 10.3 to 1. This is a high leverage environment. It means the current price stability is built on a foundation of bets rather than raw accumulation. When derivatives volume dwarfs spot activity to this extent, any sudden move in the wrong direction can trigger a cascade of liquidations. The market is essentially a coiled spring, held in place by high open interest in perpetuals, which currently stands at $386.88B.

Bitcoin dominance continues to climb, reaching 58.64%. This confirms that we are in a Bitcoin season, with the Altcoin Season Index sitting at a neutral 44. Capital is not rotating into smaller assets yet. Instead, it is concentrating in the largest cap assets, which is a typical flight-to-safety move during periods of geopolitical instability. The stablecoin dominance of 11.26% suggests a decent amount of capital is still sitting on the sidelines, waiting for a clearer signal before deploying into riskier altcoins.

Bitcoin and Ethereum

Bitcoin is trading at $63,681.17, up 1.82% over the last day. While the price is ticking higher, the underlying demand from U.S. investors remains stubbornly weak. The Coinbase Premium has been negative for 77 consecutive days. This is a rare and telling metric. It indicates that Bitcoin is being bought more aggressively on offshore exchanges than on Coinbase, which usually serves as the primary gateway for American institutional and retail capital. The price is rising, but the "smart money" in the U.S. is not the one driving the bus.

Ethereum is priced at $1,866.31, showing a 1.32% gain. Its dominance has slipped to 10.33%, a trend that has been consistent for months. The most striking data point for Ethereum today is the network activity. Gas fees are incredibly low, ranging between 0.14 and 0.23 Gwei. This means the network is practically a ghost town. It is a bit ironic that the price is climbing while the actual utility and on-chain stress are almost non-existent. The market is pricing in future institutional adoption rather than current network usage.

Top crypto prices

Bitcoin leads the pack at $63,681.17, maintaining its rank as the dominant asset with a market cap of $1.27T. Ethereum follows at $1,866.31 with a market cap of $225.25B. BNB is at $589.62, up 0.60%, while XRP is trading at $1.07. Solana has seen a 1.06% increase to $73.32. TRON is at $0.3290, and Hyperliquid is the standout performer among the top ten, climbing 4.58% to $55.02.

News driving today's market

The dominant narrative today is the aggressive push into tokenization by BlackRock. The asset manager has launched tokenized money market funds on Solana and Ethereum, specifically designed for stablecoin reserve management. By recording ownership on-chain and investing in short-term U.S. Treasuries, BlackRock is effectively turning the blockchain into a high-efficiency filing cabinet for government debt. This is not the "financial revolution" that moon-boys dream of, but it is the kind of boring, institutional plumbing that actually brings liquidity. We previously covered how active crypto management is becoming the new standard for institutions, and BlackRock's move into tokenized cash is the logical next step.

The scale of this move is significant. BlackRock is debuting tokenized share classes for European money market funds with $311 billion in assets, using JPMorgan's Kinexys. This bridges the gap between traditional finance and digital rails in a way that is hard to ignore. However, we should be cautious. We previously warned that the tokenizing stocks trap can lead to centralized receipts that look like blockchain assets but offer little actual decentralization. Still, the inflow of potential capital is a bullish signal for the underlying networks.

Mastercard has also entered the fray by completing a $1.8B acquisition of BVNK. This is a clear effort to expand stablecoin payments and treasury services for enterprises. When a payment giant like Mastercard spends nearly two billion dollars on stablecoin infrastructure, it validates the utility of these assets beyond mere speculation. Additionally, Ripple's strategic investment in Zilo and Licuido shows that the industry is pivoting toward real-world asset tokenization. Even sovereign entities are changing their strategy, as Bhutan's GMC has decided to put part of its 10,000 BTC treasury to work on a market-neutral basis rather than just holding it as a static national asset.

Social intelligence

The geopolitical atmosphere is currently the primary weight on market sentiment. Reports of a dry bulk ship being hit by a projectile near the Strait of Hormuz have sent a ripple of anxiety through the risk-asset markets. The Strait of Hormuz is one of the most critical shipping chokepoints in the world. Any escalation there typically leads to a spike in energy prices and a general retreat from risk. While the Iraqi Oil Ministry claims tankers are still passing through, the initial shock is why the Fear and Greed Index remains low despite the green candles.

In the U.S., the market is eyeing a scheduled set of remarks from President Trump on Wednesday. In this environment, a single tweet or a stray comment about digital assets can move the market more than a week of technical analysis. Meanwhile, data from Japan suggests that the Bank of Japan may not have intervened in the FX market on Monday. This lack of intervention keeps the volatility in currency pairs high, which often spills over into the crypto markets as traders hedge their global macro positions.

The internal politics of Iran are also adding to the noise. President Pezeshkian's insistence that he will not resign and his alignment with the military suggests a period of continued instability. For the crypto market, this is a double-edged sword. Geopolitical chaos usually drives a flight to the U.S. dollar and treasuries, but it can also reinforce the narrative of Bitcoin as a hedge against state failure. For now, the fear is winning.

Trading ideas worth watching

Bitcoin is currently fighting a battle at the $62,000 level. One bullish setup suggests that if buyers can defend the support zone between $61,920 and $62,220, a recovery toward $63,560 is likely. However, this is complicated by some grim data. Roughly 1,816 BTC, worth about $114 million, were recently stolen from over 5,200 addresses in an expanded attack on Coldcard wallets. On top of that, Strategy sold 1,638 BTC for approximately $104.7 million. These are significant sell-side pressures that could easily overwhelm the bid at $62k.

Redrawn BTCUSDT 240 trading idea chart for Bitcoin Under Pressure: Can Bulls Defend $62K?

A more cautious view sees a bearish breakdown. If Bitcoin fails to hold the $63,700 level, it could trigger a slide through the $62,300 neckline. This would open a path down to the $58,300 to $58,600 demand zone. The aggressive buying we saw at the start of the week often snaps back, and a failure to maintain momentum here would suggest that the recent rally was merely a short squeeze rather than a trend reversal.

Ethereum presents a more interesting technical pattern. There are signs of a double bottom forming around $1,828. Buyers have stepped in twice at this level, creating a strong demand zone. If this support holds, the path of least resistance is higher, with targets at $1,897 and $1,934. The risk here is the lack of on-chain activity. A double bottom is a great pattern, but without a catalyst to drive actual network usage, the move could lack the volume needed to break through the nearest resistance levels.

Redrawn ETHUSDT 60 trading idea chart for Ethereum Double Bottom Signals Potential Bullish Reversal

What to watch next

The coming days will be a tug-of-war between institutional adoption and geopolitical risk. On one side, we have BlackRock and Mastercard building the infrastructure for a tokenized global economy. This is a long-term bullish driver that provides a floor for the market. On the other side, we have a fragile situation in the Strait of Hormuz and an unpredictable political calendar in the U.S.

The most important metric to watch is the Coinbase Premium. If it remains negative while the price climbs, it means the rally is being driven by offshore speculators and not by the deep-pocketed U.S. institutions. That would make the current price action fragile. We also need to see if Ethereum's gas fees start to rise. If the price continues to climb while the network remains a ghost town, the divergence will eventually become unsustainable. For now, we are in a "fearful bull" market, where the data is positive but the traders are too scared to admit it.

Crypto Market Overview | Leverage bets surge amid security shocks and institutional interest | August 3, 2026
Sigrid Voss·

Crypto Market Overview | Leverage bets surge amid security shocks and institutional interest | August 3, 2026

Market overview

The market is currently a study in contradictions. While the total crypto market cap sits at $2.24T with a modest 0.64% dip, the underlying plumbing suggests a high degree of fragility. We are seeing a massive divergence between spot trading and derivatives. Spot volume is a mere $43.15B, but derivatives volume has surged to $465.56B. When the speculative bets are ten times larger than the actual asset exchange, we are no longer looking at a market for investment. We are looking at a high-stakes casino.

Sentiment has soured, with the Fear and Greed Index landing at 33. This fear is not shared by the traditional markets, where the S&P 500 and NASDAQ are both posting gains. This decoupling is a recurring theme. It suggests that the current selling pressure is internal to the crypto ecosystem rather than a broad risk-off move from Wall Street. Stablecoin dominance remains a heavy weight at 11.40%, meaning a significant amount of capital is sitting on the sidelines, waiting for a reason to enter or simply hiding from the volatility.

Bitcoin dominance is holding strong at 56.22%, though some metrics suggest it has pushed as high as 58.35%. This consolidation of power comes at the expense of the broader altcoin market. The Altcoin Season Index is neutral, hovering around 26 to 52 depending on the timeframe, which is a polite way of saying that most altcoins are simply drifting lower.

Bitcoin and Ethereum

Bitcoin is trading at $62,600.25, down 0.85% over the last 24 hours. The price action is currently battling a wave of negative security news. The Coldcard exploit, which resulted in the loss of roughly $90M, has shaken the faith of those who believed hardware wallets were an absolute sanctuary. It is a bit ironic that the "safe" option became the point of failure. On-chain data from CryptoQuant suggests we have not hit a capitulation-level stress point yet, but the psychological damage of a seed generation flaw is often harder to recover from than a simple price drop.

Ethereum is in a more precarious position, trading at $1,842.5 and down 1.33%. The most telling metric here is not the price, but the gas fees. With gas sitting at a negligible 0.17 to 0.19 Gwei, the network is effectively a ghost town. Low fees are usually a win for users, but in this context, they signal a complete lack of on-chain demand. We have previously noted how Ethereum market share vanishes while the protocol focuses on corporate polish. The data today confirms that the corporate makeover has not yet brought the users back.

Top crypto prices

The top of the leaderboard is mostly red. Bitcoin and Ethereum lead the slide, with XRP also down 1.10% at $1.06 and Solana slipping 0.95% to $72.51.

There are a few outliers. BNB managed a slight gain of 0.49% to $586.03, and TRON is up 0.41% at $0.3276. The most notable performer is Hyperliquid (HYPE), which climbed 2.14% to $52.6. In a market where almost everything is bleeding, a 2% gain looks like a rally.

News driving today's market

The dominant narrative today is the clash between immediate security failures and long-term institutional integration. The Coldcard exploit is the primary drag on sentiment. Losing $90M due to a flaw in seed generation is a systemic shock that reminds traders that no storage is truly risk-free. This is compounded by the SEC keeping Nasdaq Bitcoin options on hold, which creates a regulatory bottleneck for institutional derivatives.

On the other side of the ledger, the "reverse bridge" is gaining momentum. Crypto exchanges are now offering perpetuals for stocks and indexes, with volumes hitting $1.32 trillion in the first five months of 2026. We previously covered how this crypto exchanges reverse bridge shifts the power dynamic, as exchanges move toward an "everything exchange" model.

There are also signs of institutional maturity. Bithumb is targeting a 2028 IPO, and HashKey has received approval from JPMorgan to open client money accounts. Ripple is also deepening its push into tokenized capital markets through investments in ZILO and Licuido. These developments are fundamentally bullish, but they operate on a different timescale than a $90M exploit. The market is currently prioritizing the immediate pain of the exploit over the slow promise of a 2028 IPO.

Social intelligence

The social feed is focused on the macro environment and on-chain stress. Analysts are pointing to the fact that Bitcoin's unrealized loss returns are below the deep-stress band. This suggests that while holders are unhappy, they are not yet in a state of total panic.

Geopolitical noise is adding to the uncertainty. Reports of China's CXMT considering a second memory chip plant in Beijing suggest a continued push in semiconductor independence, which often correlates with shifts in global risk appetite. Simultaneously, falling oil stocks and a 5% decline in crude prices suggest a cooling of industrial demand. For crypto, this is a mixed bag. It may signal a broader economic slowdown, but it also removes some of the inflationary pressure that has plagued the macro environment.

Trading ideas worth watching

The most critical setup currently involves USDT Dominance. The asset is trading within a potential reversal zone, moving inside an ascending channel. From an Elliott Wave perspective, it appears to be completing an upward corrective structure. If USDT.D pushes toward the 8.65% resistance level, it will signal that capital is fleeing crypto for the safety of stables. This would put immediate downward pressure on the entire market. A move toward 8.40% would be the signal for a relief rally in assets.

Trading idea chart: USDT.D - USDT Dominance Near a Critical PRZ: Pressure Ahead for Crypto?

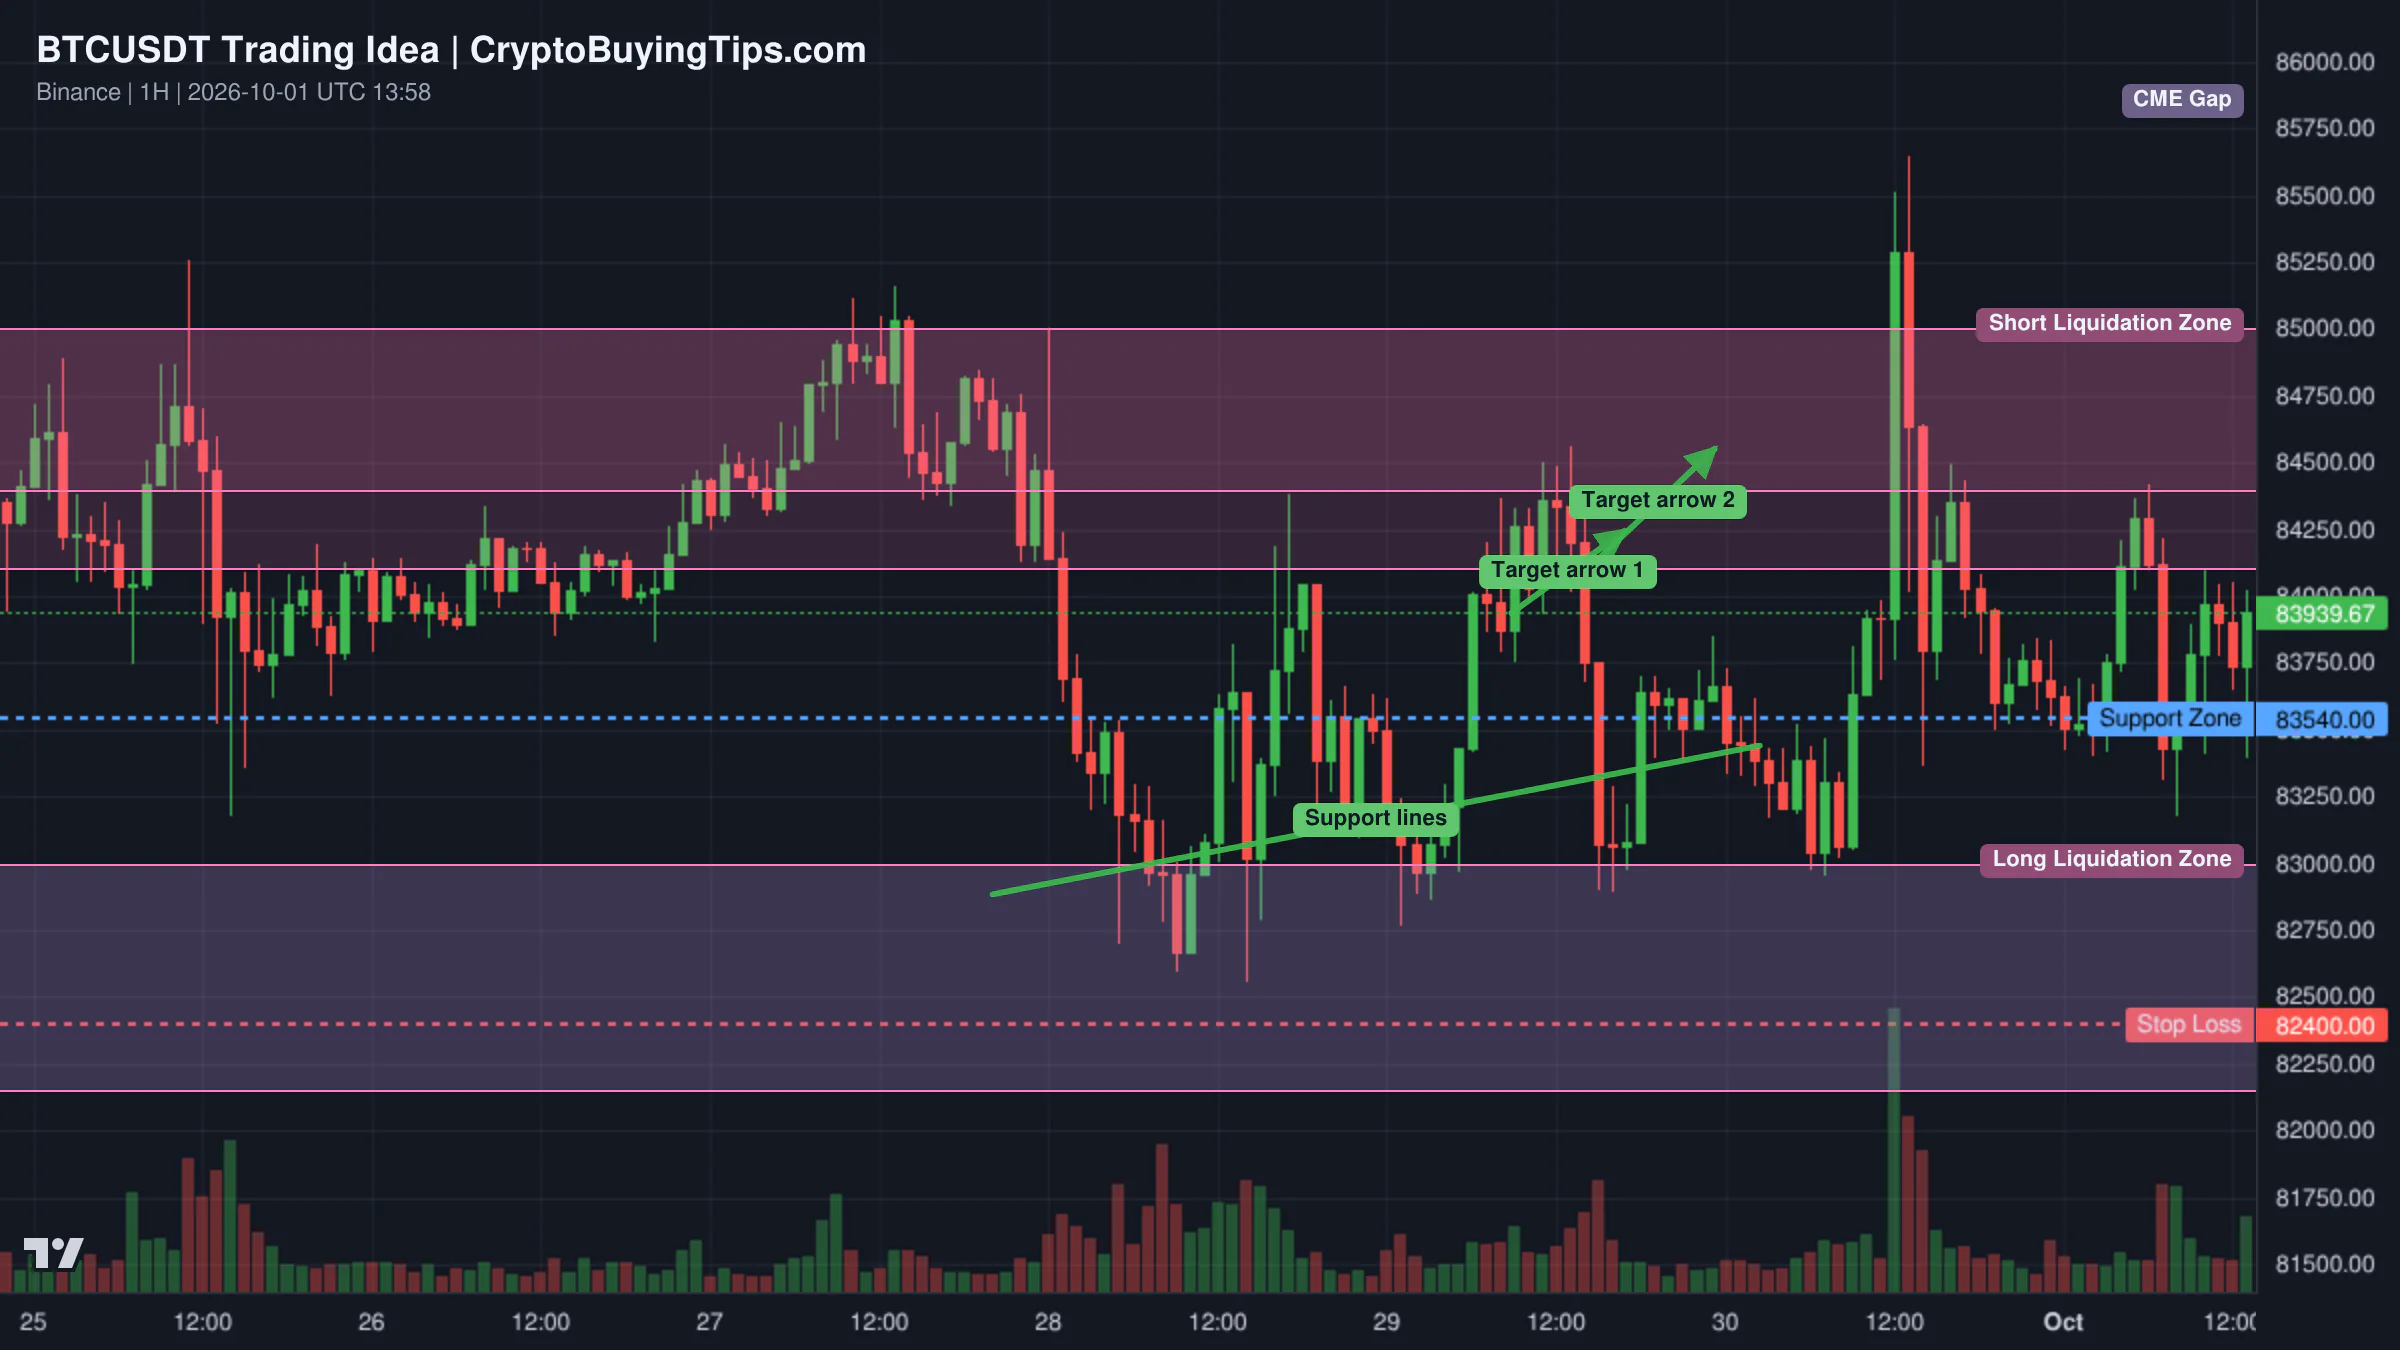
For Bitcoin, there is a short-term play on a support bounce. The price is currently testing liquidity near $62,955. A dip toward $62,000 to sweep retail stop-losses could trigger a high-velocity rebound toward $63,200, with a final target of $63,800. This is a classic liquidity sweep. Traders should be cautious about shorting into this floor, as the buy orders from professional desks are likely waiting exactly there.

Redrawn BTCUSDT 1W trading idea chart for $200,000 Target Explained—Bitcoin's Bear Market, Altcoins & More

Long-term bulls are ignoring the noise and eyeing a $200,000 target for 2027. This view is based on the observation that the bear market crash of late 2025 lasted only four months, while the recovery and sideways period have lasted six months. The argument is that the market has spent more time recovering than it did crashing, which typically precedes a massive bullish wave.

Altcoin Spotlight

Hyperliquid (HYPE) deserves attention today. While the rest of the market is sliding, HYPE is up 2.14%. This strength is not accidental. As the market shifts toward derivatives and "everything exchanges," Hyperliquid's position as a high-performance perpetual exchange makes it a direct beneficiary of the current trend. When spot trading dies and leverage takes over, the platforms that facilitate that leverage tend to outperform.

What to watch next

The immediate focus is the $62,000 support level for Bitcoin. If this floor fails, the "fear" sentiment will likely accelerate into a genuine panic. We also need to monitor the Clarity Act. Bernstein suggests that if the Act fails to pass, the SEC and CFTC may be forced to accelerate their own rulemaking. This would be a paradoxical win; legislative failure could lead to faster regulatory clarity.

Finally, keep an eye on Ethereum's gas fees. If they stay this low, it confirms that the network is failing to attract meaningful activity, regardless of how many corporate partnerships it announces. The gap between the institutional narrative and the on-chain reality is becoming impossible to ignore.