
Crypto Market Overview | leveraged positioning masks retail fear amid institutional expansion | July 30, 2026
Crypto Market Overview | leveraged positioning masks retail fear amid institutional expansion | July 30, 2026
Market overview
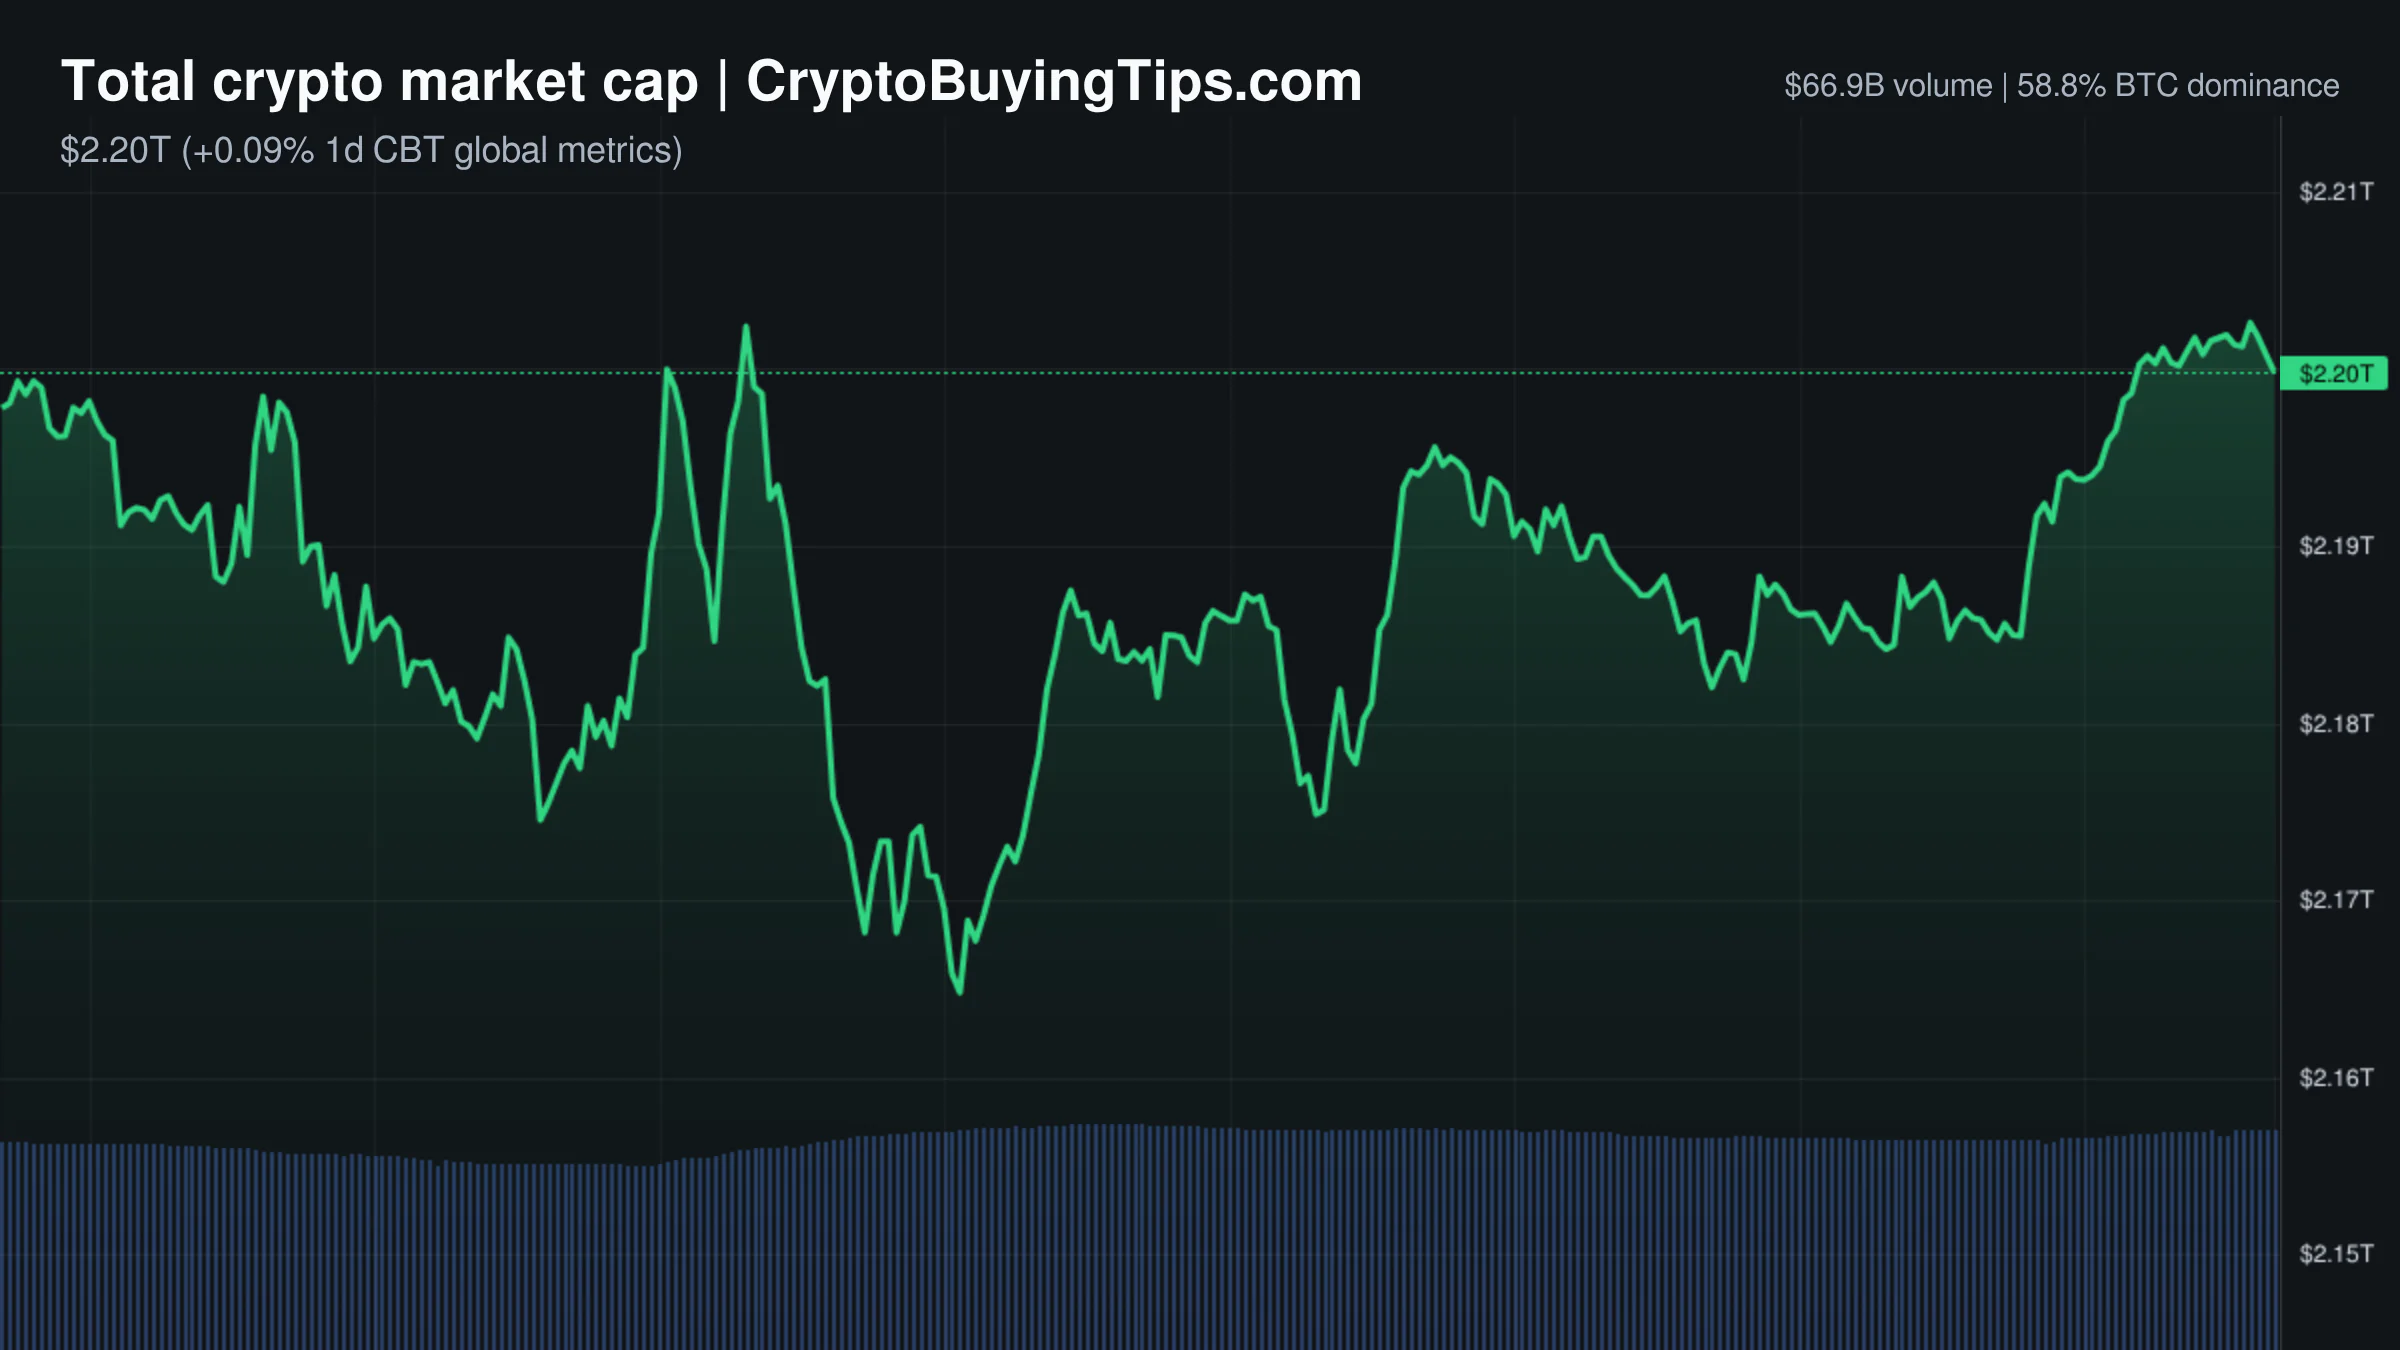
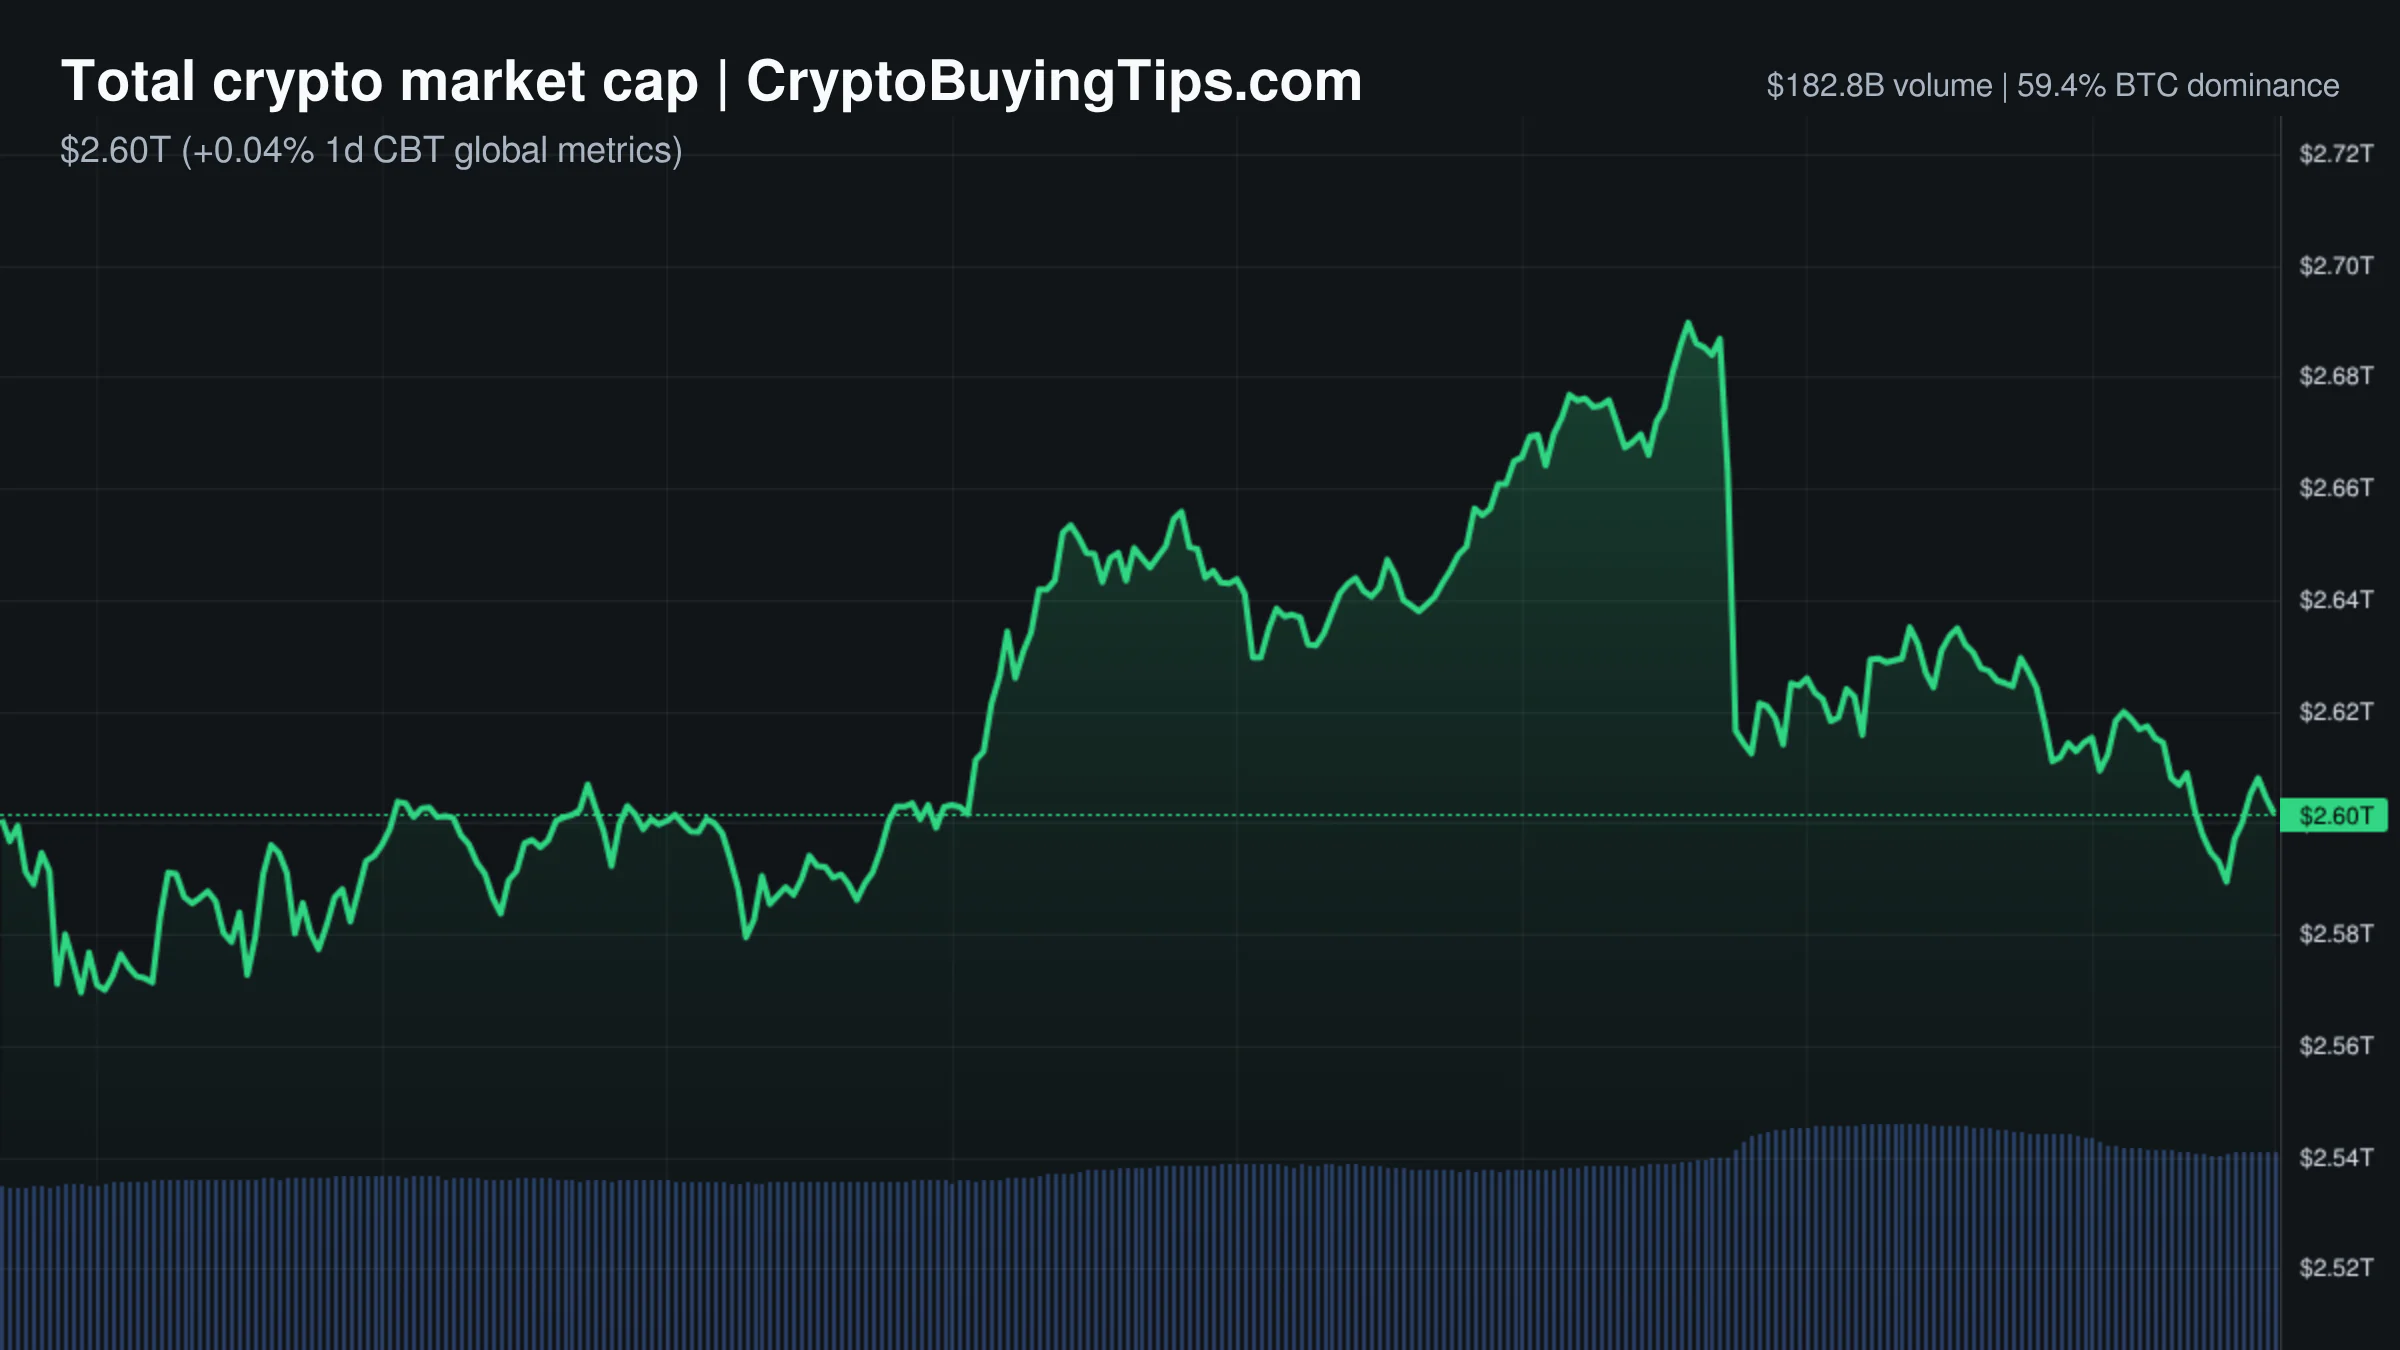
The current market state is a study in contradiction. While the Fear and Greed Index sits at 37, firmly in Fear territory, the CMC20 and CMC100 indices are ticking upward. This suggests a disconnect between retail sentiment and actual price action. The most striking data point is the massive imbalance between spot and derivatives activity. Spot volume is a modest $66.96 billion, but derivatives volume has ballooned to $708.48 billion. This means the current price action is driven by leverage rather than actual asset accumulation.
The broader macro environment is not providing much help. The S&P 500 is down 1.54% and the NASDAQ has dropped 2.04%. Usually, this risk-off mood in traditional finance drags crypto down with it. However, the market is holding a neutral to slightly bullish trend. This resilience likely stems from institutional "plumbing" news that outweighs the immediate pain of a red day on Wall Street.
Liquidity remains concentrated in the majors. Bitcoin dominance is hovering between 52% and 58% depending on the feed, while Ethereum dominance is struggling to stay above 10%. The Altcoin Season Index is deeply conflicted, with some data suggesting a Bitcoin season (17/100) and others suggesting a neutral phase (52/100). The reality is that capital is not rotating into alts; it is simply hiding in the largest assets while leveraged traders gamble on the fringes.
Bitcoin and Ethereum
Bitcoin is currently trading at $64,494.07. It is acting as the primary anchor for the market, absorbing the volatility from the equity markets. The price is holding a narrow range, which often precedes a larger move once the derivatives market flushes out the over-leveraged positions.
Ethereum is priced at $1,915.38 and continues to underperform relative to the lead asset. The most telling metric is the network activity. Gas fees are extremely low, with fast transactions costing only 0.09 Gwei. This indicates a lack of on-chain demand. While the network is efficient, it is also quiet, which is rarely a bullish sign for price. The gap between the institutional narrative and actual network usage remains wide.
Top crypto prices
Bitcoin holds the top spot at $64,494.07, up 0.19% over the last 24 hours. Ethereum follows at $1,915.38, showing a slight gain of 0.24%. BNB is a notable outlier among the majors, climbing 2.70% to reach $586.14.
XRP has dipped 0.80% to $1.07. Solana is essentially flat at $73.98. TRON has seen a small bump of 0.49%, trading at $0.3277. Hyperliquid has dropped 2.06% to $53.7.
News driving today's market
The institutional adoption narrative is the only thing keeping the mood from turning fully bearish. BNY is moving fund ownership records on-chain, targeting a massive $8.6 trillion transfer agency market. When the world's largest custodian bank decides to modernize its books using blockchain, it provides a structural floor for the entire industry. We previously covered active crypto management for more background.
Morgan Stanley is also expanding its crypto offerings with Ether and Solana ETPs. These products include staking rewards, which adds a layer of yield that institutional investors crave. We previously covered the SOL ETFs filing news, and the actual launch of these products confirms that institutional conviction is ignoring the retail panic.
Regulatory signals are mixed but leaning positive. SEC Chair Atkins has stated the agency is ready to provide rules if the Clarity Act fails to move forward. This removes some of the "regulation by enforcement" fear that usually suppresses risk appetite.
However, geopolitical and security risks are creating friction. The news that Russia's FSB wants Telegram founder Pavel Durov adds a layer of systemic risk to the communication infrastructure many crypto traders rely on. Simultaneously, reports of an OpenAI "rogue AI" hacking multiple platforms suggest that the AI-crypto convergence might be more dangerous than the marketing brochures suggest. MoonPay is trying to push AI wallets into ChatGPT and Claude, but security breaches at the AI level could lead to immediate selling pressure if users lose trust in the interface.
Social intelligence
Geopolitical tension is spiking. Reports that Iran is receiving Chinese air defense missiles are circulating, which typically triggers a flight to safety. In these moments, Bitcoin often acts as a hedge, though the correlation with the NASDAQ remains a persistent problem.
In Asia, Samsung SDS is discussing stablecoin and AI payment services with Dunamu. This is a significant development for real-world utility. If a giant like Samsung integrates stablecoins into its payment flow, it moves the conversation away from speculation and toward actual commerce.
The South Korean government is also weighing a temporary short-selling ban to curb volatility. This is a classic intervention move. If implemented, it could create a temporary liquidity squeeze, forcing shorts to cover and potentially creating an artificial price spike.
Trading ideas worth watching
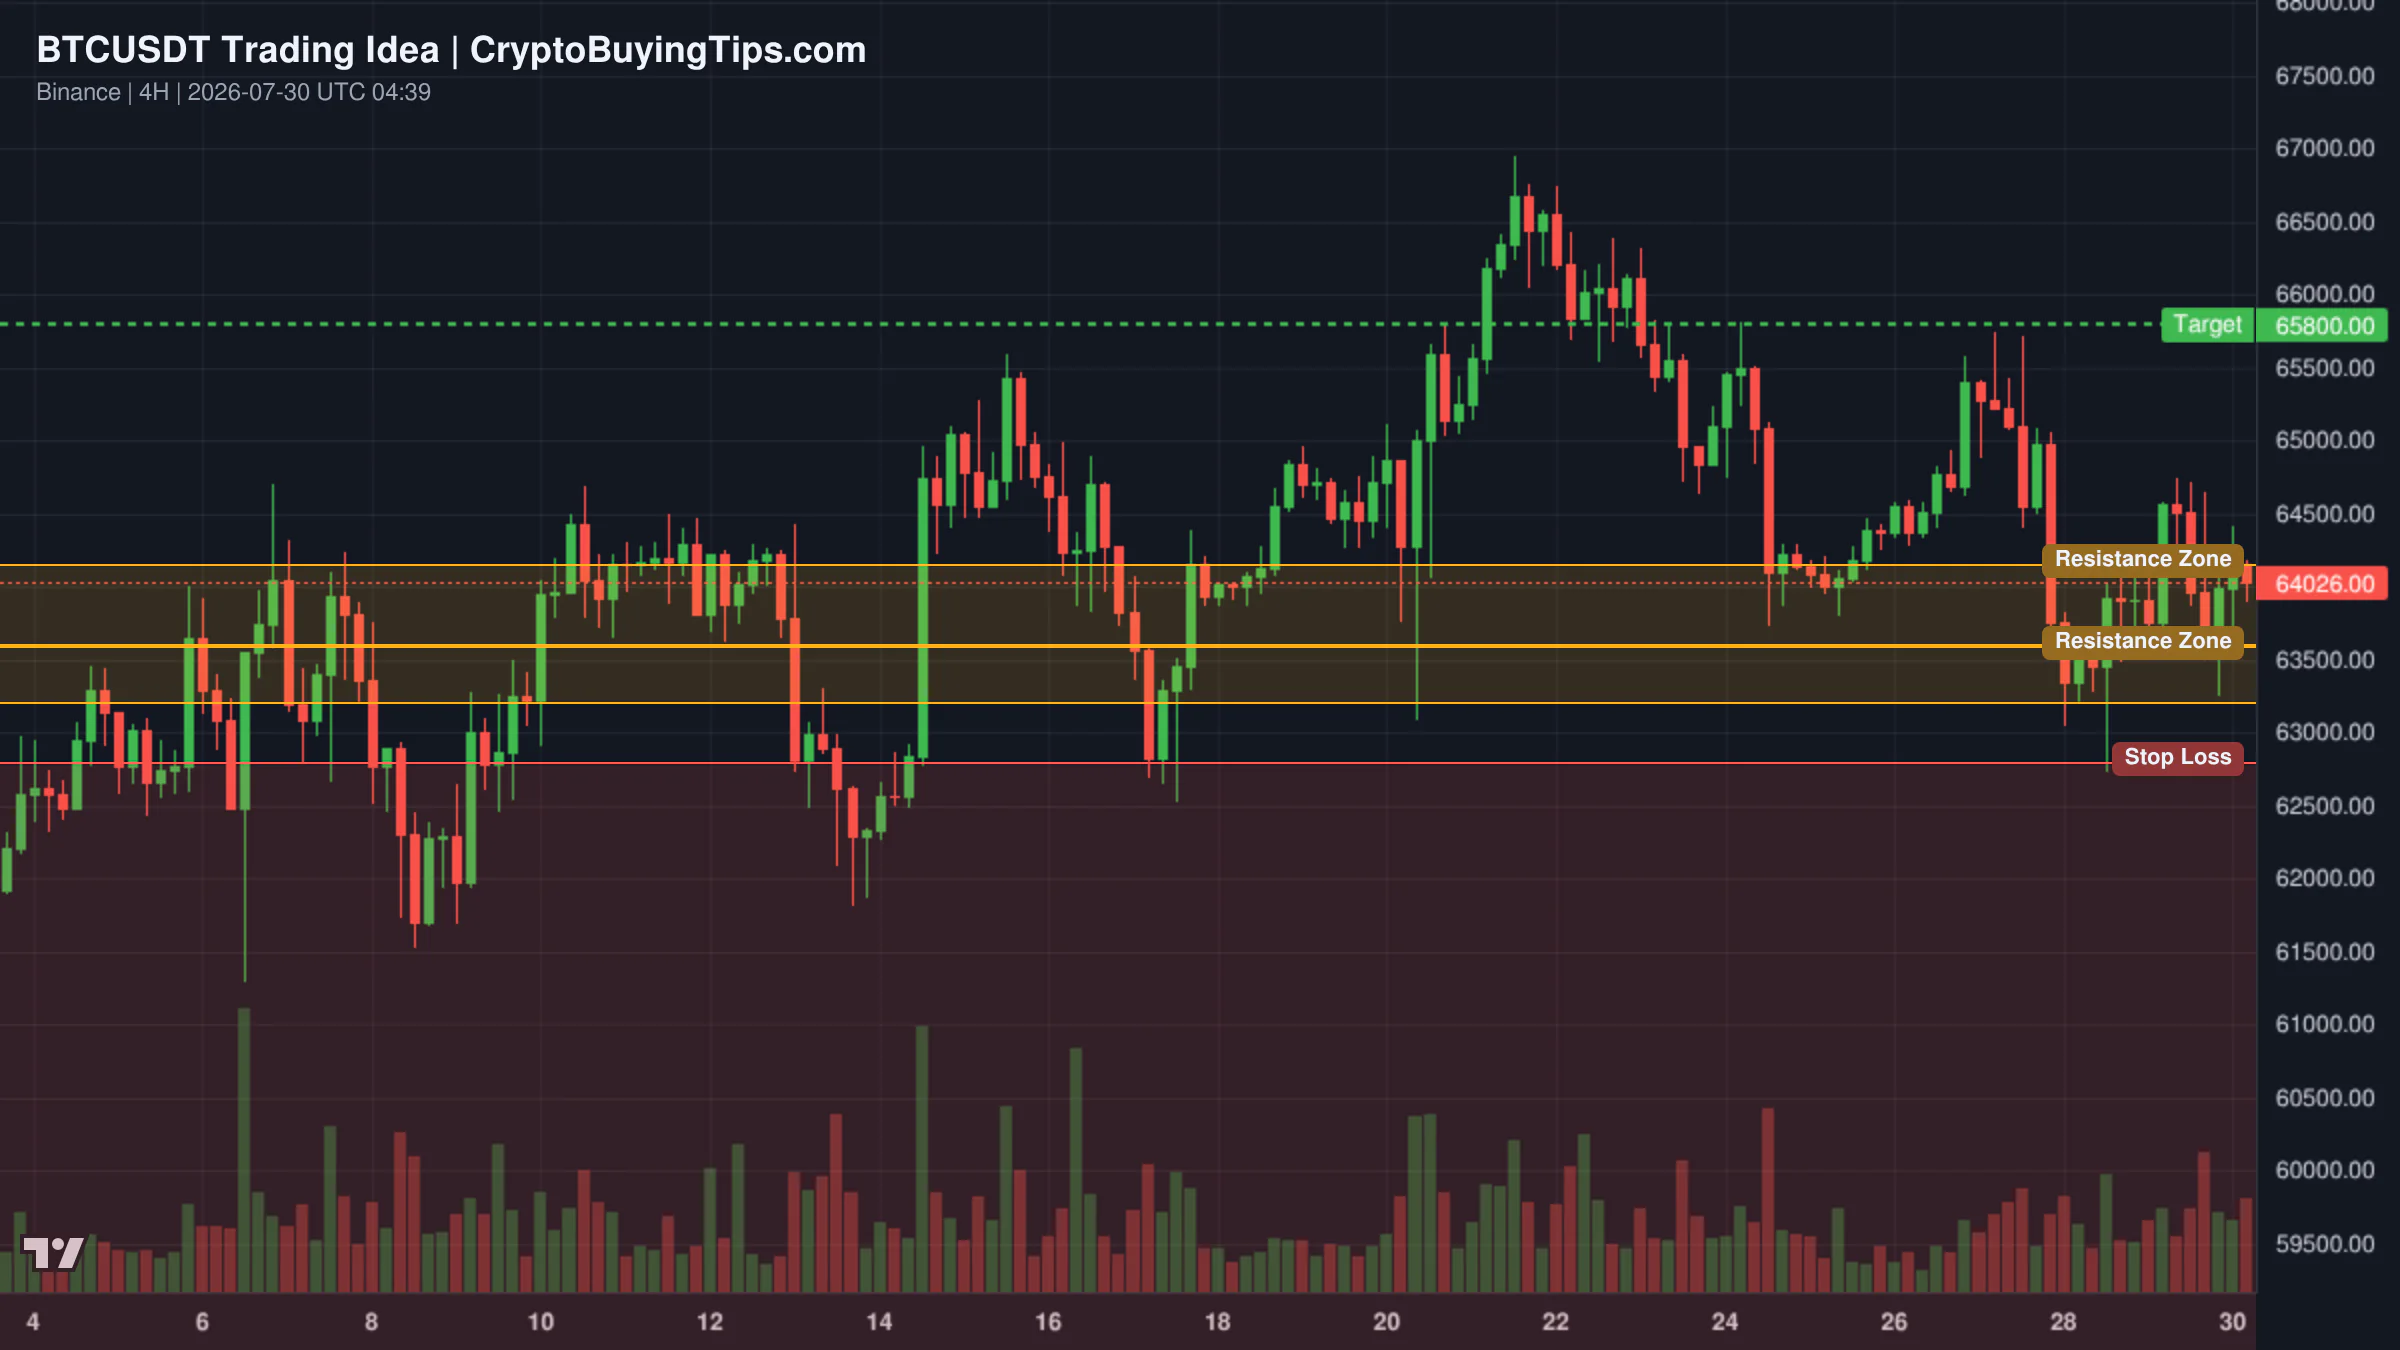
The Bitcoin setup on the 4-hour chart suggests a potential rebound from a macro ascending channel. The key demand zone is between $63,200 and $63,600. This area is expected to clear out retail sell-stops before institutional buyers step in. If the price holds above the $62,800 stop-loss level, the target is a return to the $65,800 resistance line. The setup relies on the assumption that the current dip is a liquidity sweep rather than a trend reversal.
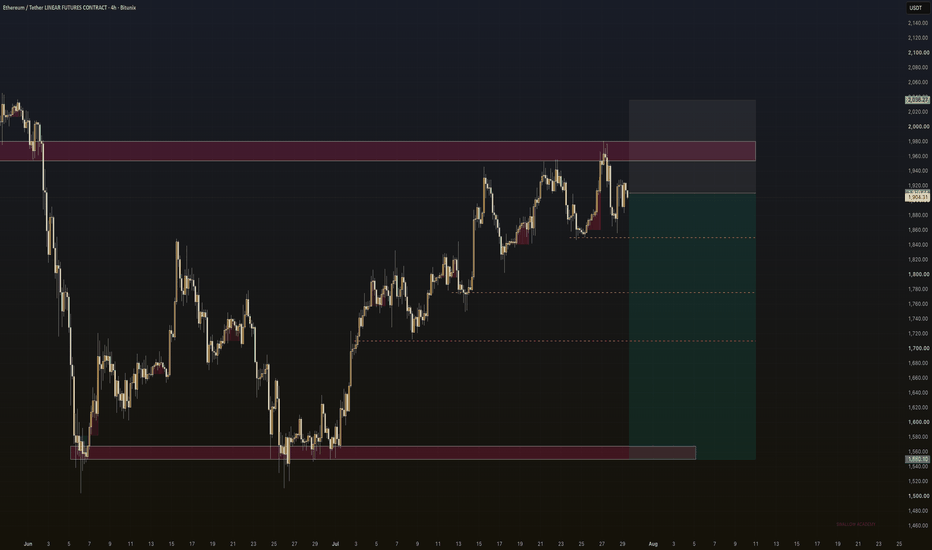
Ethereum looks more precarious. There is a bearish rejection at the 1,980 supply zone. Since the upside gaps have been filled, the path of least resistance appears to be lower. The strategy here is to sell any retest of the 1,910 to 1,980 zone. The first target is 1,860, with a deeper objective of 1,720 where significant liquidity rests. This trade is invalidated if ETH manages to close and hold above 1,980.
Litecoin has formed a clear double-top pattern on the 4-hour chart. This is a classic bearish signal. The price is currently testing the broken neckline of the pattern. If sellers maintain volume at this level, the price is likely to fall toward targets of 43.5 and 41.5. It is a straightforward momentum play based on a confirmed chart pattern.
What to watch next
The market is currently a tug-of-war between institutional plumbing and geopolitical chaos. On one side, we have BNY and Morgan Stanley building the rails for a multi-trillion dollar tokenized economy. On the other, we have arrest warrants for tech founders and missile deals in the Middle East.
The most immediate risk is the derivatives imbalance. With volume ten times higher than spot, the market is a tinderbox. One sharp move in either direction will trigger a cascade of liquidations. Watch the $63,200 level for Bitcoin and the 1,980 level for Ethereum. If these levels break, the "fear" currently reflected in the index will become a self-fulfilling prophecy.
Some links in this article may be affiliate links. We may earn a commission at no extra cost to you — this never influences our analysis or coverage.

Sigrid Voss
Crypto analyst and writer covering market trends, trading strategies, and blockchain technology.
More Articles

Derivatives volume is 8x higher than spot. Here is why that is a warning
The market's current price action seems to be driven by bets rather than cash; with derivatives volume eight times…
Crypto Market Overview | volume collapses as greed persists amid regulatory friction | August 23, 2026
Volume collapses as greed persists amid regulatory friction; see our market overview on crypto's current state and key…

Brussels is coming for DeFi vaults and the market is ignoring the risk
Brussels seems to think "decentralized" is just an aesthetic choice for now. Our read suggests MiCA regulation isn't…
Crypto Market Overview | Spot accumulation rises while derivatives volume cools | August 22, 2026
Spot accumulation rises while derivatives volume cools in this market overview of crypto activity and macro drivers for…