
Crypto Market Overview | Leveraged traders forced out | June 6, 2026
Crypto Market Overview | Leveraged traders forced out | June 6, 2026
Market overview
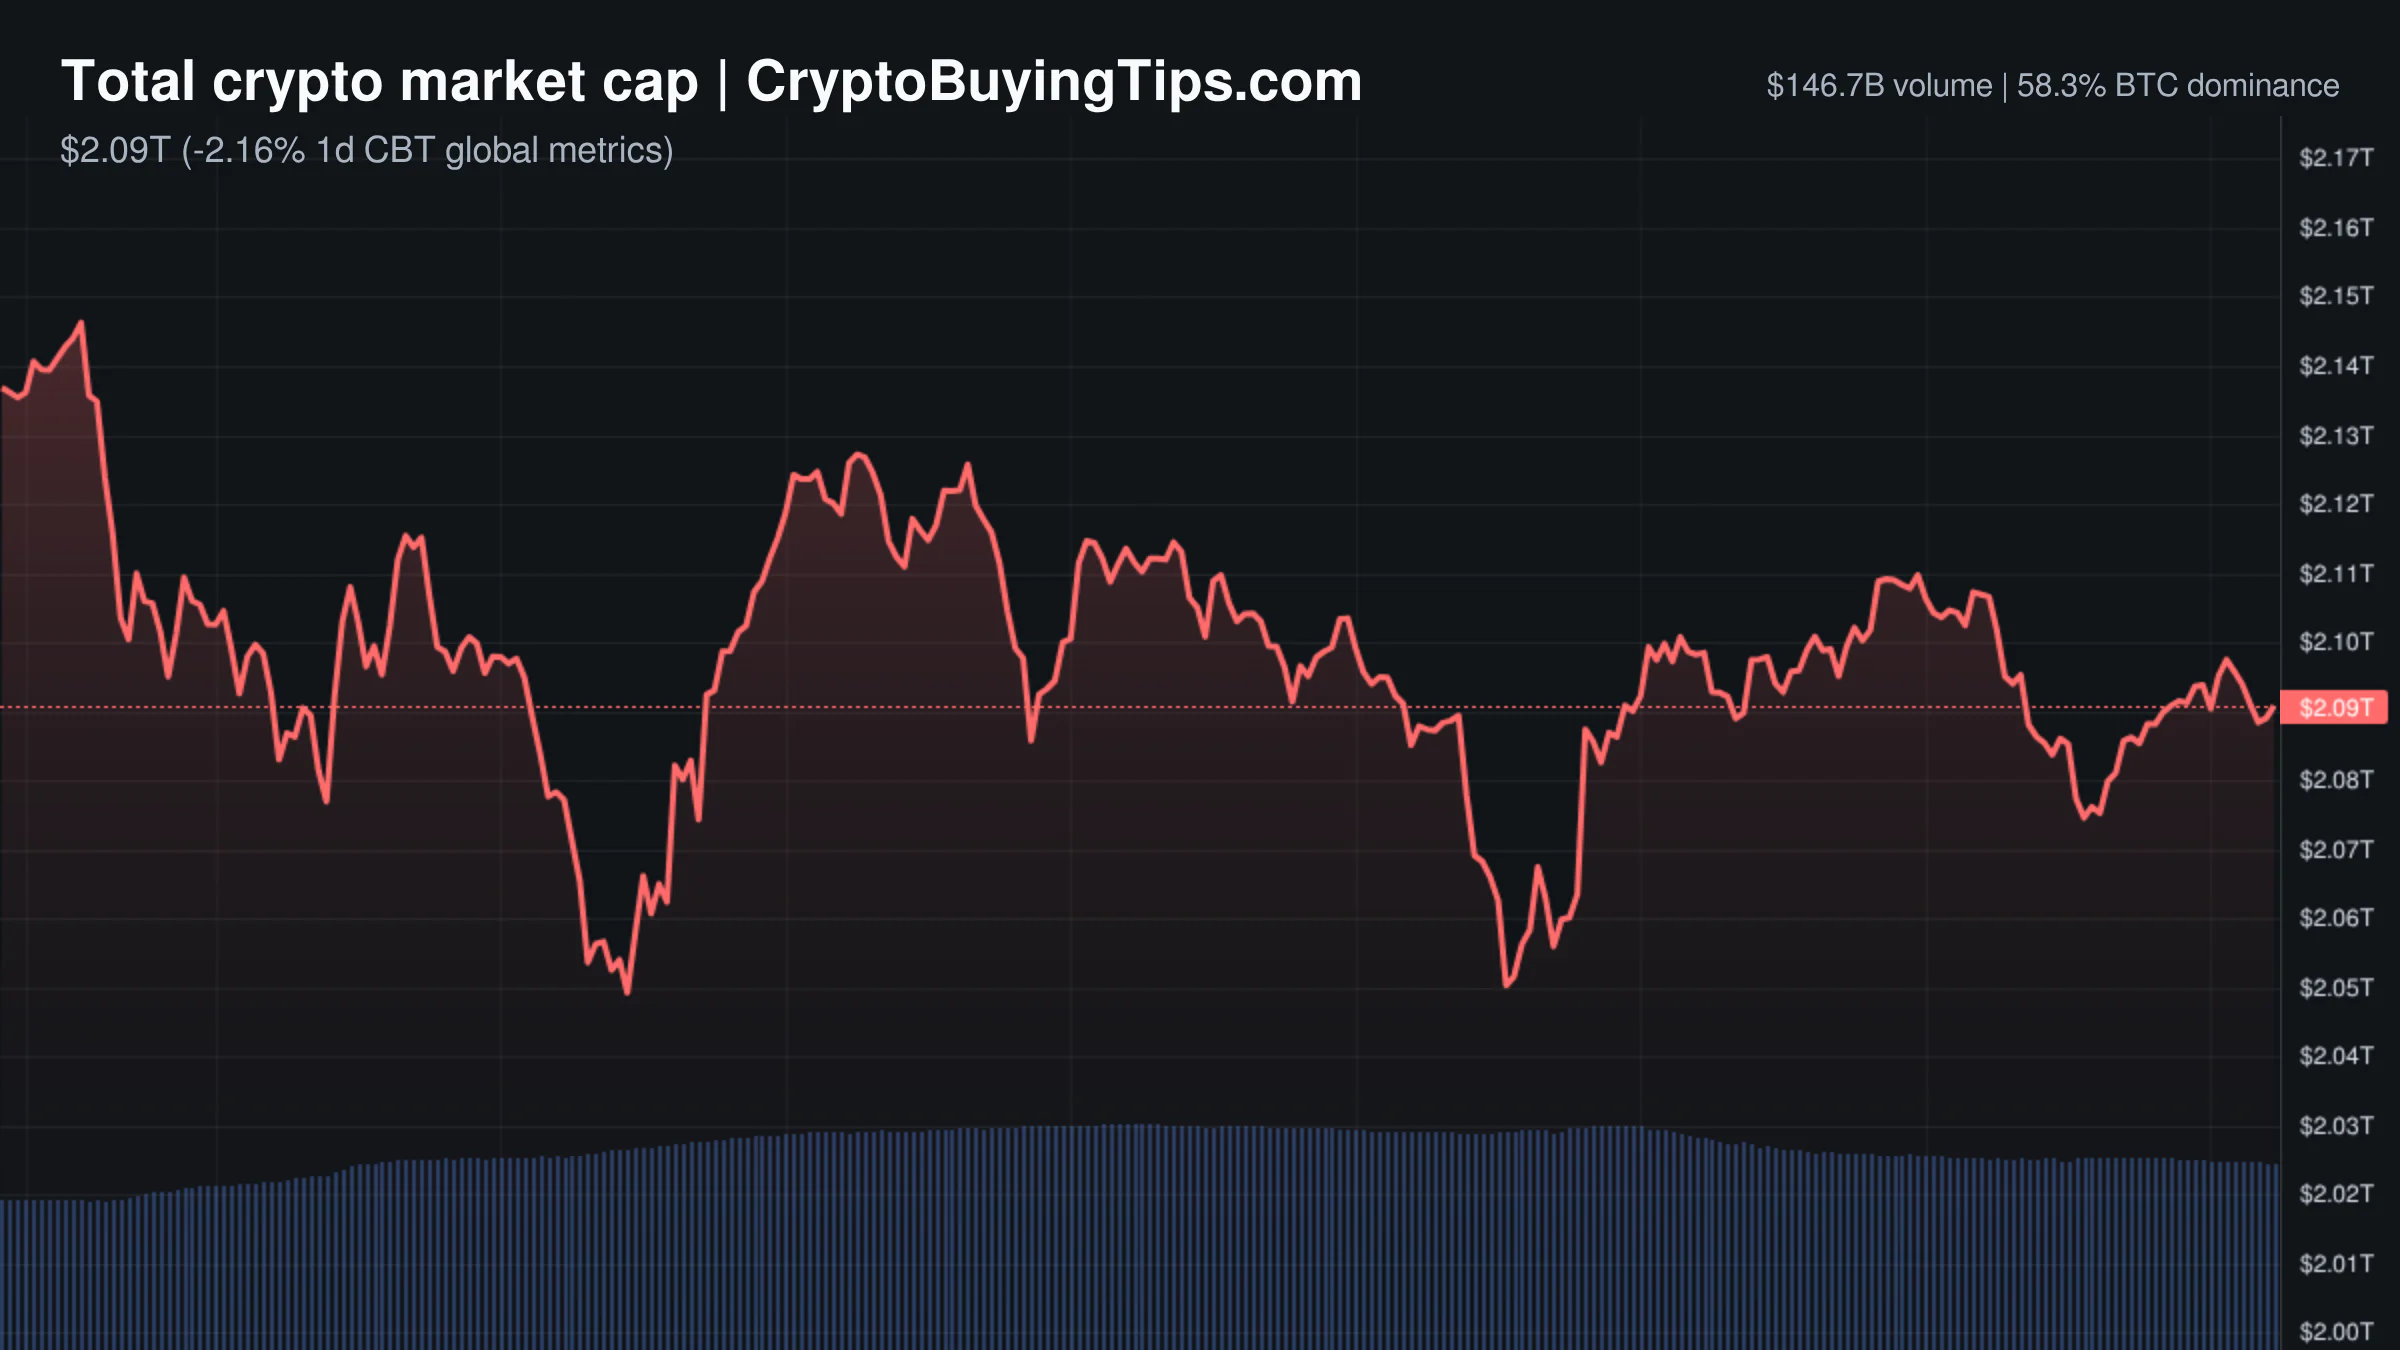
The crypto market is in a state of extreme panic, with the Fear and Greed Index hitting 13. This level of sentiment usually points to a capitulation phase where investors sell off assets in a rush. The total market cap is roughly $2.16T, down 2.34% over the last 24 hours, though other data points suggest a wider range of decline between 2.42% and 2.52%. While prices are falling, trading volume is spiking. The 24h volume stands at $159.3B, and a look at the derivatives market reveals a massive disparity. Spot volume is $147.85B, but derivatives volume has surged to $1.25T, up 15.58%. This indicates that the current price action is not just a fundamental shift but is heavily driven by leveraged traders being forced out of positions.
Liquidity is shifting toward safety. Stablecoin dominance for USDT and USDC is 12.11%, and stablecoin volume rose 18.59% to $147.29B. This suggests traders are either rotating into cash to wait out the volatility or preparing to buy the dip. The broader macro environment is equally bleak. The S&P 500 is down 2.58% and the NASDAQ has dropped 4.80%, showing a strong correlation between risk-off sentiment in traditional equities and the crypto selloff.
Bitcoin and Ethereum
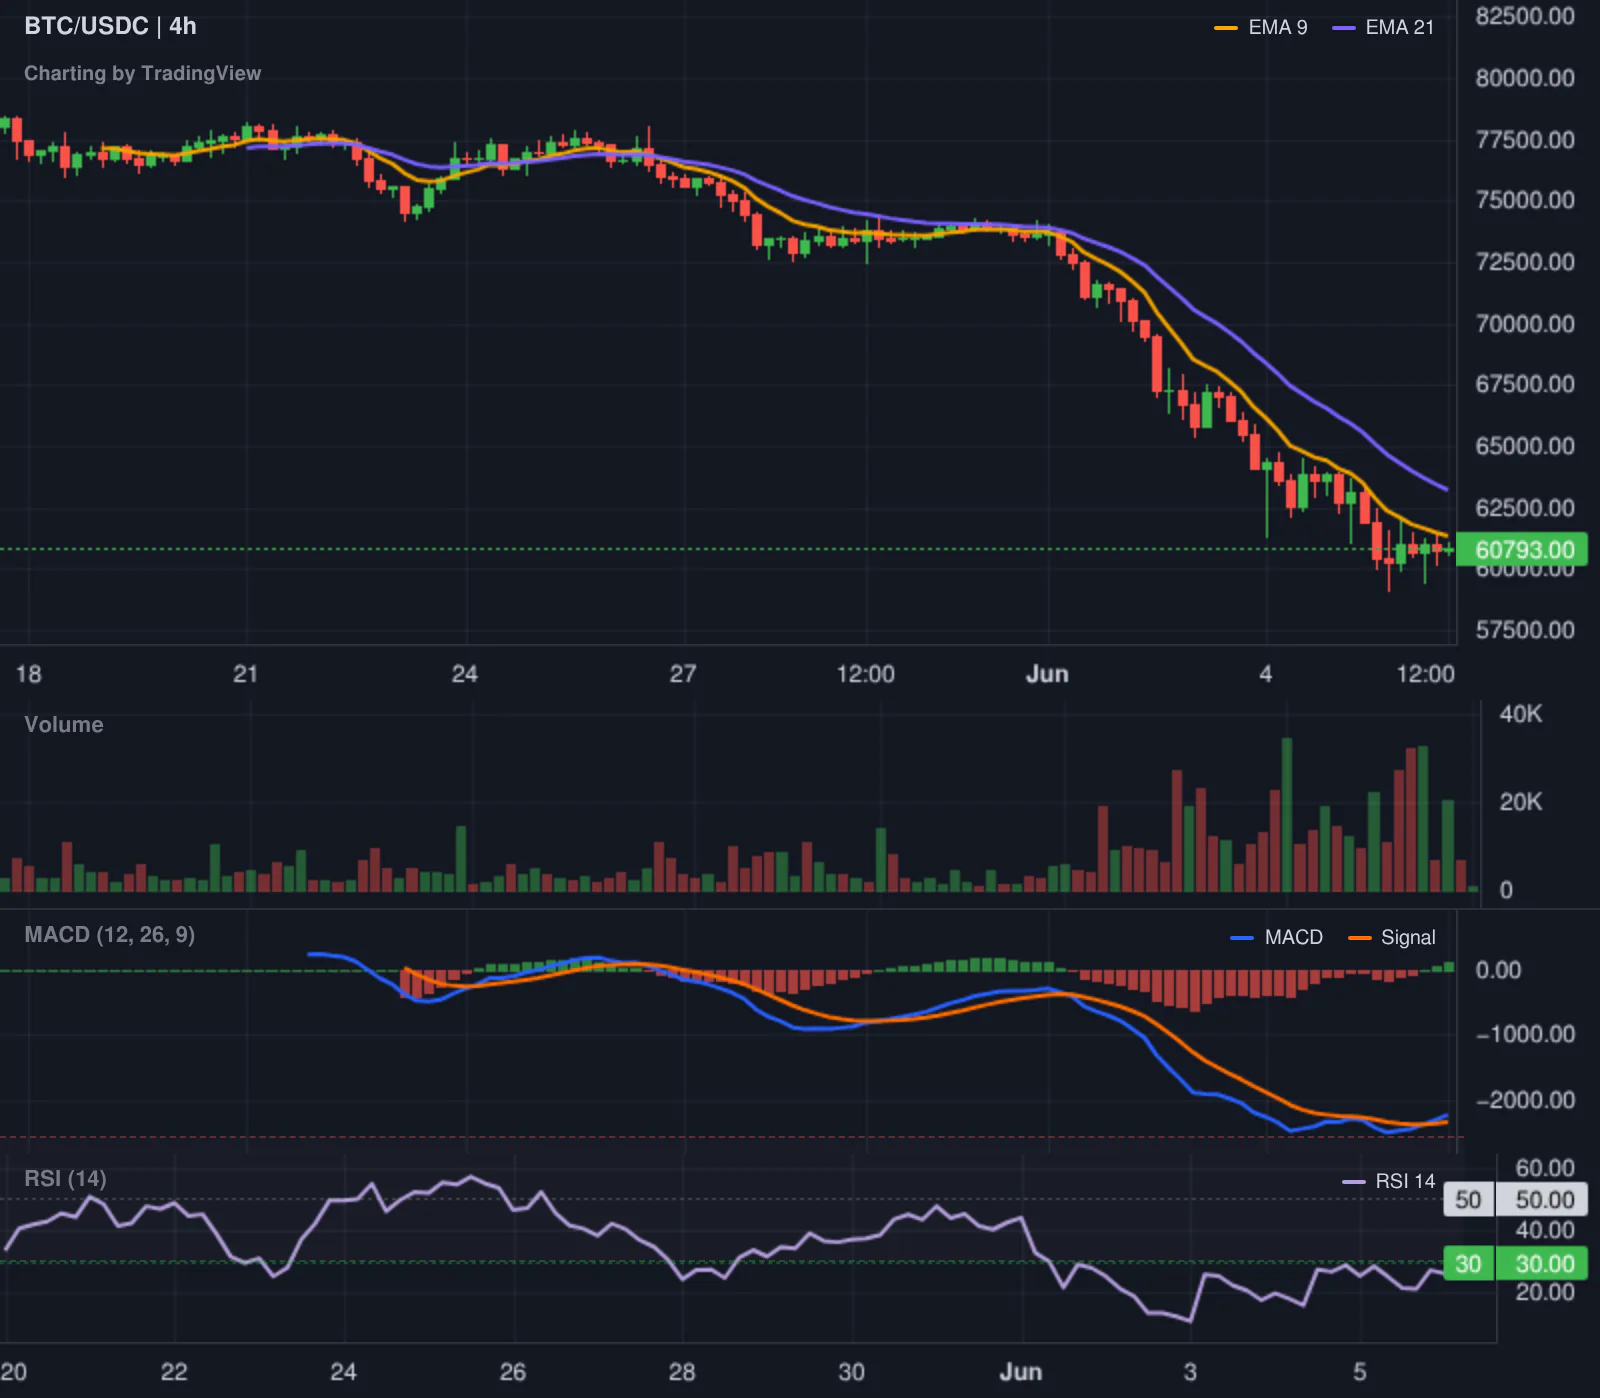
Bitcoin is trading at $60,750.55, down 2.27% in 24 hours. The asset has fallen more than 50% from its October peak. Bitcoin dominance remains high at 56.19%, though some reports place it as high as 58.30%. This high dominance, combined with an Altcoin Season Index of 68 (neutral) or as low as 43, confirms that we are in a Bitcoin Season. Money is not rotating into altcoins; it is leaving the ecosystem or clinging to the primary asset.
Ethereum is struggling more than Bitcoin, with a price of $1,554.95, representing a 6.49% drop. Ethereum dominance is 8.66%. A striking detail is the network state. Gas fees are exceptionally low, between 0.14 and 0.17 Gwei. This indicates a collapse in on-chain activity and congestion, even while exchange trading volume remains high. The implied volatility for Ethereum is 73.31, significantly higher than Bitcoin's 50.92, making it a more volatile target for traders during this correction.
Top crypto prices
The broader market is seeing consistent losses across the top assets. BNB is at $573.1, down 3.00%. XRP has fallen 3.27% to $1.08. Solana is down 5.39% at $62.47. TRON has dropped 1.94% to $0.3193. Hyperliquid is trading at $59.12, down 5.11%. The CMC20 and CMC100 indices are both down between 2.40% and 2.99%, confirming that the selloff is systemic across different market caps.
News driving today's market
A major catalyst for the current panic is a security crisis involving Zcash. An AI model uncovered a four-year-old flaw in the Zcash network, which caused the privacy coin to crash and wiped billions from its market cap. This event has shaken confidence across the sector, as experts warn that similar bugs could be hiding in other crypto networks or even traditional banking systems. We previously covered how Bitcoin Price Collapse can be triggered by global uncertainty, and this technical vulnerability is adding to that instability.
Regulatory pressure is also mounting. The UK Financial Conduct Authority issued a warning against Hyperliquid, adding to the scrutiny of the perpetual futures market. Meanwhile, the US Congress is deliberating seven new crypto tax bills, which introduces a layer of fiscal uncertainty for investors. On the AI front, reports that Anthropic embedded engineers at the NSA for offensive cyber operations have heightened concerns about AI safety and regulatory scrutiny.
There are some institutional positives, but they are currently overshadowed by the selloff. Morgan Stanley is now allowing clients to lend crypto for spot ETF conversions, and the SEC approved the merger registration for Securitize, a BlackRock-backed tokenization firm. We previously explained how Tokenized Stocks Explained could accelerate institutional adoption, but these long-term structural wins are struggling to offset the immediate panic.
Social intelligence
On-chain data from Glassnode suggests a structural shift in institutional behavior. The 30-day simple moving average of US Spot ETF netflows has reached -2.45k BTC per day. This is the fastest sustained pace of outflows since the ETFs launched. It suggests that institutional selling is not a one-off event but a trend. SoSoValue data supports this, showing a total net outflow of $326 million for US spot Bitcoin ETFs and $5.97 million for Ethereum ETFs on June 5.
There are also rumors circulating via WuBlockchain regarding a potential SEC ruling against BlackRock's Bitcoin ETF application. If true, this would be a major blow to institutional sentiment. In the derivatives space, whale activity remains aggressive. One trader recently opened a 20x short on 1,588 BTC, a position valued at $96.78M, betting on further downside.
Trading ideas worth watching
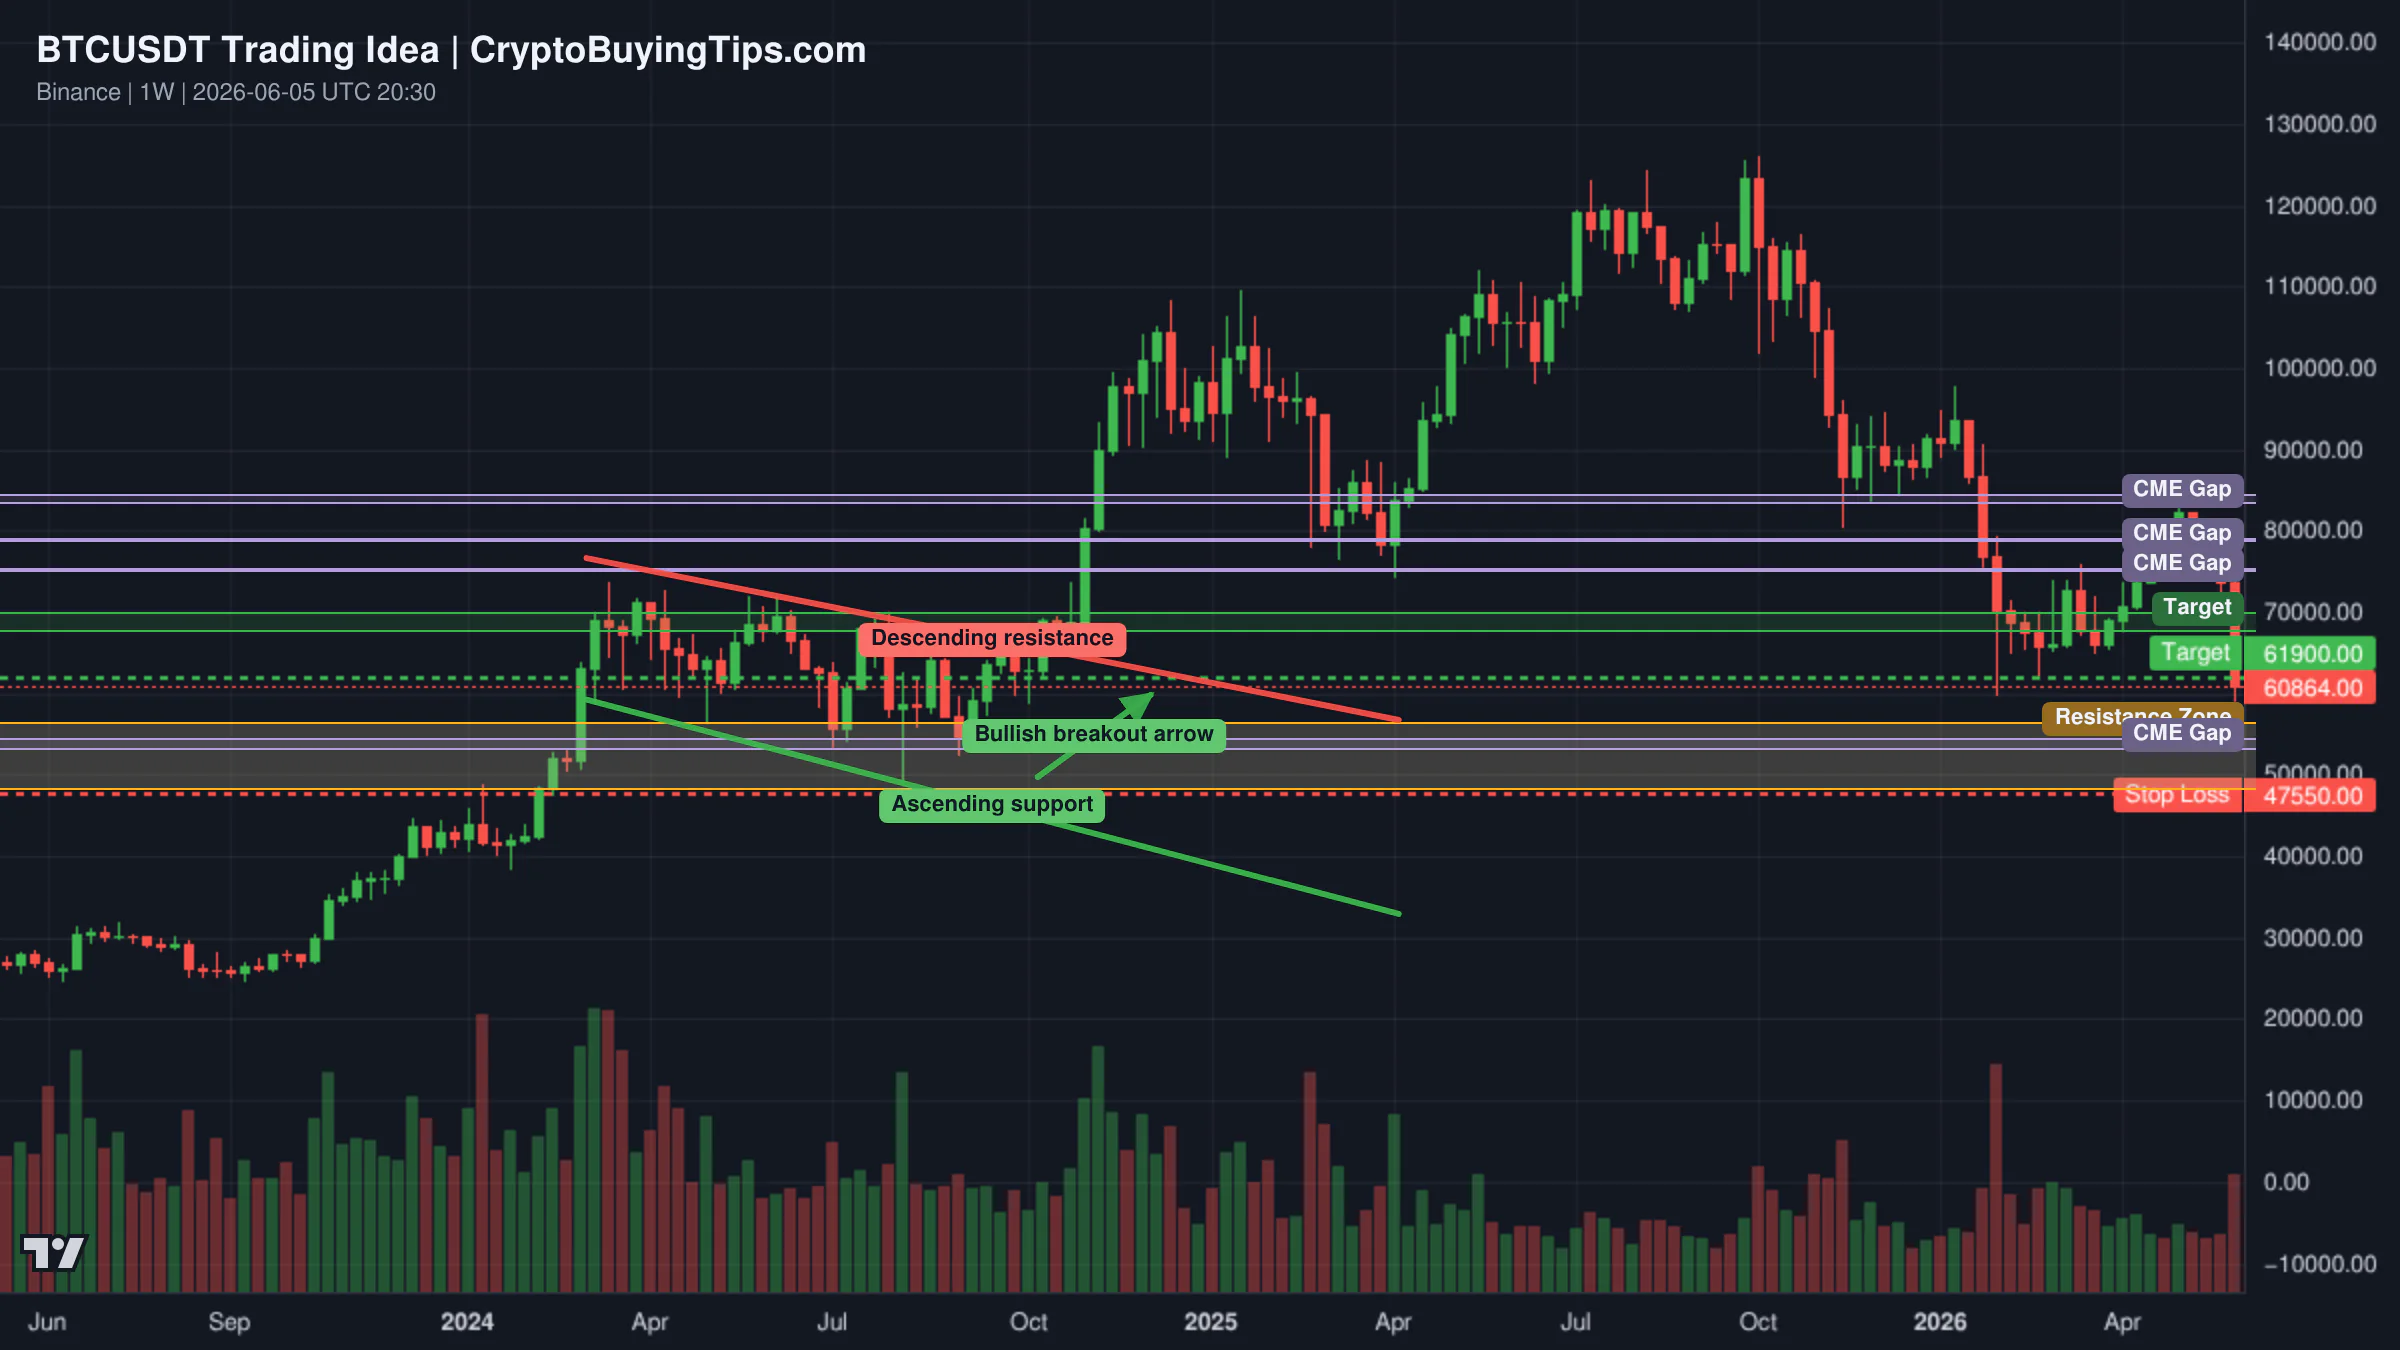
One technical perspective suggests Bitcoin is approaching a heavy support zone between $56,620 and $48,200. The analysis notes that the S&P 500 crash erased over $1 trillion in value in two hours, dragging Bitcoin down. The setup expects a short-term bounce toward $61,900 once these supports are touched, though the long-term Elliott Wave momentum remains bearish. The DXY index and US 10-Year Treasury yields are trending upward, which continues to put pressure on risk assets.
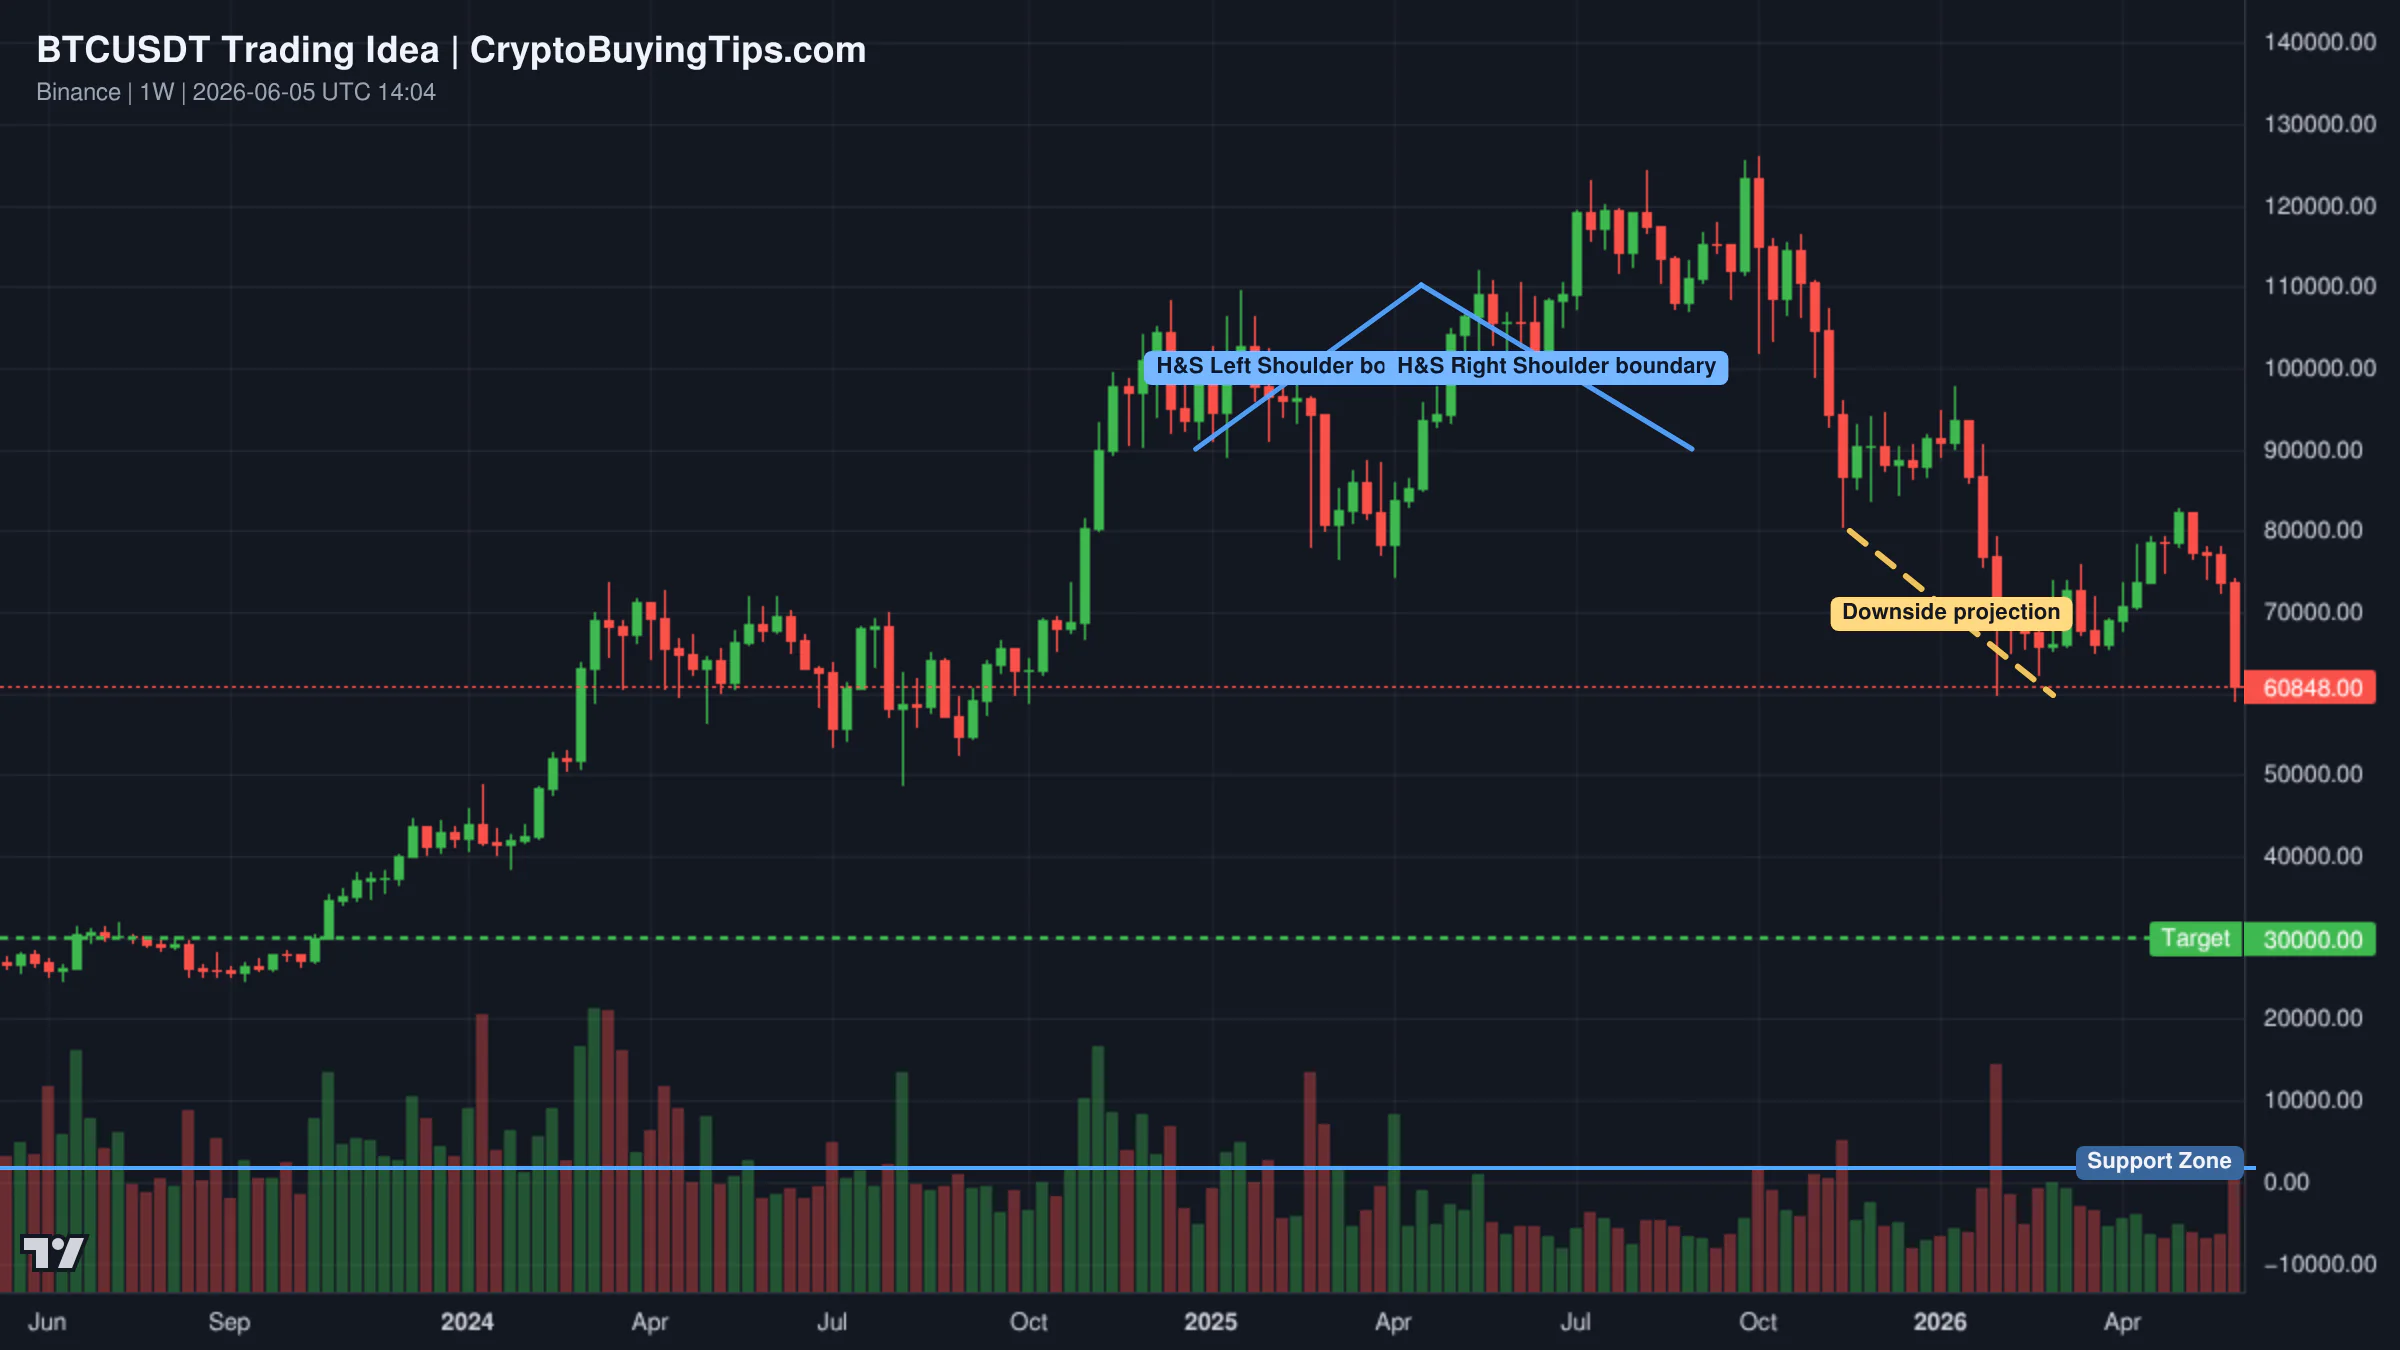
Another view focuses on a completed Head and Shoulders pattern after the rejection from all-time highs. This analysis argues that Bitcoin is revisiting a key demand area from the 2022-2023 accumulation phase. If this zone holds, the current move is a correction. However, if heavy selling pressure causes a breakdown of this support, the downside target could be as deep as $30,000.
A more aggressive bullish take suggests that the bearish move starting May 6 is ending now. This view posits that Bitcoin could turn bullish again on June 6, mirroring a previous three-month rally. The suggestion is to accumulate everything below $70,000 for a potential run that lasts until September 2026.
Smart Money Signals — Hyperliquid Leaderboard
High-conviction traders on Hyperliquid are taking opposing sides of the current volatility. One trader with a 386% 30-day ROI opened a SHORT position in BTC at $60,877 with a notional value of $304,385. This align with the current bearish momentum and the institutional outflows seen in ETF data.
Conversely, another trader with a 112% 30-day ROI has opened a LONG position in HYPE at $68.307, with a notional value of $100,000. This suggests some smart money is looking for recovery plays in specific ecosystem tokens despite the broader market crash.
What to watch next
The immediate focus is on whether Bitcoin can hold the $60,000 level. A confirmed drop below this could trigger further liquidations, given the $417.79B in open interest for perpetuals. Traders should monitor the US Spot ETF flows; until the 30-day average turns positive, institutional demand will remain a headwind.
Additionally, the outcome of the House hearing on Tuesday regarding the new crypto tax bills will be a key sentiment driver. The market is also waiting to see if the Zcash vulnerability is an isolated incident or if other major protocols are exposed. With the Fear and Greed Index at 13, the market is primed for a bounce, but that will require a catalyst to reverse the current institutional exodus.
Some links in this article may be affiliate links. We may earn a commission at no extra cost to you — this never influences our analysis or coverage.
Sigrid Voss
Crypto analyst and writer covering market trends, trading strategies, and blockchain technology.
More Articles
Crypto Market Overview | Volume collapse masks marginal gains amid regulatory noise | July 26, 2026
Volume collapse masks marginal gains amid regulatory noise Crypto market overview for July 26, 2026 data points.

BitMart is shutting down and the CEX risk is back
Another platform blinking lights reminds us what happens when liquidity dries up entirely; derivatives activity has…
Crypto Market Overview | speculative retreat amid sanctions and low on-chain activity | July 25, 2026
The crypto market retreats amid sanctions news and low on-chain activity; see our overview of current metrics.
Crypto Market Overview | leverage bets meet macro pressure amid institutional shifts | July 24, 2026
The crypto market overview shows leverage bets meeting macro pressure as institutional shifts drive volume amid fear…