

Ethereum is pricing in drama while Bitcoin stays bored. Here is the risk
The current implied volatility gap, with Ethereum showing a reading of 51.41 against Bitcoin's 38.17, suggests that risk appetite is unevenly distributed across major assets. While the broader market is stuck in a state of Fear with a Fear and Greed index of 37, the options market is telling two very different stories. Bitcoin is behaving like a sleepy institutional bond, while Ethereum is pricing in the kind of swings that usually precede a major move. For a beginner, understanding what is crypto implied volatility explained is the difference between guessing where the price goes and knowing how much the market expects it to move. We previously covered related angles in Ethereum market share vanishes and BTC dominance data analysis.
How does what is crypto implied volatility explained work?
Implied volatility, or IV, is not a measure of what has already happened. It is a forward-looking metric that reflects the market's expectation of future price swings over a specific period. If you think of historical volatility as a rearview mirror, implied volatility is a weather forecast. It is derived from the current price of options contracts; when traders are willing to pay more for options, it is because they expect a large move, which pushes the IV higher.
Our proprietary data feed shows Ethereum’s implied volatility is significantly elevated at 51.41 compared to Bitcoin's 38.17. This gap means that while the market expects Bitcoin to remain relatively stable, it is pricing in far more potential drama for Ethereum. High IV does not tell you the direction of the move, only the expected magnitude. It is the market's collective bet that the current quiet won't last.
In simple terms, when IV is high, the market is pricing in a "big event." When it is low, the market expects a grind. The fact that Ethereum is pricing in significantly more volatility than Bitcoin suggests that traders see ETH as the primary vehicle for risk or reward in the current environment.
Low gas fees and the risk paradox
Usually, high volatility is accompanied by high network activity. People scramble to move funds, hedge positions, or chase a pump, which sends gas fees soaring. However, we are seeing a strange divergence. Our signal scanner flagged the low gas fees as an indicator that on-chain activity is currently subdued, with ETH gas sitting at a negligible 0.07 Gwei.
This creates a risk paradox. On one hand, the on-chain data suggests a ghost town. There is very little immediate utility demand or frantic trading happening on the Ethereum network. On the other hand, the options market is pricing in high volatility. It is the equivalent of a silent room where everyone is holding their breath.
When gas is this low, it often means the market is in a state of equilibrium or total apathy. But when that apathy is paired with a high IV reading of 51.41, it suggests that the "smart money" in the derivatives market is anticipating a catalyst that the spot traders have not yet reacted to. This is often where the most disorderly moves happen, because the spot market is unprepared for the volatility the options market has already priced in.
Shifting risk profiles and the role of beta
To understand why this gap matters, we have to look at Beta. In finance, Beta measures how much a specific asset moves relative to a benchmark, which in this case is Bitcoin. If an asset has a Beta of 1, it moves in lockstep with Bitcoin. A Beta greater than 1 means the asset is more volatile than the benchmark.
Ethereum typically has a Beta higher than 1. When Bitcoin moves 2%, Ethereum often moves 3% or 4%. This inherent sensitivity is why the volatility gap is so telling. With BTC dominance at 52.1% and ETH dominance at 9.3%, Bitcoin is currently the anchor of the market. Most capital is consolidating in the largest asset to avoid risk.
The divergence in volatility readings points to a temporary decoupling of perceived risk levels. Our news scoring system rated the current implied volatility gap 8/10 for market impact because it highlights a shift in the asset risk profile. Traders are not just treating ETH as a "faster version of BTC" right now. They are pricing it as a separate risk event.
When Beta is high and IV is spiking, the risk for a beginner is the assumption that ETH will simply follow BTC. If Bitcoin stays quiet but Ethereum's IV remains high, ETH can move violently in either direction regardless of what Bitcoin does. This is the danger of the "Beta trade" in a fragmented market.
What we're watching next
The current setup is a classic example of a coiled spring. We have extreme low network activity (0.07 Gwei) paired with high expectations of movement (51.41 IV). This rarely lasts.
We are watching for two specific triggers. First, a spike in gas fees. If we see gas move from 0.07 Gwei back toward 20 or 30 Gwei, it means the anticipated volatility has finally hit the spot market. Second, we are watching the IV gap. If Bitcoin's IV begins to catch up to Ethereum's, it suggests the volatility is becoming a macro event rather than an asset-specific one.
For now, the data suggests that Ethereum is the place where the market expects the next shock to happen. Whether that shock is a recovery or a further slide is still undecided, but the options market is certainly not betting on a boring afternoon.
Some links in this article may be affiliate links. We may earn a commission at no extra cost to you — this never influences our analysis or coverage.

Sigrid Voss
Crypto analyst and writer covering market trends, trading strategies, and blockchain technology.
More Articles
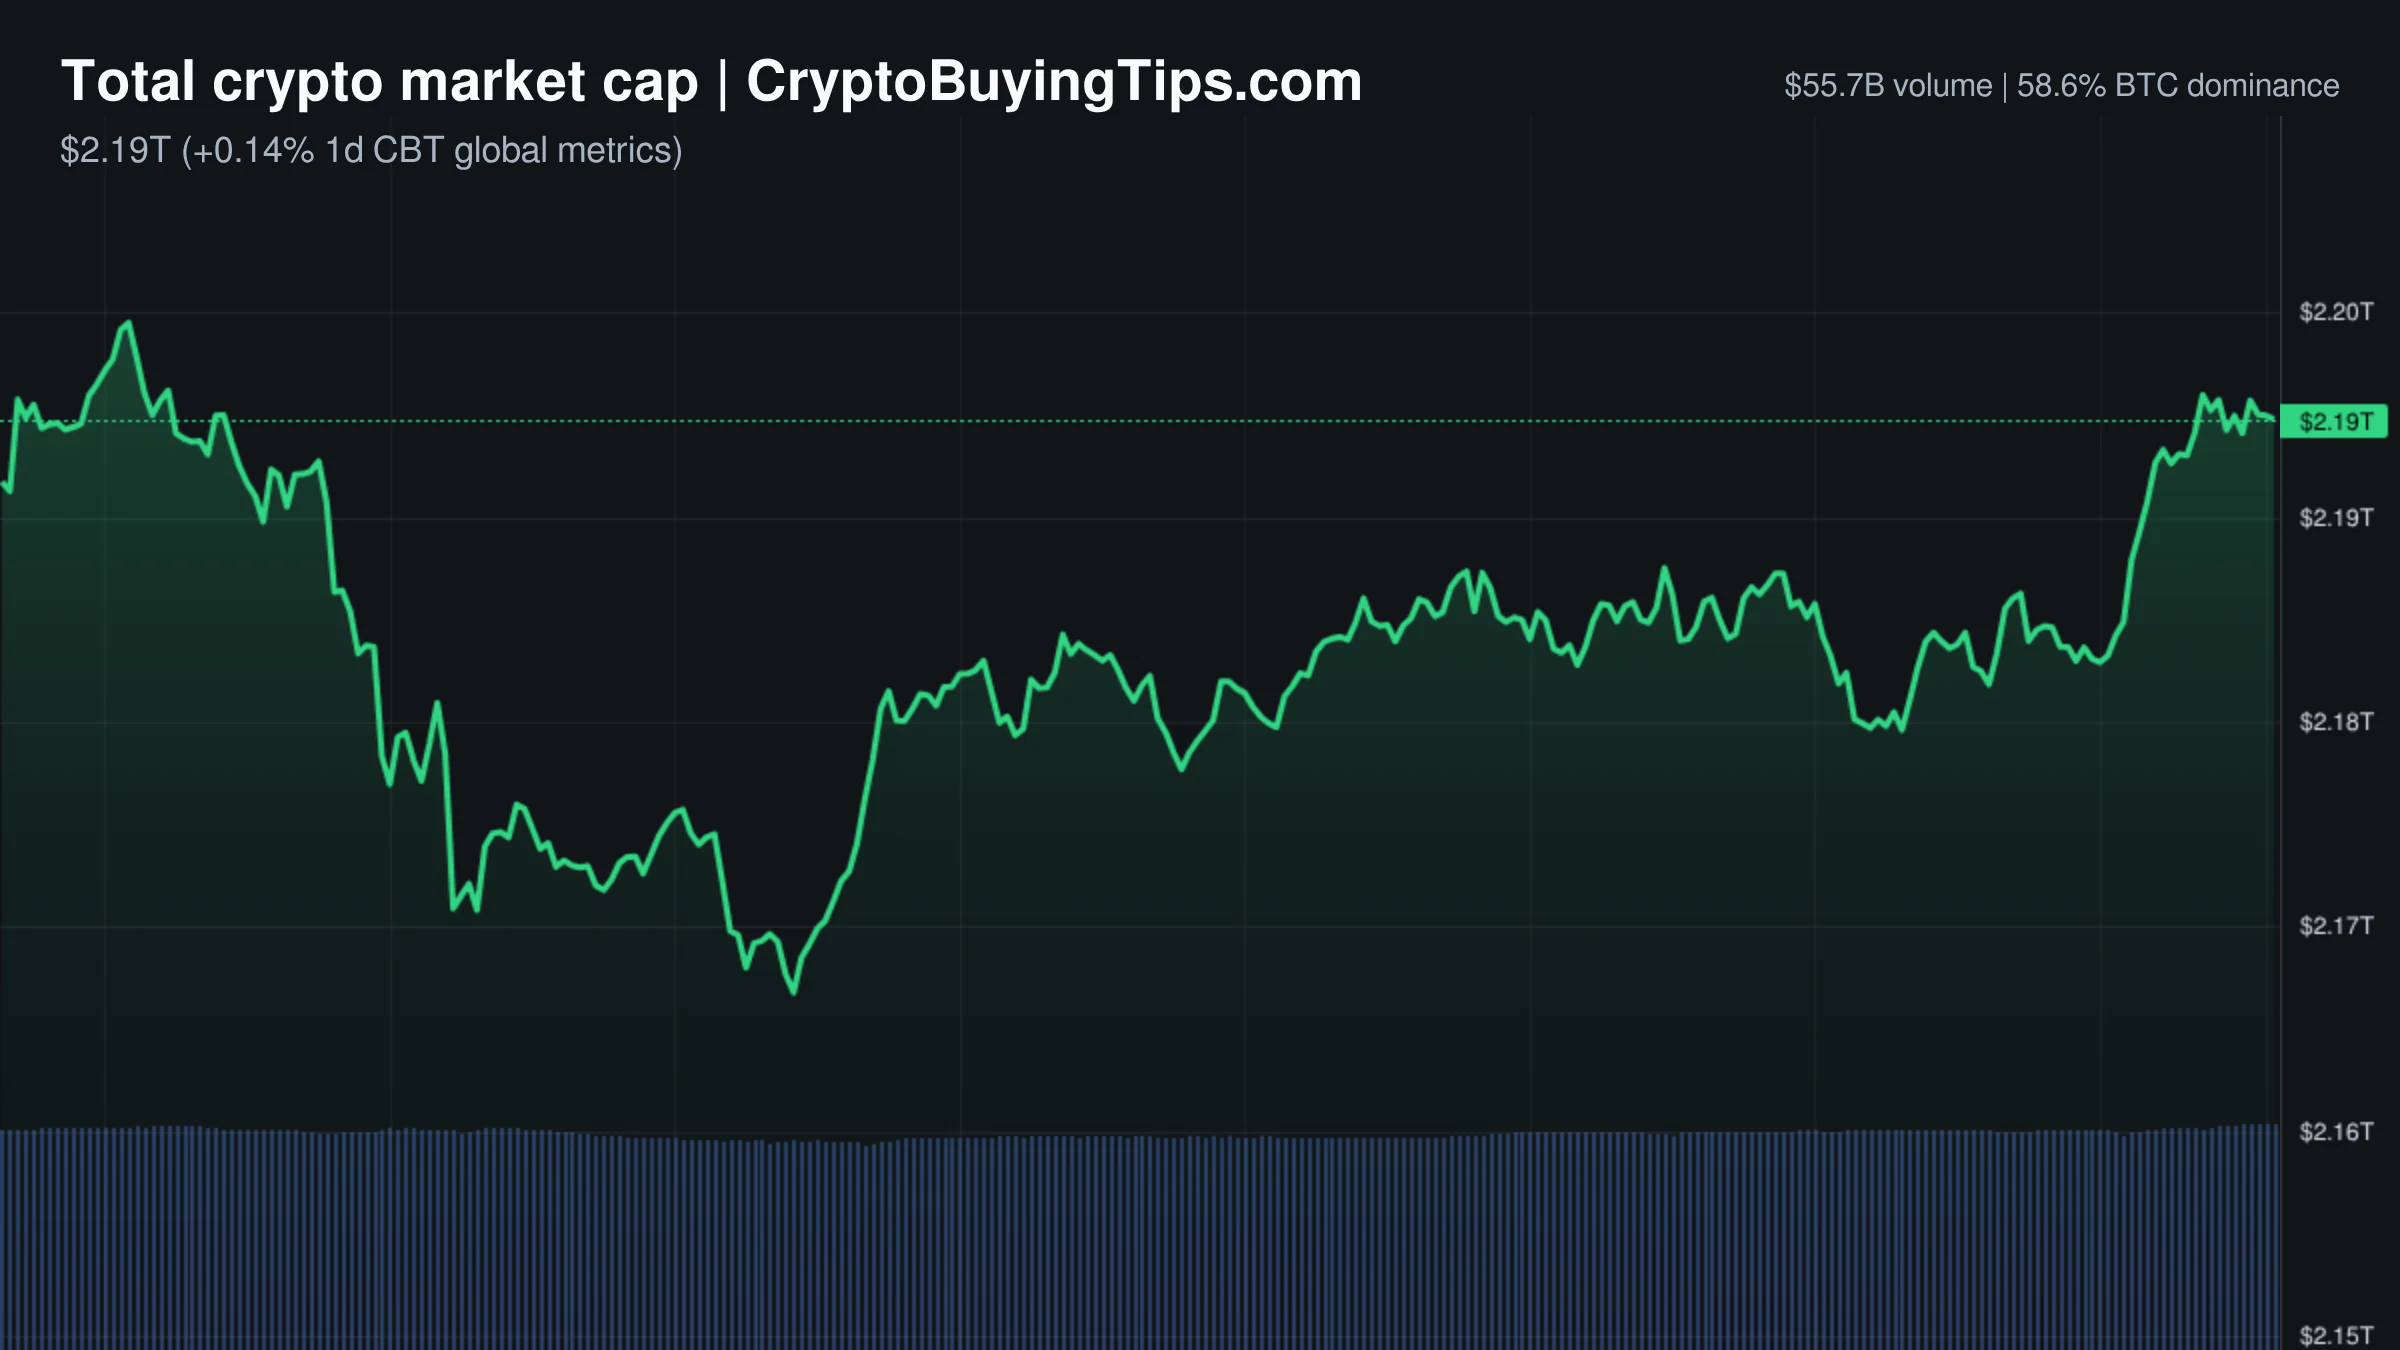
Crypto Market Overview | Derivatives volume dwarfs spot activity amid regulatory uncertainty and institutional rotation into bitcoin | August 12, 2026
Derivatives volume dwarfs spot activity amid regulatory uncertainty and institutional rotation into bitcoin on August…
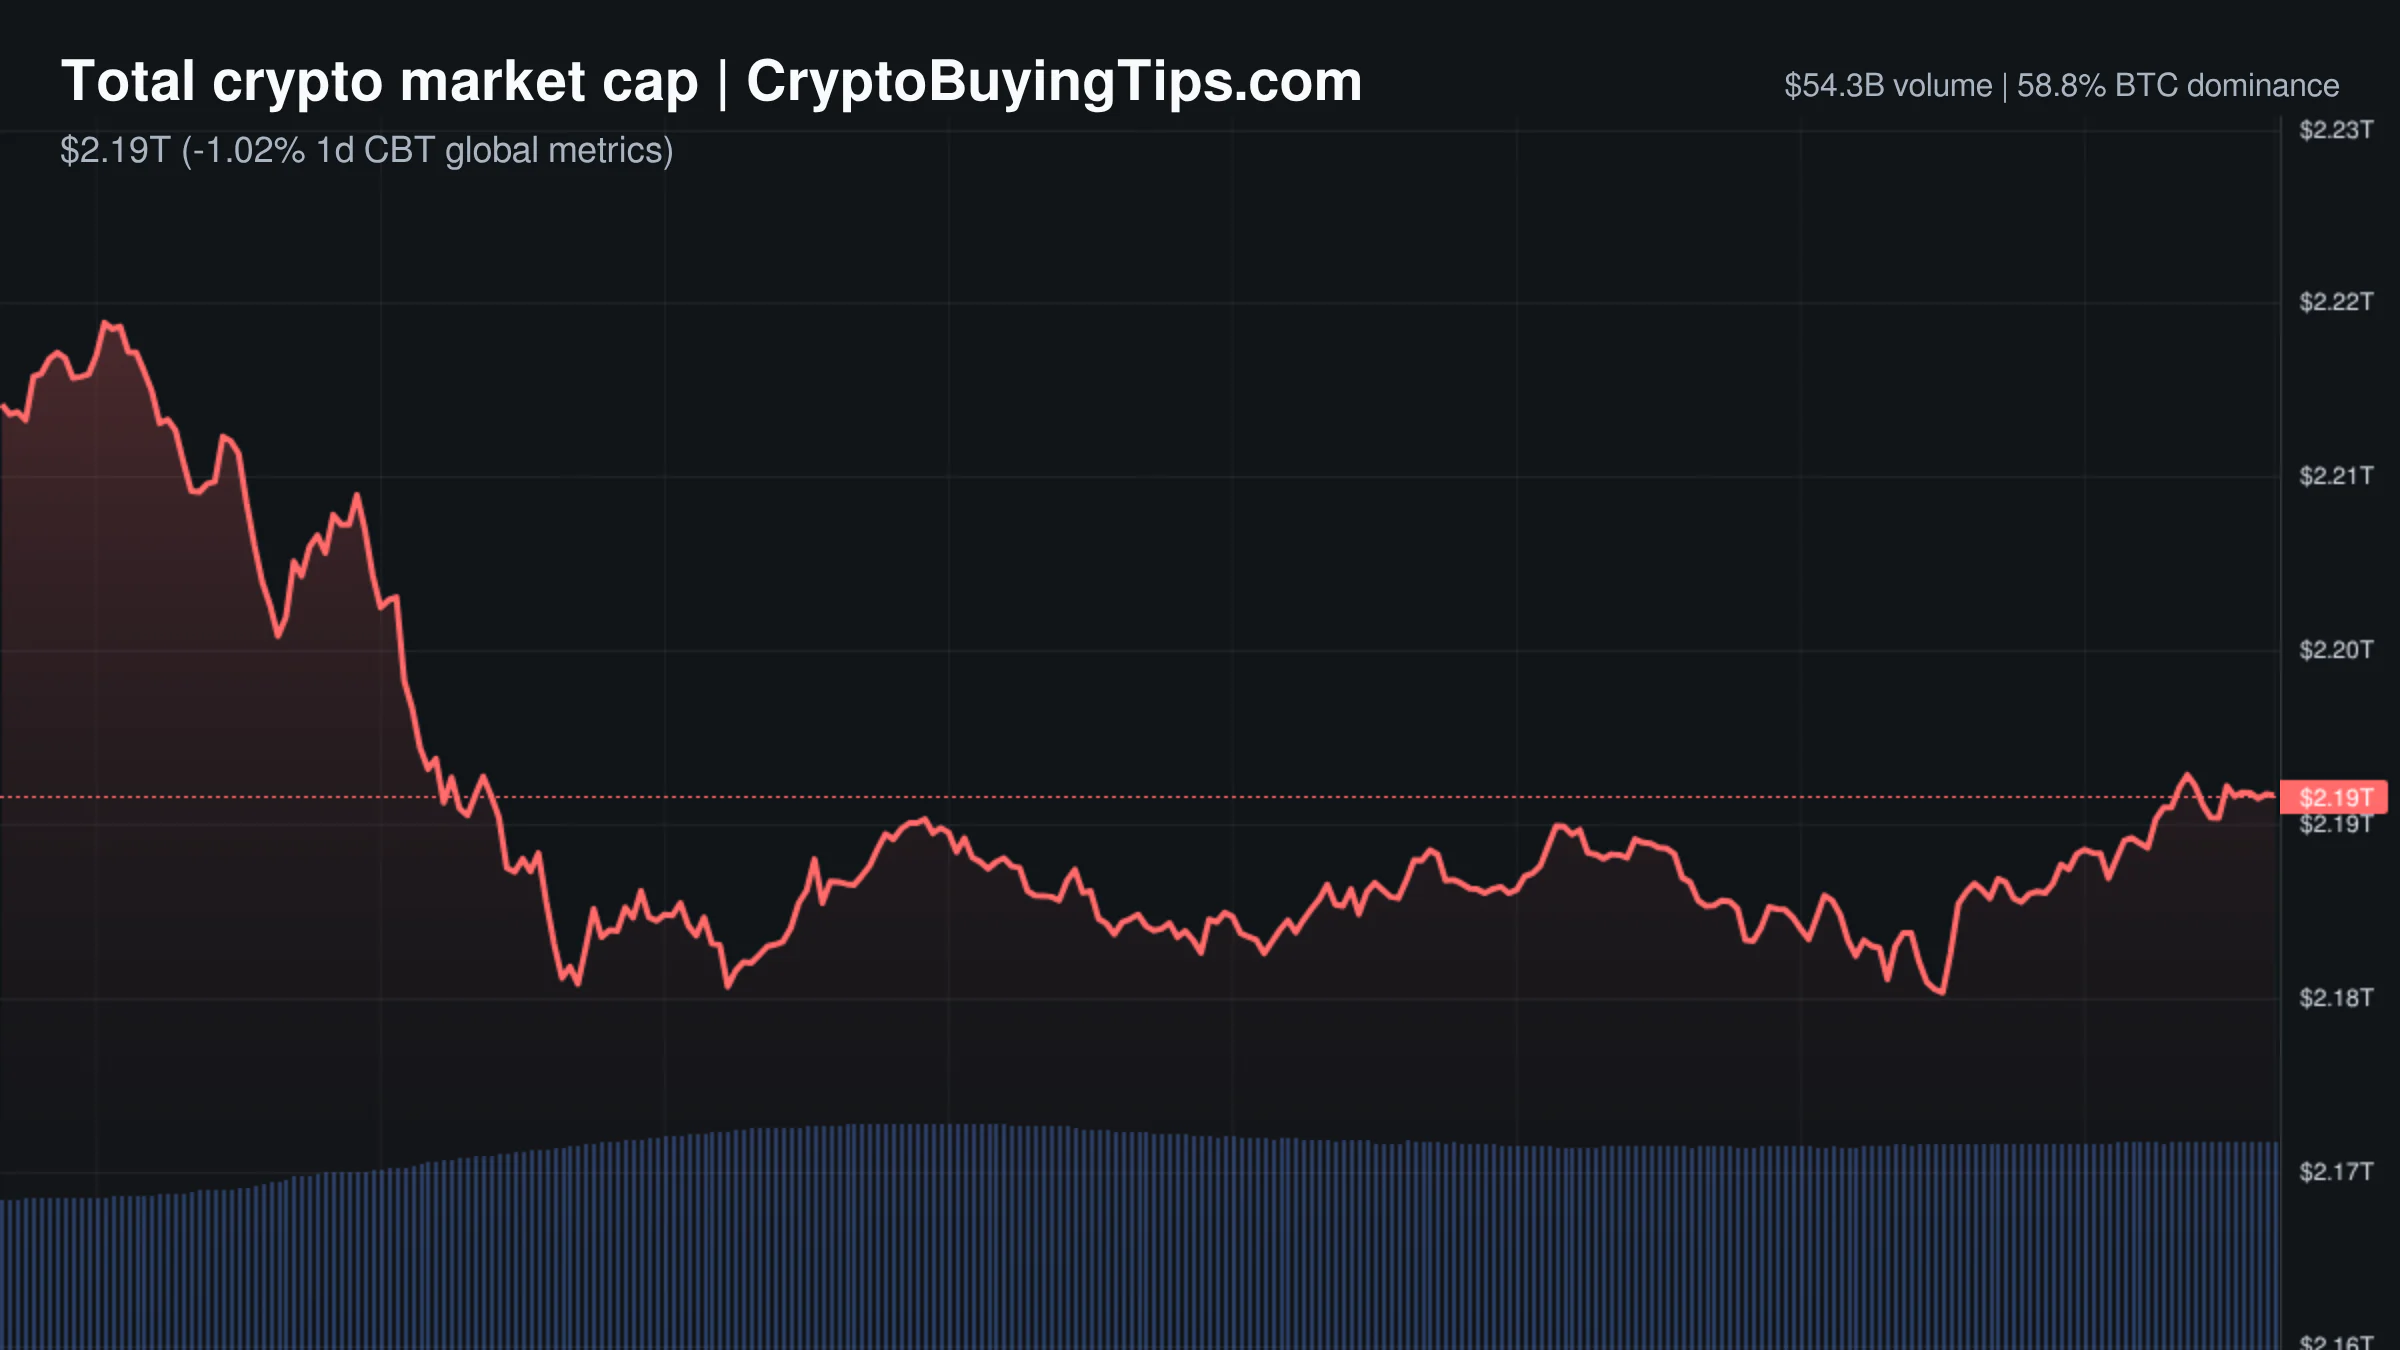
Crypto Market Overview | Volume surges as prices slip amid regulatory shifts | August 11, 2026
Crypto market overview shows volume surging despite price slips amid regulatory shifts; see our data read on leverage…
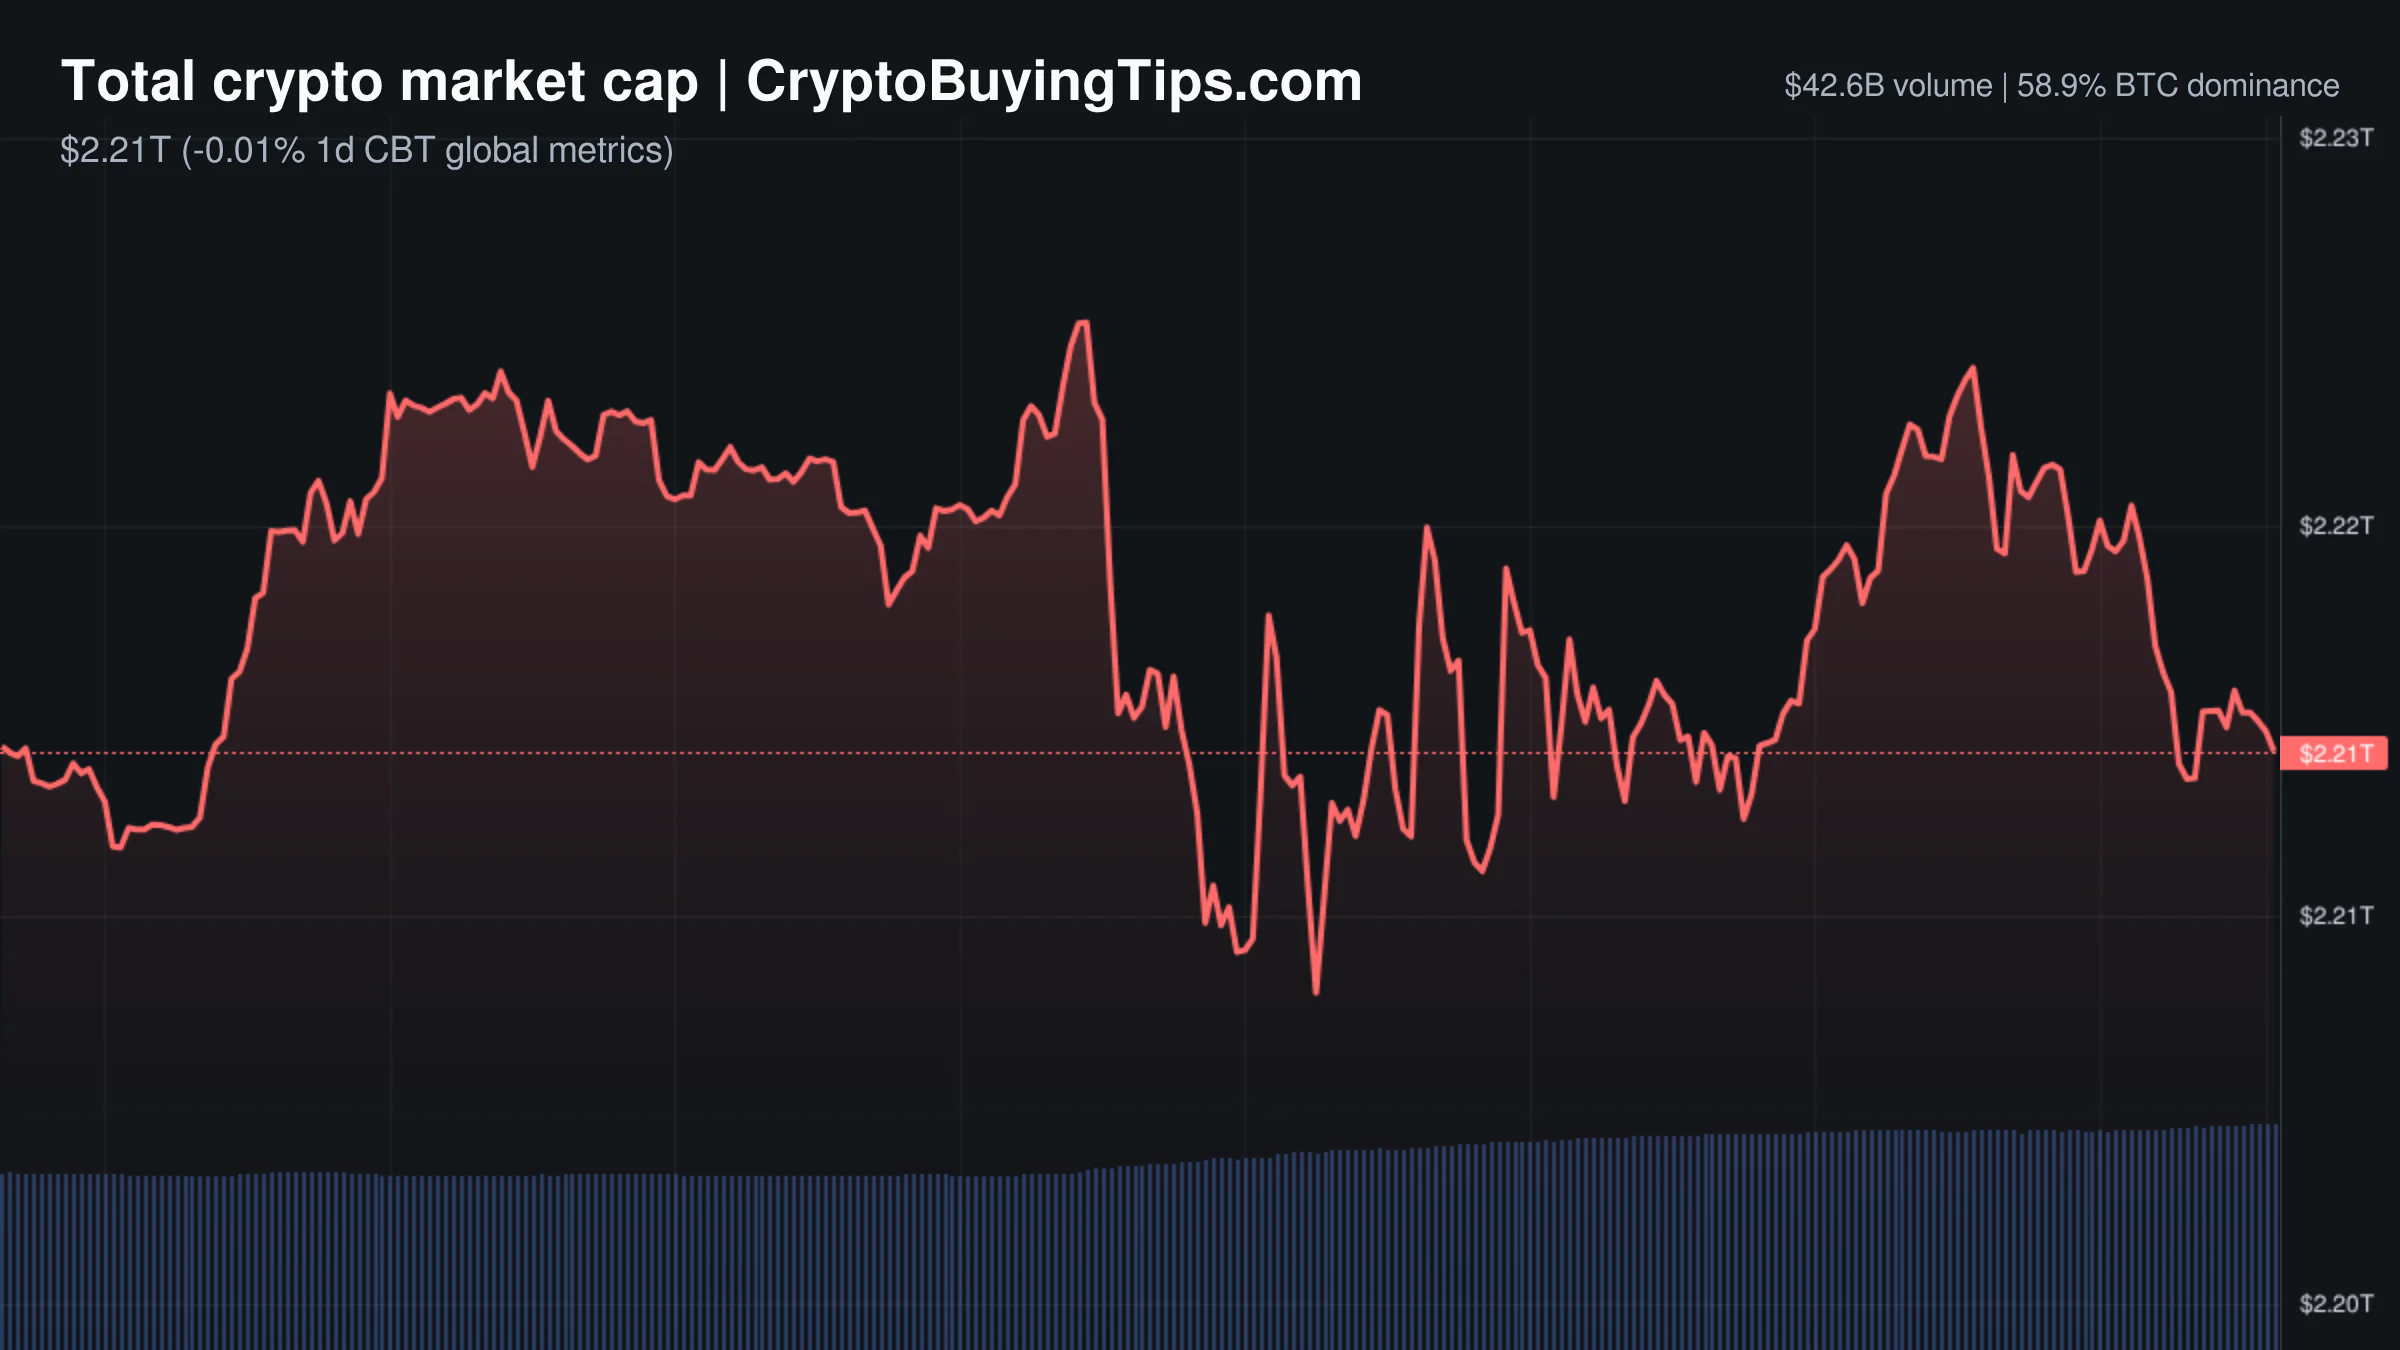
Crypto Market Overview | Derivatives volume dwarfs spot activity amid institutional ETF inflows | August 10, 2026
Derivatives volume dwarfs spot activity amid institutional ETF inflows provides a market overview of current crypto…
100 projects just folded. Here is where the money went
Another hundred protocols folded because they were built on pitch decks rather than users. Our read suggests this…