Market Overviews

Daily crypto market overviews, trend analysis, and key updates from our editorial team.

Crypto Market Overview | leverage trading dominates market action despite institutional news flow | July 17, 2026
Sigrid Voss·

Crypto Market Overview | leverage trading dominates market action despite institutional news flow | July 17, 2026

Market overview

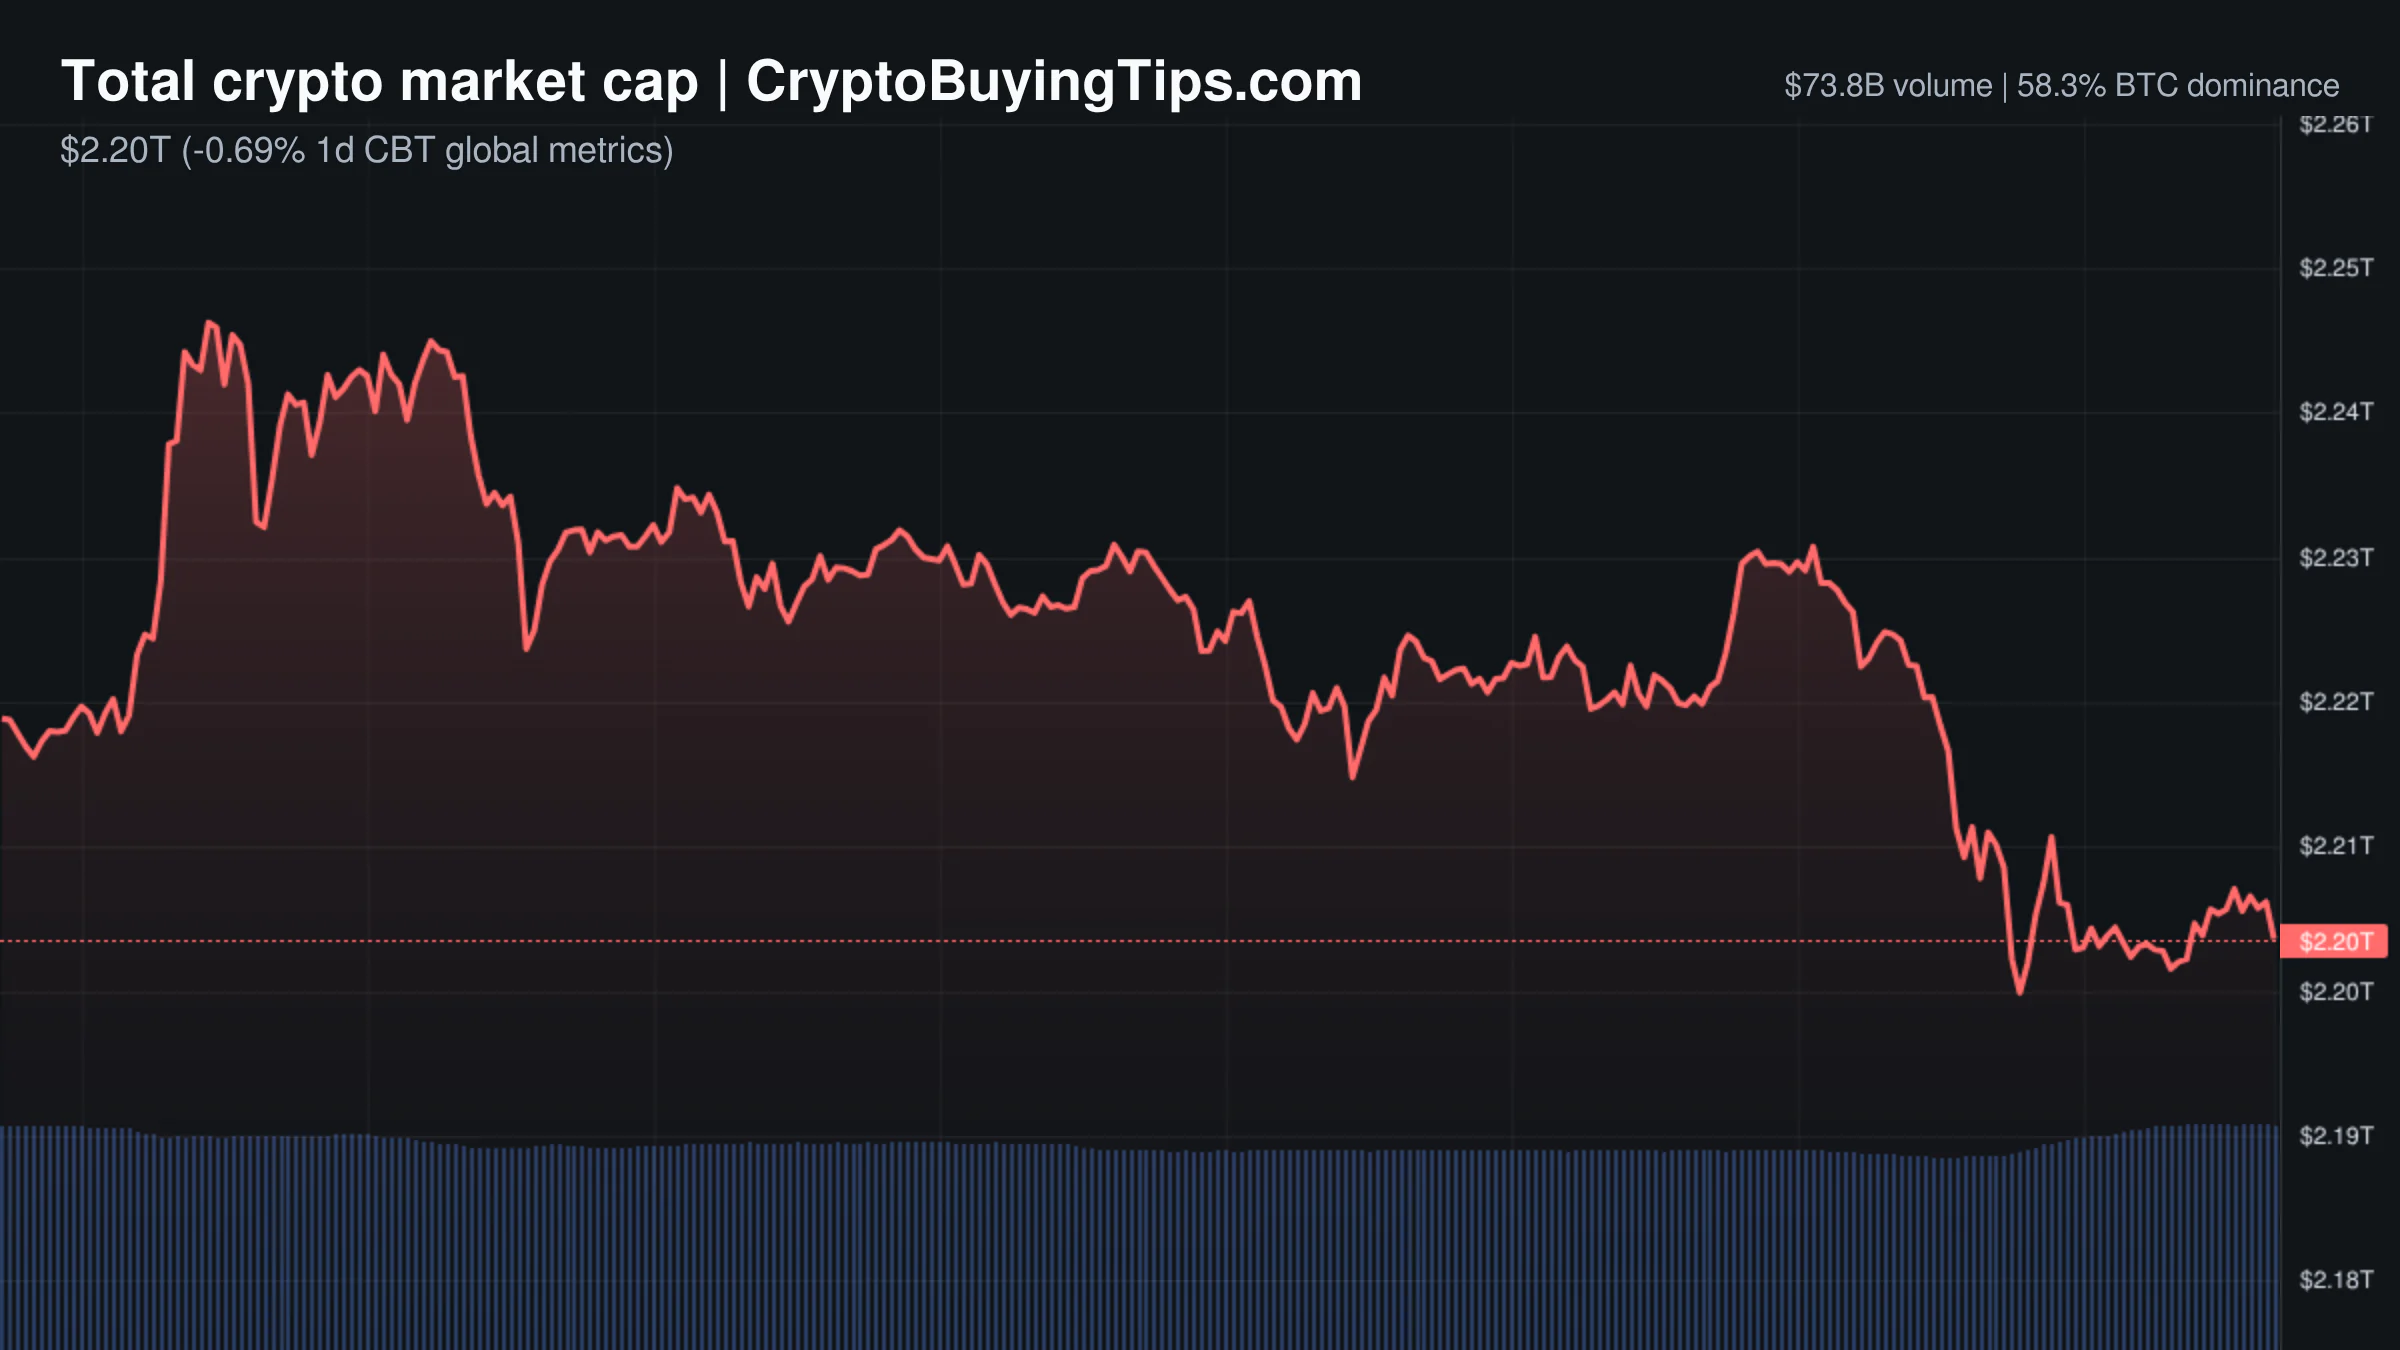
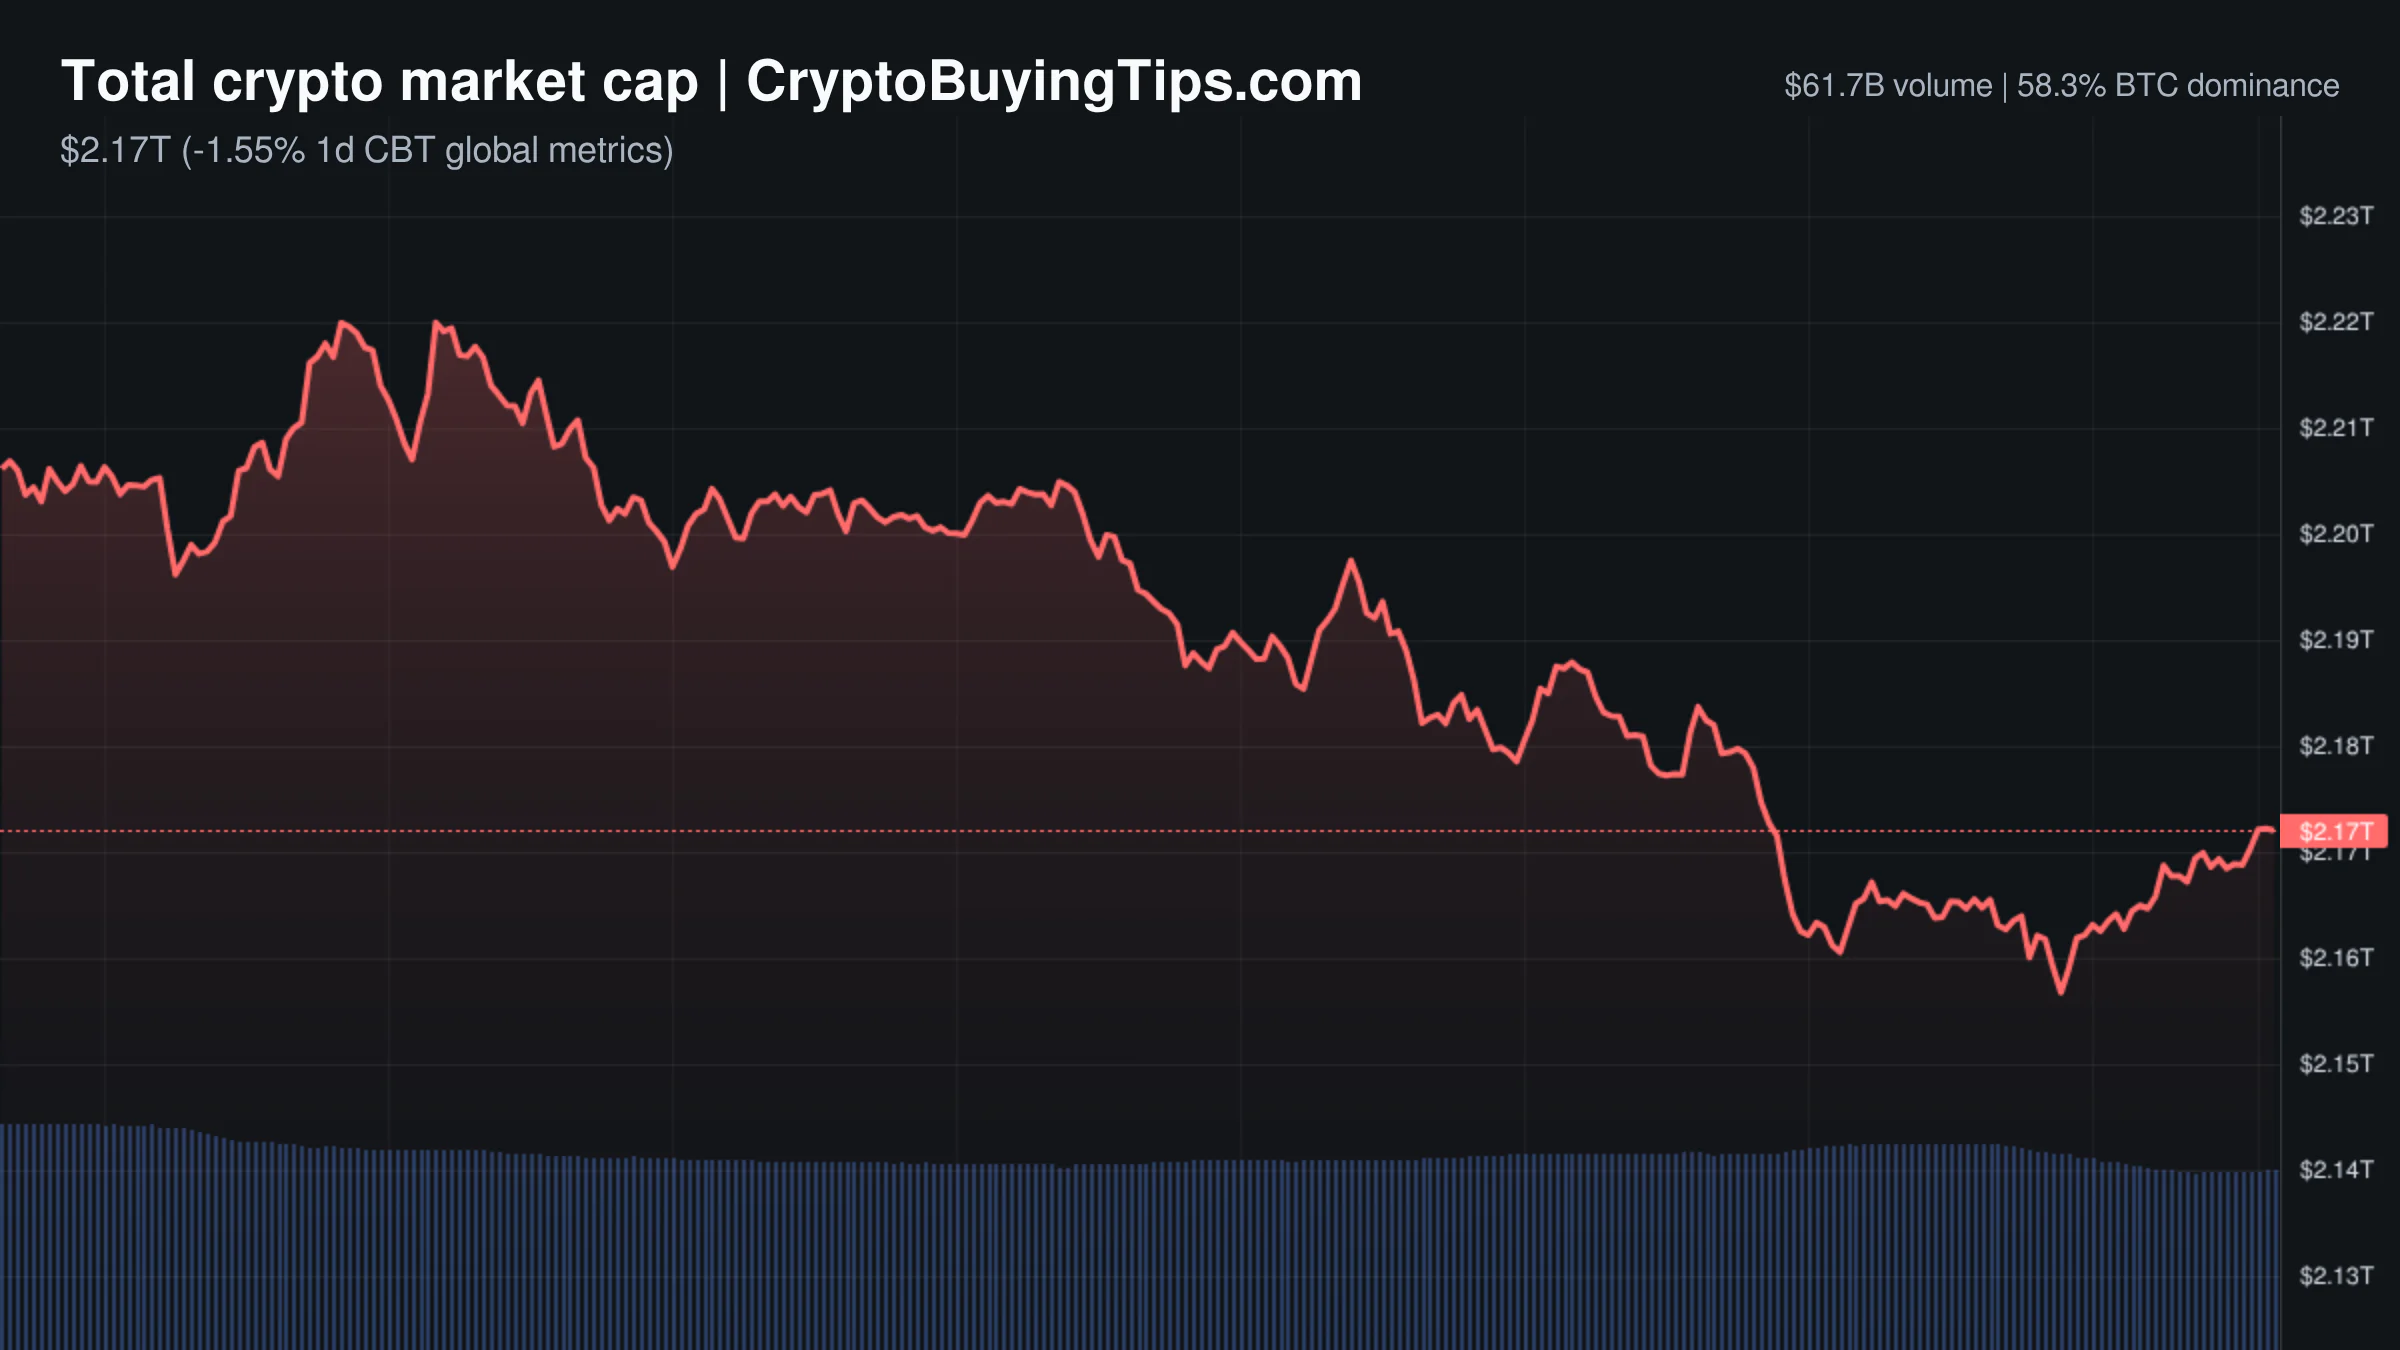
The crypto market is currently caught in a strange contradiction. We have a stream of institutional adoption news that would have sent prices soaring in 2021, yet the actual price action is stubbornly bearish. The total crypto market cap has dipped to $2.26T, a 1.51% decline in the last 24 hours. Sentiment has soured further, with the Fear and Greed Index sitting at 31. This is a textbook fear environment, and the data suggests the market is more interested in the exit than the entrance.

The most concerning metric is the massive divergence between spot and derivatives volume. While spot trading volume is a modest $61.66B, derivatives volume is a staggering $655.16B. This means the current market is driven by leverage at a ratio of more than 10 to 1. When a market is this heavily weighted toward derivatives, price moves are rarely about fundamental value and almost always about who is getting liquidated. The 16.46% drop in stablecoin volume further suggests that new capital isn't rotating into assets. Instead, traders are likely just shuffling their leveraged bets.

Bitcoin dominance remains high at 56.15%, while Ethereum dominance has slipped to 9.83%. This suggests that in a risk-off environment, capital is retreating to the perceived safety of Bitcoin rather than diversifying into altcoins. The Altcoin Season Index is neutral at 55, meaning we are in a holding pattern where neither the flagship asset nor the smaller caps have a clear lead.

Bitcoin and Ethereum

Bitcoin is trading at $63,126.94, down 1.57% over the last day. The asset is struggling to maintain momentum after a failed attempt to break higher. The lack of spot accumulation is evident. While institutional products are making headlines, the actual flow of capital is shifting. We are seeing a market that is hesitant to buy the dip, preferring to wait for a clearer signal from macro indicators or a definitive break of current support levels.

Ethereum is in a worse position, falling 2.61% to $1,836.39. The network data is particularly grim. Gas fees are extremely low, with slow transactions at 0.09 Gwei and fast ones at 0.11 Gwei. Low gas fees are usually a sign of efficiency, but in this context, they signal a lack of demand. The network is essentially a ghost town. This lack of on-chain activity makes the current price levels feel fragile. We previously covered how Ethereum market share vanishes as the narrative shifts, and today's data supports that trend.

Top crypto prices

The broader market is seeing a synchronized slide. BNB is down 2.29% at $563.88, and XRP has fallen 1.83% to $1.08. Solana is also retreating, trading at $74.76, a 1.78% drop. TRON has proven slightly more resilient, dipping only 0.33% to $0.3220.

The most notable loser among the top assets is Hyperliquid, which has plummeted 8.17% to $60.34. This is a sharp correction for an asset that has recently been a favorite for institutional portfolios.

News driving today's market

The news cycle is dominated by TradFi giants moving into the space, but the market is treating these updates as "priced in" or irrelevant to the short-term trend. T. Rowe Price, managing $1.9 trillion, has launched the TKNZ Active Crypto ETF. This is a significant move because it is an actively managed fund that can shift weight between BTC, ETH, and others like HYPE based on market conditions. We previously discussed how active crypto management could change the game for altcoins, yet the immediate reaction has been a price drop.

Visa has also stepped up its game by unveiling a stablecoin platform for banks and fintechs. By supporting Open USD and integrating minting and redemption into a single system, Visa is attempting to build the plumbing for institutional digital dollars. This is a long-term win for the industry, but it does little to stop the current bleeding in spot prices.

Further legitimacy comes from Morgan Stanley, which has enabled Bitcoin, Ethereum, and Solana trading on E*Trade via Zero Hash. Simultaneously, Citadel Securities has invested $400M into Crypto.com at a $20B valuation. On paper, the industry has never looked more professional. In reality, the prices are falling.

Regulatory news remains a mixed bag. The split between the SEC and CFTC continues to create a cautious atmosphere. Injective is attempting to carve out a regulated path by filing for SEC transfer agent registration to bring securities records on-chain. There is also optimism regarding a potential crypto bill in the US, though conflicts of interest involving Trump continue to complicate the timeline.

Social intelligence

The social sentiment is a clash between macro optimism and on-chain reality. On the positive side, there is talk of Japan opening the door to Bitcoin ETFs, which could bring a massive new wave of institutional demand. Meanwhile, Polymarket traders are nearly certain (95.7% probability) that the Fed will leave interest rates unchanged at its July meeting. A hold is generally seen as neutral to bullish for risk assets.

However, the on-chain data is far more sobering. Reports indicate that Bitcoin ETF flows have completely flipped. While 2024 saw net inflows of over 500,000 BTC, 2026 has seen cumulative net outflows of roughly 120,000 BTC. This is a critical shift. The institutional "buy and hold" phase appears to have transitioned into a "sell and hedge" phase.

In the altcoin space, Binance has announced the listing of Aerodrome’s AERO with a Seed Tag. As the central liquidity hub for Base, AERO is a key asset to watch, and a Binance listing usually provides a temporary liquidity spike.

Trading ideas worth watching

Bitcoin is currently showing a bearish market structure shift. After a failed breakout attempt, sellers have stamped a clean break below the 64,279 zone. The immediate gameplan is to watch for any retest into the 64,279 to 64,400 supply zone. If that area holds as resistance, the path is open toward the 61,600 demand zone, with a deeper target of 58,610 if momentum continues. The trade remains active as long as price stays below 64,400.

Redrawn ONDOUSDT 480 trading idea chart for ONDO Breakout After Major RWA News — Is Another 20% Rally Next?Trading idea chart: BTCUSDT - BTC – Bearish MSB After Failed Breakout, Eyes on 61,600 & 58,610

ONDO is providing a rare bullish contrast. The token surged 17% to 20% following news that the DTCC is facilitating tokenized stock representations. This creates real digital twins of securities on-chain, which is a genuine catalyst for the Real World Asset (RWA) narrative. Technically, ONDO has broken the upper trendline of a falling wedge pattern on the 8-hour timeframe. If it can clear the 0.385 to 0.395 resistance zone, a move toward 0.433 or even 0.54 is possible.

Ethereum is facing a strong rejection near 1,940. This has triggered a shift in market structure to the downside on lower timeframes. The bearish scenario involves a retest of the 1,820 to 1,840 zone to fill the imbalance from the recent drop. If that supply holds, the target is 1,720, with a potential full sweep down to the 1,580 demand zone.

Smart Money Signals — Hyperliquid Leaderboard

Hyperliquid SHORT BTC leaderboard chartHyperliquid LONG BTC leaderboard chart

Our tracker for the Hyperliquid leaderboard shows significant directional conviction from top traders. A high-confidence trader (0x10b4c1), who boasts a 213% 30-day ROI, has opened a substantial short position in BTC at an entry price of $64,530. The notional value of this trade is $322,650.

This is a telling signal. The trader had previously been long at $64,486, but the flip to a short at a slightly higher price suggests they believe the local top is in. When traders with this level of PnL consistency pivot their bias, it usually indicates that the path of least resistance is now down.

Altcoin Spotlight

ONDO deserves attention today because it is actually reacting to its fundamentals. While most of the market is sliding, ONDO is benefiting from the DTCC tokenization news. This isn't just another "partnership" announcement; it is a structural bridge between the largest U.S. securities clearinghouse and the blockchain. In a market where "institutional adoption" is mostly just ETF filings, a project that actually integrates with clearinghouse infrastructure stands out. The volume support behind the falling wedge breakout suggests this isn't a retail pump but a repositioning by those who understand the RWA trade.

What to watch next

The market is currently in a state of cognitive dissonance. We are seeing a "corporate makeover" of the industry with T. Rowe Price, Visa, and Morgan Stanley all adding legitimacy, yet the capital is flowing out of the Bitcoin ETFs. This suggests that the "smart money" is no longer buying the PR.

The key for the next few days is the 64,400 level for Bitcoin. If we cannot reclaim that zone, the bearish market structure shift is confirmed, and a slide toward 61,600 is likely. For Ethereum, the priority is whether the 1,800 level can hold or if we are headed for a 1,580 sweep.

Keep an eye on the Fed's July meeting. While the market expects a hold, any hint of a hawkish tilt would be disastrous for a market already struggling with a 10:1 leverage ratio. When the casino is this full of leveraged longs, the slightest bit of bad news can trigger a disorderly liquidation event.

Crypto Market Overview | Speculative retreat meets institutional tokenization in market plumbing | July 16, 2026
Sigrid Voss·

Crypto Market Overview | Speculative retreat meets institutional tokenization in market plumbing | July 16, 2026

Market overview

The market is in a contradictory mood. We see a Fear and Greed Index of 34, which firmly places the current sentiment in "Fear" territory. This is odd given that the institutional news cycle is almost aggressively bullish. While retail traders are seemingly staring at the exit, the plumbing of global finance is being rewritten.

The total market cap sits around $2.21 trillion, down slightly by 0.49% over the last 24 hours. Volume is stagnant. Spot activity has barely moved, but the derivatives market is shrinking. A 11.17% drop in derivatives volume to $713.23 billion suggests a significant contraction in speculative interest. Traders are not just selling, they are stopping.

Bitcoin dominance is high at 58.31%. This indicates a flight to quality. When fear hits, capital retreats from the periphery and hides in the king. The Altcoin Season Index is 46, which is neutral. There is no rotation happening. Money is not moving into alts, and it is not aggressively fleeing them. It is simply waiting.

Bitcoin and Ethereum

Bitcoin is trading at $64,144.35, down 0.72% on the day. The price action is sluggish. The high dominance suggests that BTC is the only place investors feel safe, but there is no real bid to push it higher. We are seeing a market that is cautious.

Ethereum is at $1,885.82, managing a slight gain of 0.48%. The price is an irrelevant metric compared to the network activity. Gas fees have plummeted to between 0.08 and 0.09 Gwei. The network is essentially a ghost town. Low fees are usually good for users, but in this context, they signal a total lack of demand for throughput. We previously covered how Ethereum market share vanishes while the protocol receives a corporate polish. The data shows that the polish is not attracting new users.

Top crypto prices

Bitcoin holds the top spot at $64,144.35. Ethereum follows at $1,885.82. BNB is trading at $577.14. XRP is flat at $1.1. Solana has slipped to $76.11, down 1.55%. TRON is at $0.3231. Hyperliquid has seen the sharpest drop among the top assets, falling 3.26% to $65.72.

News driving today's market

The headline story is the DTCC moving tokenized securities into live trading. This is not another pilot in a closed sandbox. The Depository Trust and Clearing Corporation processed live trades involving tokenized stocks, ETFs, and U.S. Treasurys. JPMorgan, BlackRock, and Goldman Sachs are all involved. This is a massive validation of the technology. We have previously discussed tokenized stocks for investors, but this move shifts the narrative from "maybe" to "now". However, our read is that this remains a centralized game. We previously warned about the tokenizing stocks trap where blockchain is used as a more efficient ledger for centralized receipts.

Political catalysts are also in play. A "hugely positive" meeting with Donald Trump to discuss ethics and sweeping crypto legislation is scheduled for Thursday. This suggests a push for regulatory clarity. Similarly, South Korea is modifying a 76-year-old law to classify cryptocurrencies as national assets. Japan has also reclassified crypto as a financial asset. These are structural wins. They de-risk the asset class for institutions.

On the bearish side, the US Treasury froze $131 million in Iran-linked wallets. Tether locked four Tron-based addresses to comply. This is a reminder that the "censorship-resistant" nature of crypto has limits when the US government is involved. Also, Circle suspended Heka Funds over market manipulation concerns involving an $800 million Tether investment. This adds a layer of systemic risk to the stablecoin arbitrage market.

Social intelligence

On-chain data from @Cointelegraph shows that Binance XRP reserves have fallen to 2.61 billion. This is the lowest level since February. When reserves drop, it usually means holders are moving assets to cold storage. This can be a bullish sign of long-term conviction. At the same time, the XRP Ledger has crossed 8 million activated accounts. The network is growing even if the price is stagnant.

In the derivatives space, @lookonchain flagged a whale who deposited 10 million USDC into Hyperliquid to short CXMT. The trader opened a 1x short of $3.8 million and is looking to add another $4.17 million between $8 and $9. This is a targeted bet against a low-cap asset.

Macro sentiment is being influenced by Apple Intelligence receiving regulatory approval in China. This signals a shift in global tech adoption. It generally improves risk appetite across the board. However, @Crazzyblockk via CryptoQuant is warning that exchange leverage is in the top 5% of historical extremes. The current rally is built on borrowed margin. That is a dangerous way to build a floor.

Trading ideas worth watching

One analyst, pejmanzwin, expects [Bitcoin](https://go.cryptobuyingtips.com/BTC?utmsource=dailyOverview) to resume a bearish move. The setup suggests a decline toward the cumulative long liquidation zone between $63,530 and $63,180. The risk is a break below $62,800, which could trigger a deeper correction. The stop loss is set at $66,620. This view aligns with the current "Fear" sentiment and the drop in derivatives volume.

Redrawn BTCUSDT 60 trading idea chart for BTC/USDT: The $67,000 Breakout Confirmation! Redrawn BTCUSDT 240 trading idea chart for Bitcoin Rebounds After CPI—Can Bulls Reclaim the 200_EMA(Weekly)

A more optimistic view from Lingrid suggests a structural breakout. The trade identifies a long zone between $64,200 and $64,800. The goal is a move to $67,000. This setup relies on the idea that market makers have swept the shorts and are now building a support floor. The stop loss is an hourly close below $63,500.

KlejdiCuni believes a two-week correction is ending. This analysis points to a bullish trend resuming with targets at $67,150 and $71,000. This view is supported by the perceived weakness of the US Dollar. It is a bet that the current consolidation is just a breather before the next leg up.

Smart Money Signals — Hyperliquid Leaderboard

Hyperliquid SHORT BTC leaderboard chart

Our tracker shows a high-confidence move from trader 0x10b4c1. This wallet has a 213% 30-day ROI and a total PnL of $232,000. They have opened a short position in BTC at $64,530 with a notional value of $322,650.

This is a significant bet. When a trader with this track record shorts the top, it usually suggests they see a local top or a lack of immediate buyers. It clashes with the bullish TradingView ideas but aligns with the Fear and Greed index.

What to watch next

The focus for the next 24 hours is the US House Financial Services Committee hearing on the CLARITY Act. This hearing will discuss how the act could unlock financial innovation. Regulatory news is the only thing that can currently override the technical stagnation.

We are also watching the $63,000 level for Bitcoin. If the long liquidations hit that zone and the price doesn't bounce, the move becomes disorderly. The gap between the institutional "tokenization" wins and the retail "fear" is wide. Eventually, one of them has to win. For now, the market is just waiting for a reason to move.

Crypto Market Overview | Institutional adoption signals clash with persistent retail fear | July 15, 2026
Sigrid Voss·

Crypto Market Overview | Institutional adoption signals clash with persistent retail fear | July 15, 2026

Market overview

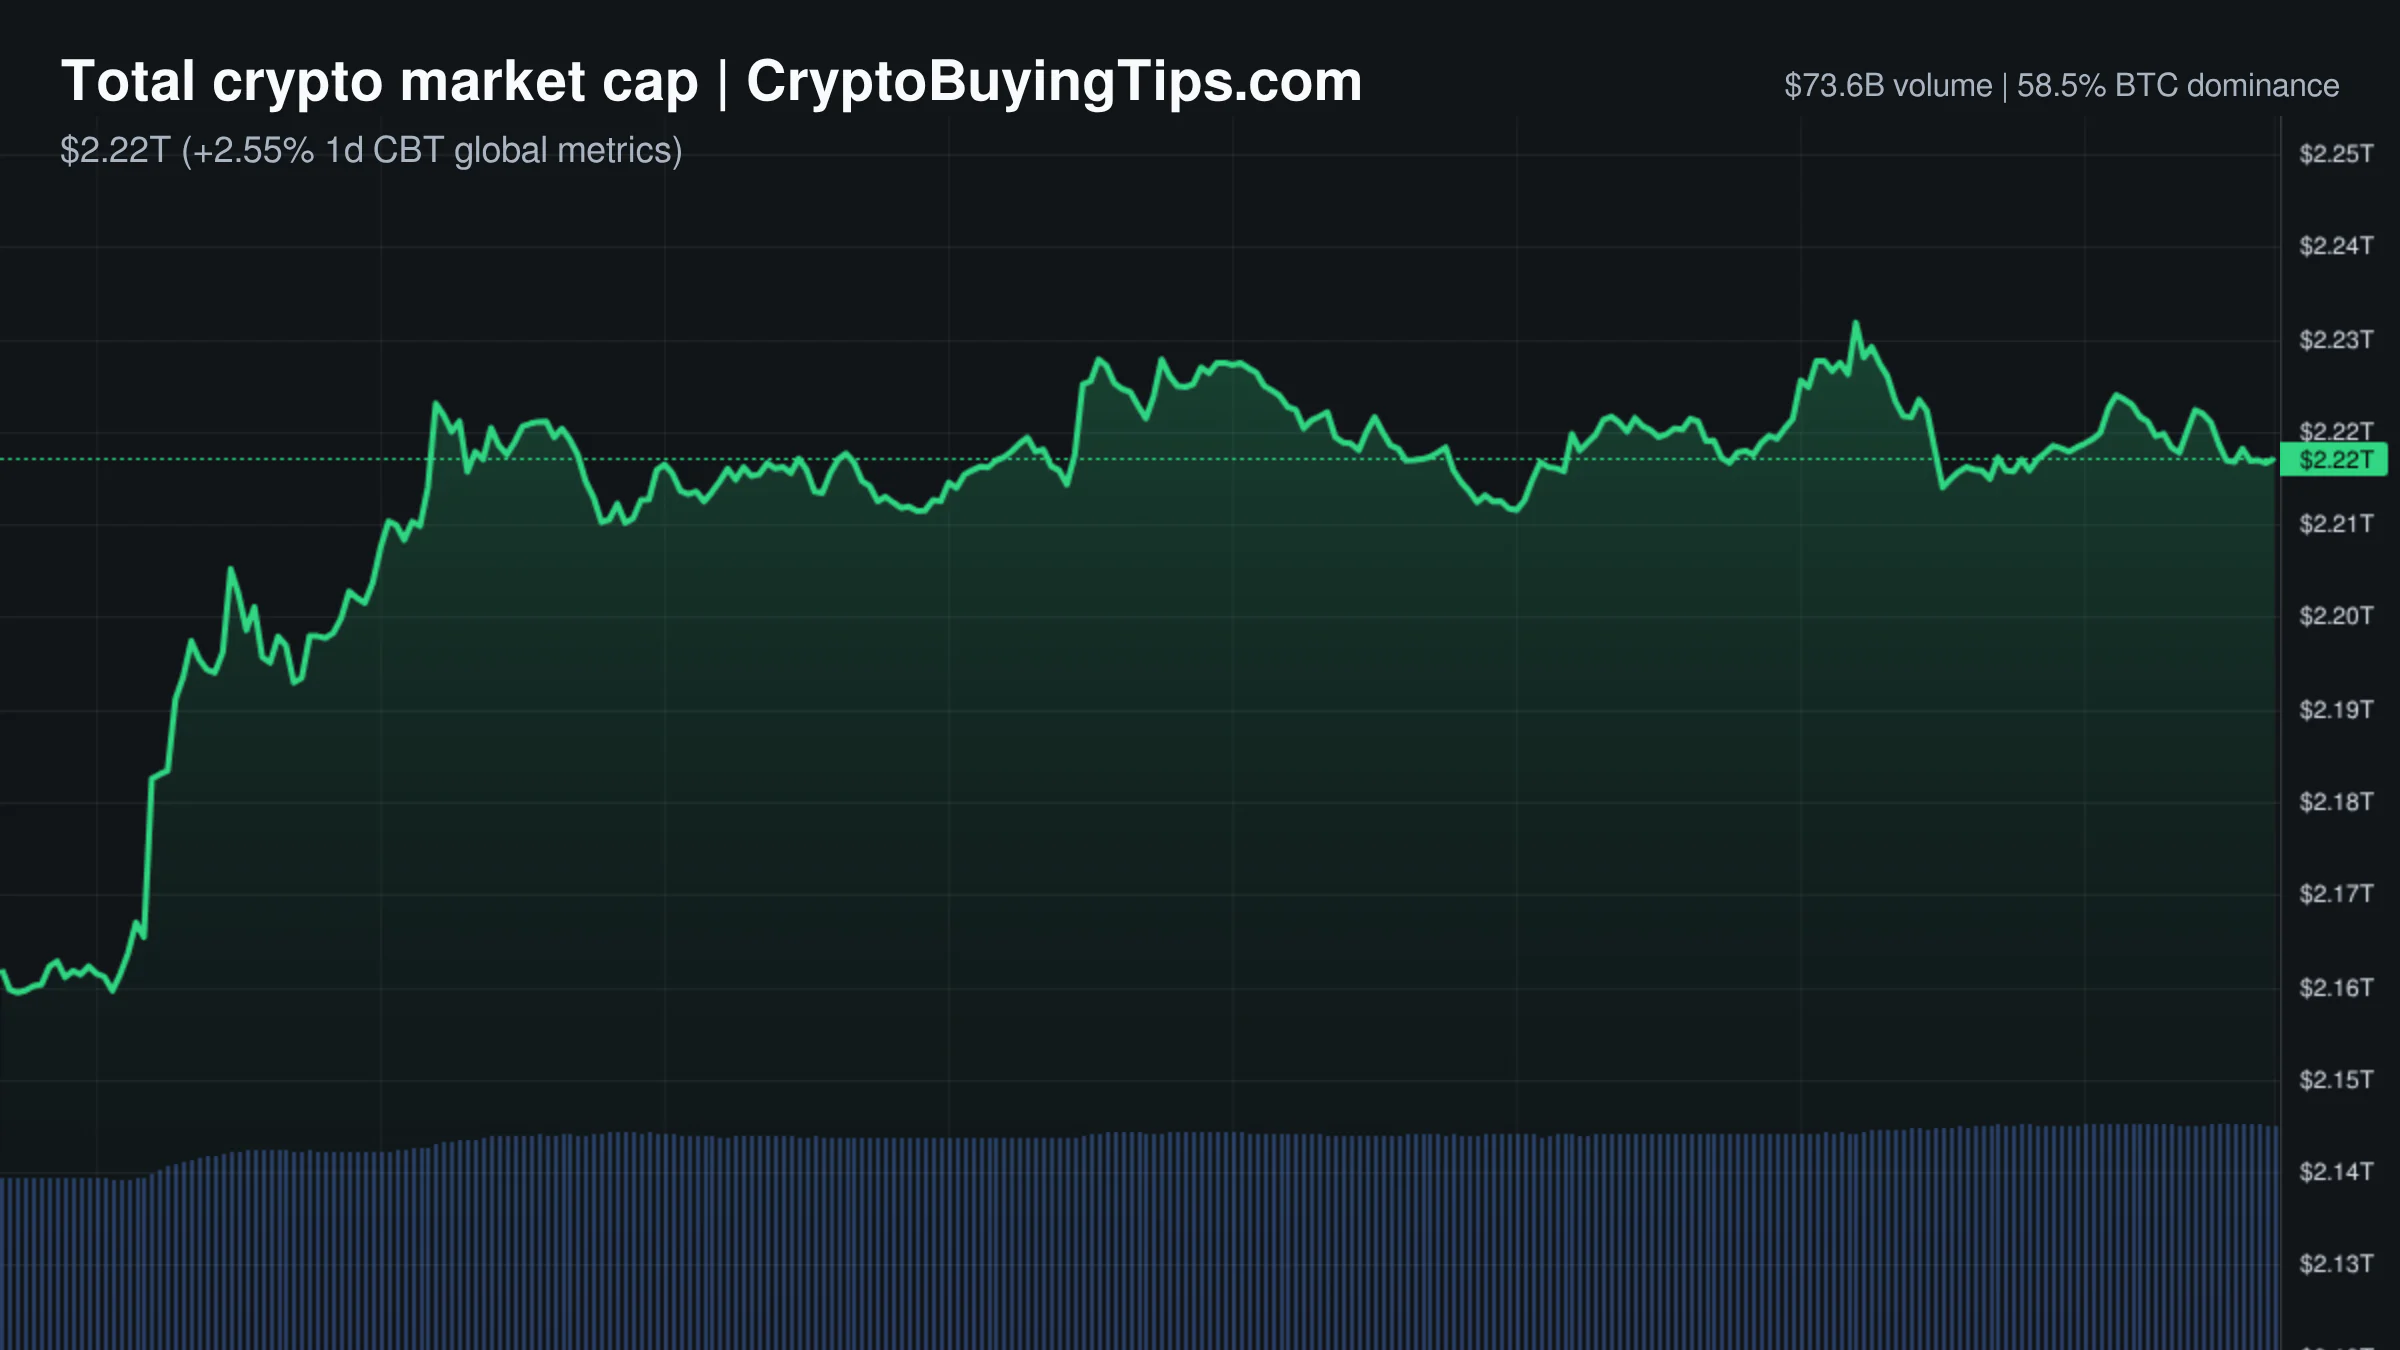
The crypto market is currently operating in a state of cognitive dissonance. Total market capitalization sits at $2.30T, reflecting a 2.52% gain over the last 24 hours, yet the Fear and Greed Index remains stubbornly in "Fear" territory at 34/100. It is a curious environment where prices are climbing while the prevailing sentiment suggests a looming disaster. This divergence is likely explained by the derivatives data. 24h derivatives volume has surged to $802.94B, which is roughly 10.8 times higher than the $74.02B in spot volume. When leverage dominates spot buying to this extent, the price action often reflects the closing of shorts or aggressive positioning rather than a fundamental shift in long-term conviction.

Bitcoin dominance is currently 56.31%, while Ethereum holds 9.84%. The Altcoin Season Index is neutral, hovering between 46 and 56 depending on the metric used. This suggests a stalemate. Capital is not aggressively rotating into alts, nor is it fleeing back to the safety of Bitcoin. Stablecoin dominance remains around 11.18%, indicating that a significant amount of capital is still sitting on the sidelines, waiting for a clearer signal before committing to risk assets.

Bitcoin and Ethereum

Bitcoin is currently priced at $64,602.08, up 2.94% in the last day. The asset is testing the $65,000 psychological level, which has acted as a ceiling for several weeks. The move is supported by a general risk-on mood in traditional markets, with the NASDAQ and S&P 500 both posting gains. However, the lack of clear ETF flow data makes it difficult to determine if this is institutional accumulation or merely a relief rally after a period of consolidation.

Ethereum has outperformed the market leader today, rising 4.35% to $1,876.25. Despite the price jump, network activity appears dormant. ETH gas fees are exceptionally low, with fast transactions costing only 0.08 Gwei. This suggests that the current rally is driven by exchange trading rather than on-chain utility or DeFi activity. We previously covered how Ethereum market share vanishes as it pivots toward corporate appeal, and today's data suggests that the corporate makeover has yet to ignite actual network usage.

Top crypto prices

Bitcoin leads the market at $64,602.08. Ethereum follows at $1,876.25. BNB is trading at $577.96, up 1.36%. XRP has seen a notable 3.47% increase to $1.1. Solana is priced at $77.3, reflecting a 2.66% gain. TRON is at $0.3279, up 1.01%. Hyperliquid (HYPE) is the standout performer among the top ten, rising 6.35% to $67.94.

News driving today's market

Regulatory clarity in Asia is providing a strong tailwind. Japan has passed a bill recognizing crypto as a financial product and lowering the tax rate to approximately 20%, down from a maximum of 55%. This is a significant reduction in friction for institutional players. Similarly, South Korea is updating its state asset management system to explicitly include digital assets and plans to tokenize government bonds by 2027. These moves suggest that the "institutionalization" of the asset class is moving from theory to legislation.

In the West, the U.S. and U.K. have released a 10-point roadmap to align rules for tokenized finance. This coordination between the world's two largest financial markets reduces the regulatory risk for stablecoins and tokenized securities. We previously discussed how BTC dominance data analysis often reflects capital consolidating during liquidity pauses, and these regulatory roadmaps may eventually provide the certainty needed to break that consolidation.

The macro payment landscape is also shifting. Stripe has launched a $53 billion bid to acquire PayPal, a move that signals immense confidence in the digital payment infrastructure. Simultaneously, Japan's JCB is partnering with Circle to bring USDC to 40 million merchants. However, this optimism is tempered by JPMorgan, which claims that the rise of Hyperliquid threatens the economic moat of USDC. On the risk side, the U.S. Treasury has frozen $130 million in Iran-linked wallets, reminding the market that the "censorship-resistant" nature of crypto is often subject to the whims of the Treasury Secretary.

Social intelligence

On-chain data from Arkham and reports via @WuBlockchain show that the U.S. government is actively moving seized funds. Over the last six hours, addresses linked to the Bitfinex hack moved approximately 5,939 ETH and 296,709 USDT to Coinbase Prime. These movements often create short-term selling pressure as the government liquidates assets.

Conversely, some "smart money" is stepping in. Tom Lee's Bitmine reportedly purchased another 6,000 ETH, worth roughly $11.18 million, from FalconX. This suggests a divergence between government liquidation and private institutional accumulation. Meanwhile, Binance Co-Founder Yi He noted that the exchange has recovered over $8 billion in mistaken transfers since 2021, a figure that highlights the sheer scale of operational errors occurring in the retail sector.

Trading ideas worth watching

The ETHUSDT 4-hour chart shows a bullish double-bottom pattern with increasing momentum. This is supported by a bullish RSI divergence. The immediate target is the resistance level around $1,940. If the price clears this, a move toward $2,200 becomes the likely objective. The setup remains valid as long as Ethereum holds its recent support levels.

Redrawn ETHUSD 60 trading idea chart for ETHEREUM (ETH/USD): Strong Bullish PatternRedrawn ETHUSDT 240 trading idea chart for ETHUSDT (4H) Analysis

On a shorter timeframe, ETHUSD on Coinbase is forming an inverted head and shoulders pattern. The price has already broken above the neckline after testing critical support. This is a strong bullish signal with a primary target of $1,810, though the current price has already surpassed this, suggesting the move is extending toward higher targets.

For Bitcoin, the daily chart suggests a new bullish phase is beginning. After a correction that lasted from May to mid-July, the move above $65,000 could be the start of a 2-to-4 month bullish wave. The invalidation point for this thesis would be a failure to maintain the July 1st low. If the momentum holds, August and September could see significant gains.

Smart Money Signals — Hyperliquid Leaderboard

Hyperliquid LONG BTC leaderboard chart

Our tracker has flagged a high-confidence move from a top trader on the Hyperliquid leaderboard. Trader 0x10b4c1, who boasts a 211% 30-day ROI and a total PnL of $231.4K, has opened a LONG position in BTC at an entry price of $64,486. The notional value of the trade is $322,430, and the trader has assigned a confidence score of 80 to the setup. This aligns with the broader technical view that $64k to $65k is the current pivot zone for the market.

Altcoin Spotlight

Hyperliquid (HYPE) is currently the asset to watch. It has gained 6.35% today, bringing its price to $67.94. Beyond the price action, the protocol is becoming a focal point for institutional debate. JPMorgan's recent commentary suggests that Hyperliquid's growth is putting pressure on the earnings and economic stability of USDC. When the world's largest bank starts worrying about a protocol's impact on stablecoin economics, it usually means the protocol has reached a level of scale that can no longer be ignored.

What to watch next

The immediate focus is the $65,000 level for Bitcoin. A clean break and hold above this mark would likely flip the Fear and Greed Index back into "Greed" territory, potentially triggering a short squeeze given the high derivatives volume. For Ethereum, the $1,940 resistance is the key. If it can convert that level into support, the path to $2,200 is open.

Macro-economically, the outcome of the Stripe bid for PayPal will be a major indicator of how much capital is flowing into the "stablecoin-as-infrastructure" trade. Finally, keep an eye on the U.S. government's seized fund movements. If the flow of ETH to Coinbase Prime continues, it may cap the upside for Ethereum in the short term, regardless of how bullish the chart patterns look.