Market Overviews

Daily crypto market overviews, trend analysis, and key updates from our editorial team.

Crypto Market Overview | Bitcoin dominance climbs as liquidity rotates to BTC despite low altcoin volume | June 21, 2026
Sigrid Voss·

Crypto Market Overview | Bitcoin dominance climbs as liquidity rotates to BTC despite low altcoin volume | June 21, 2026

Market overview

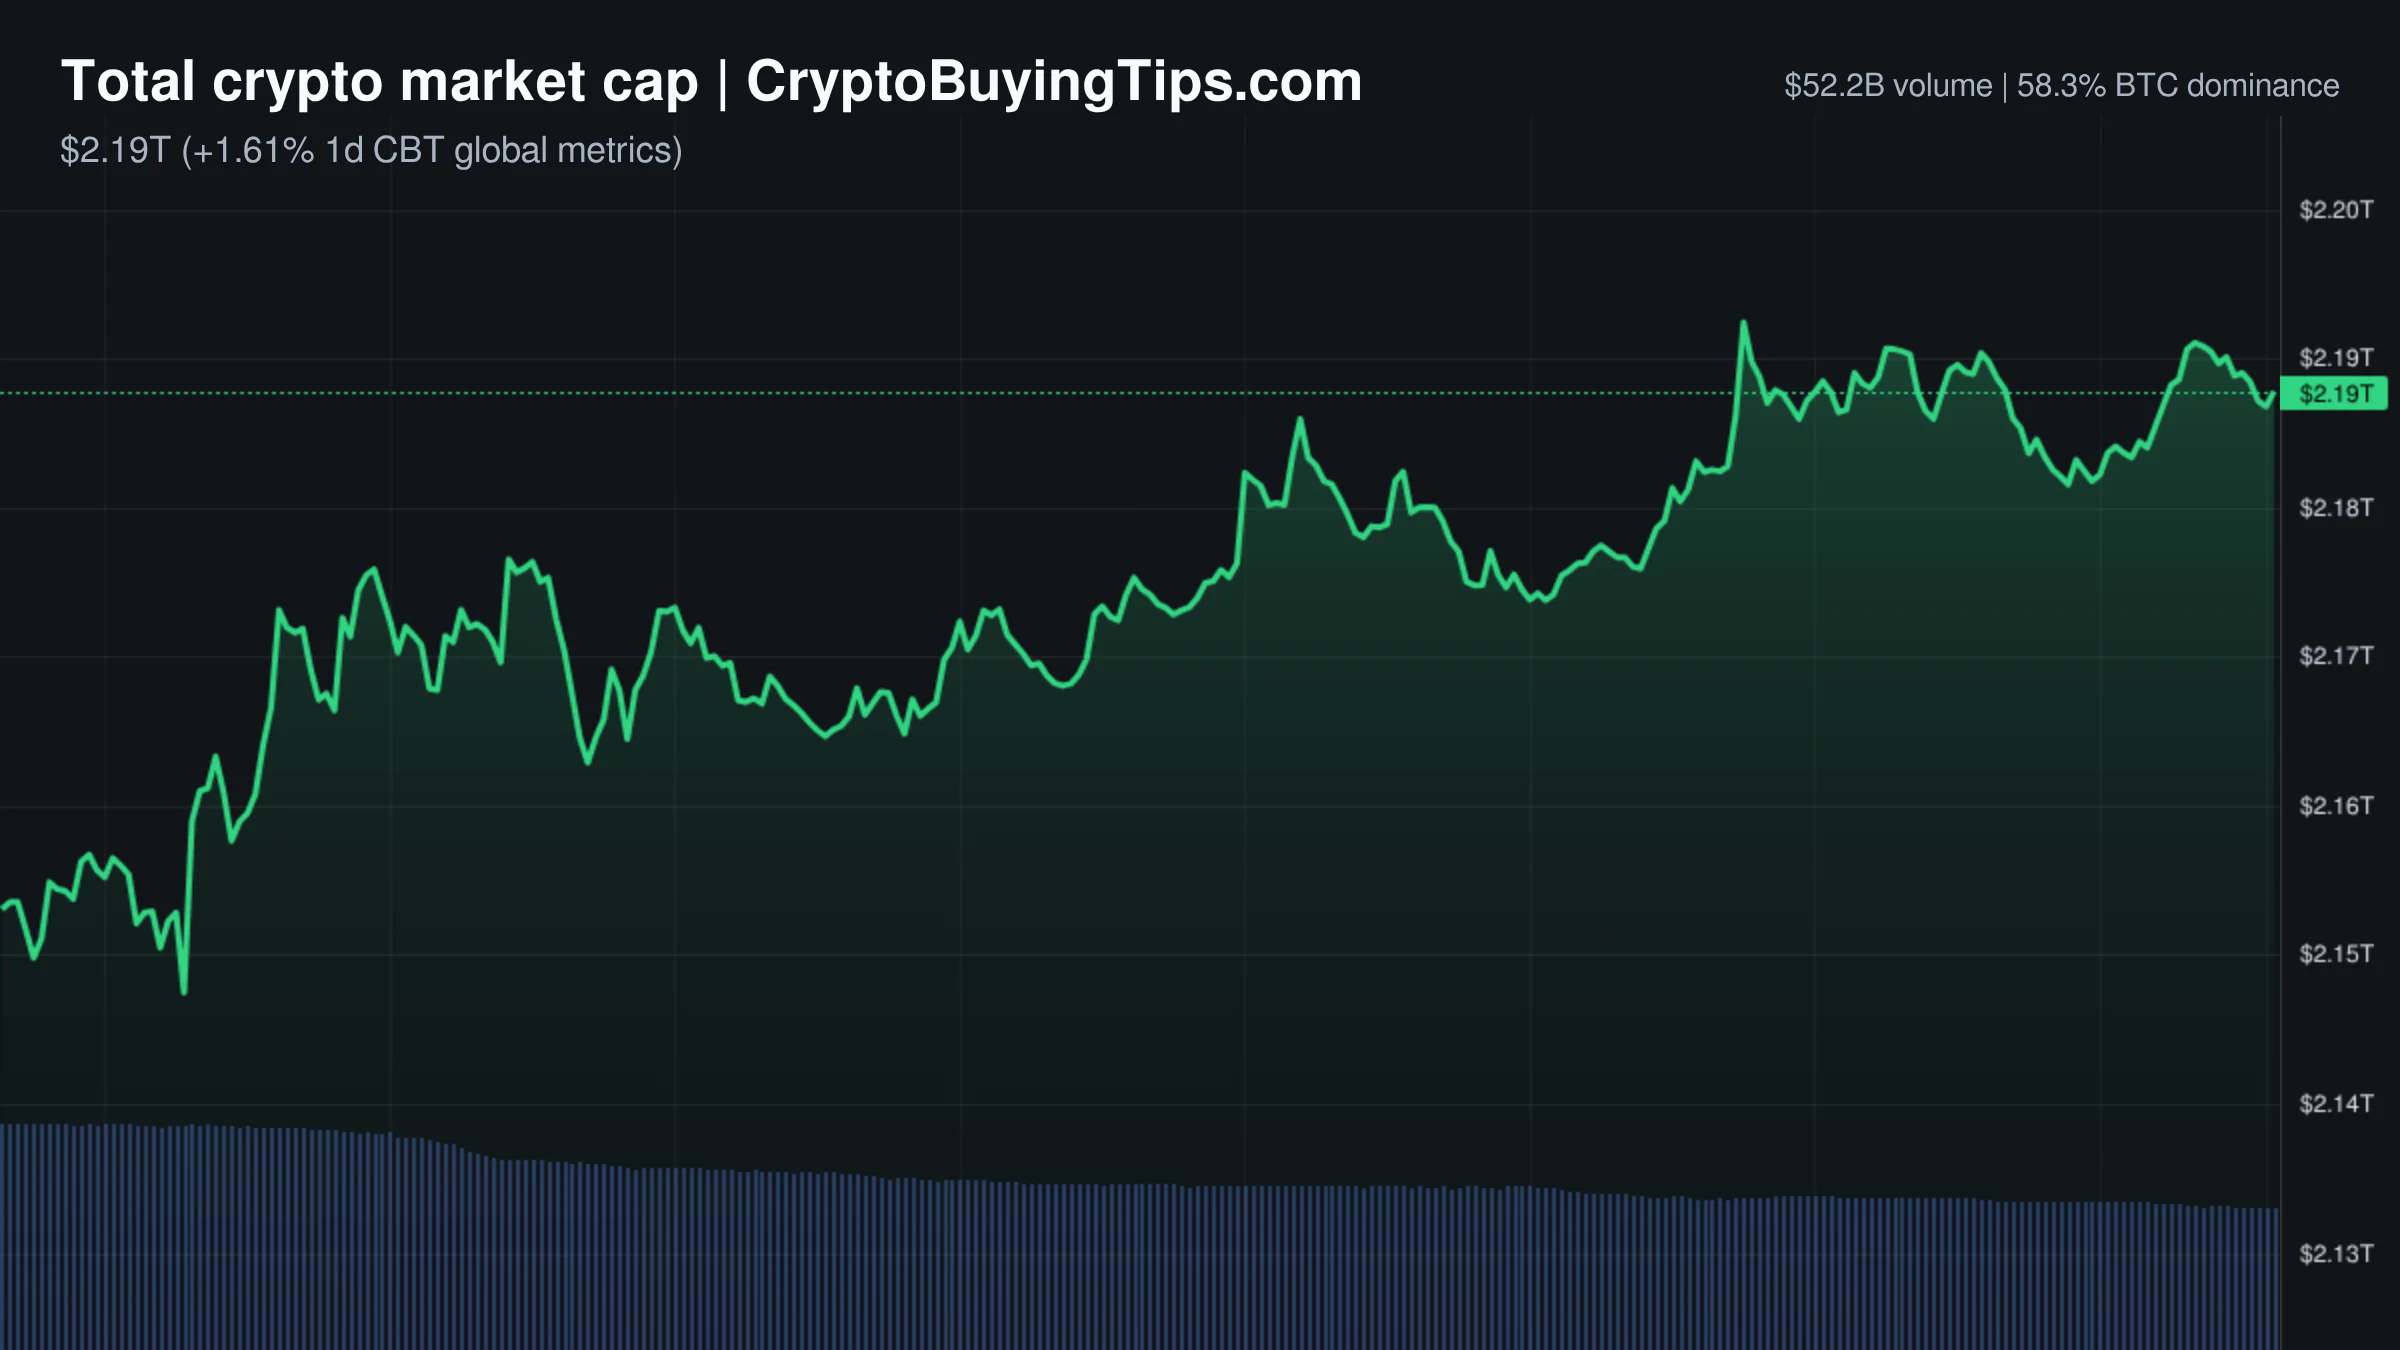
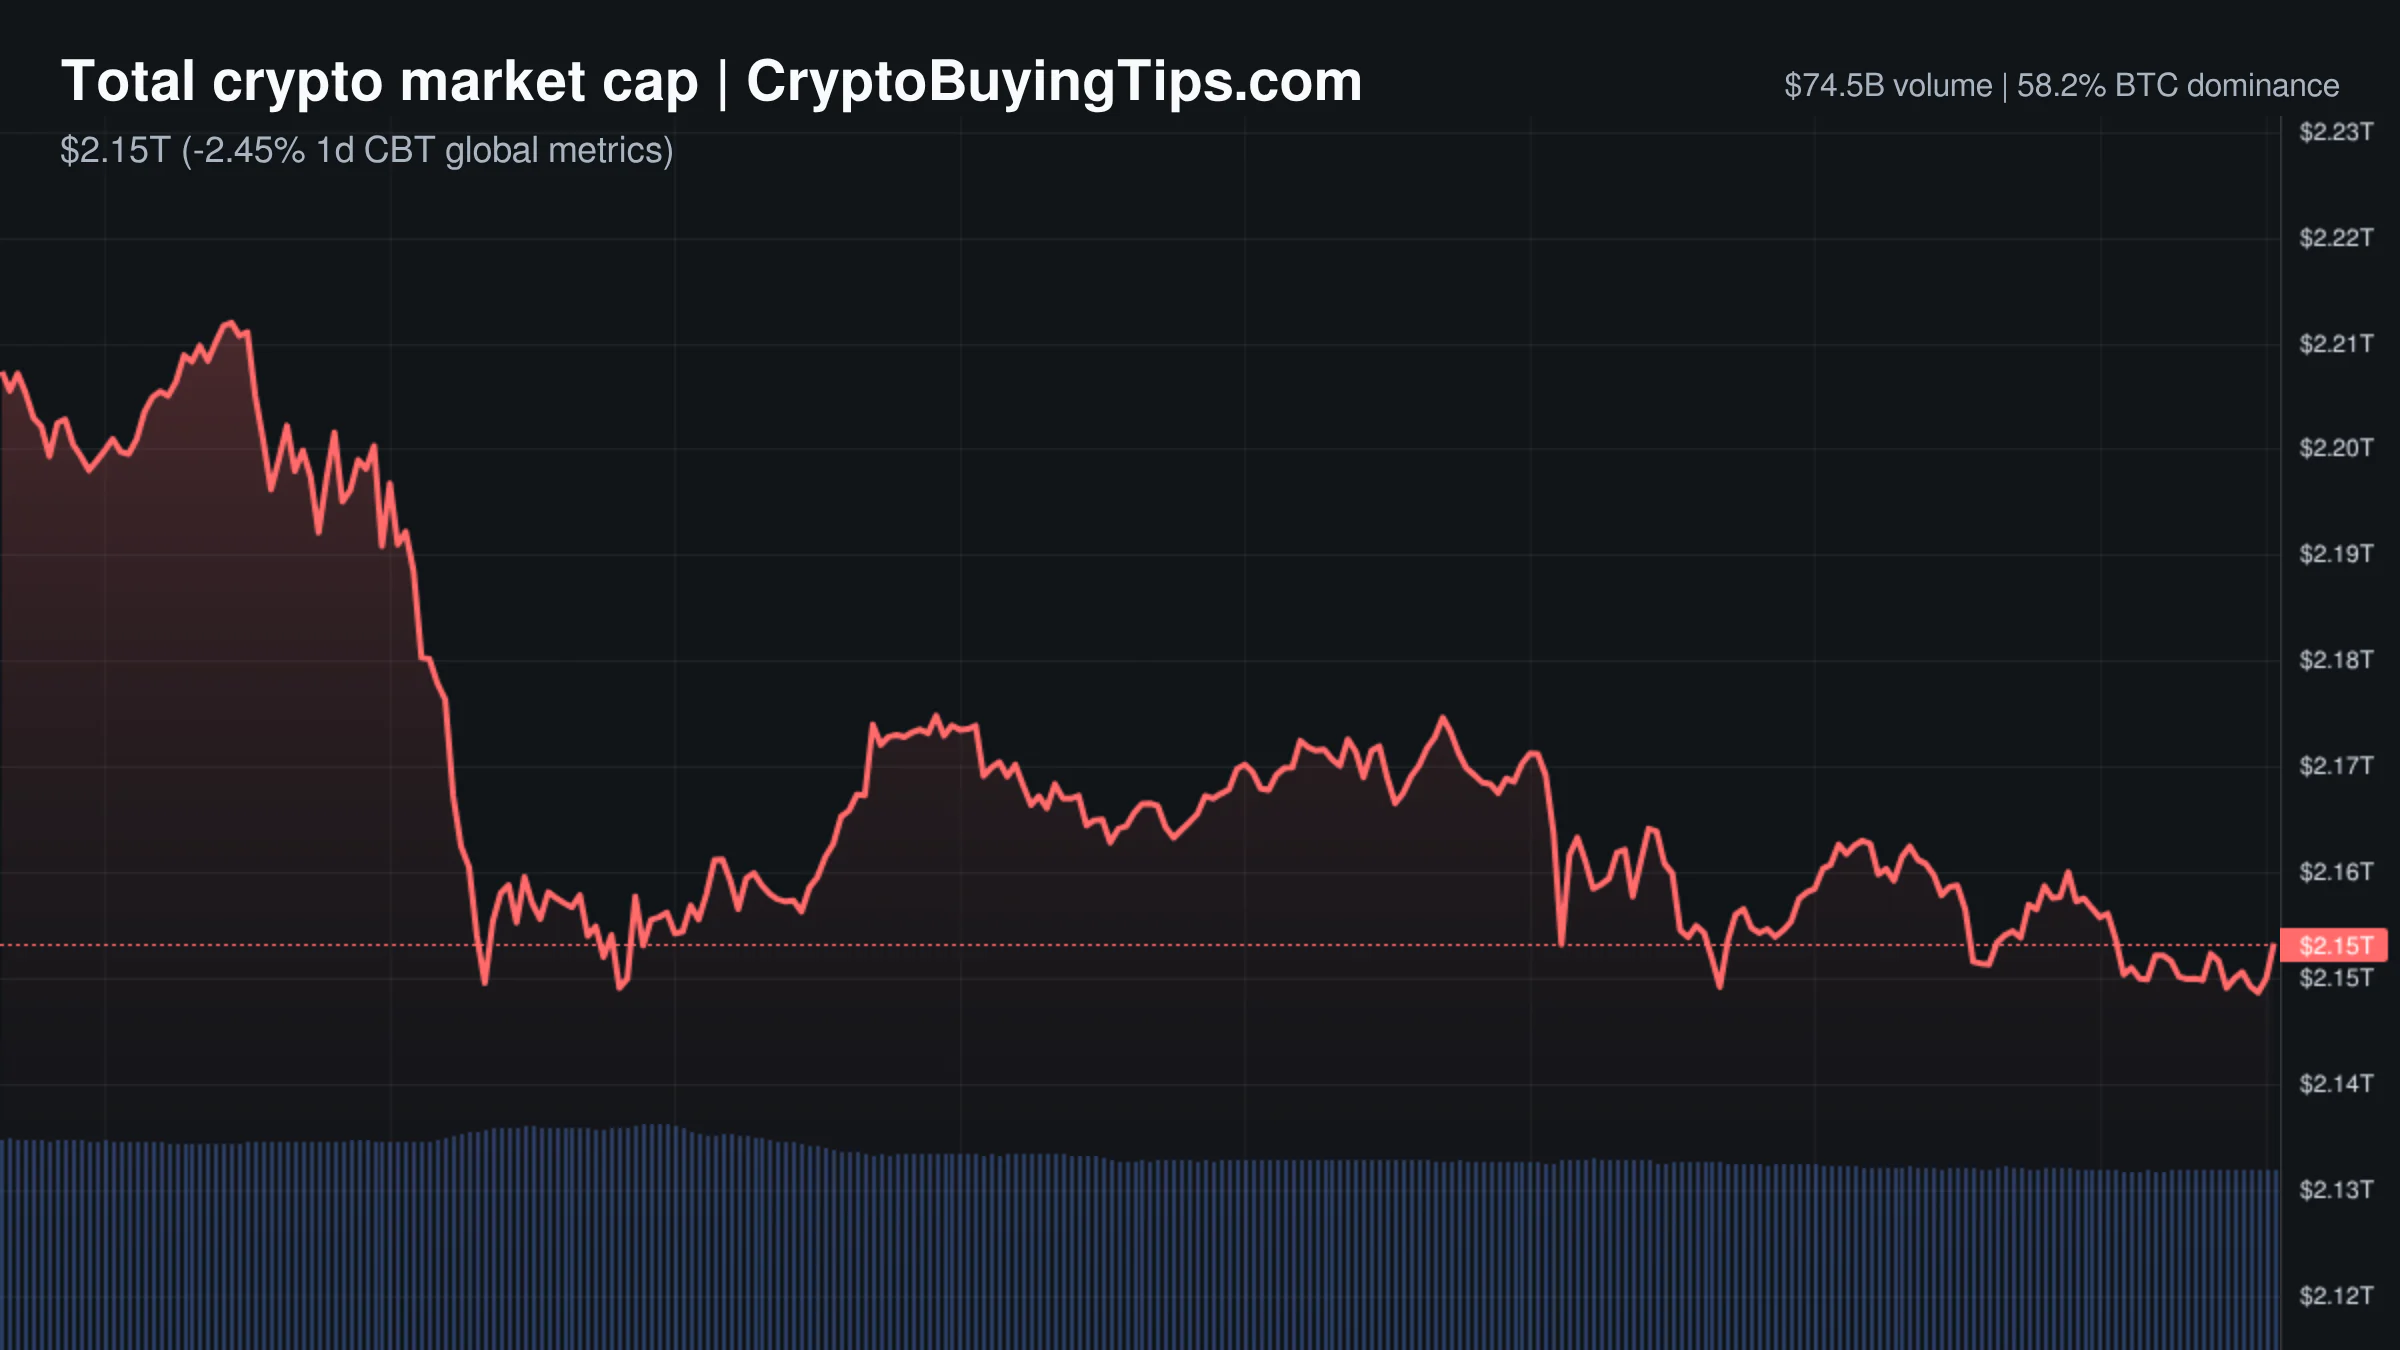
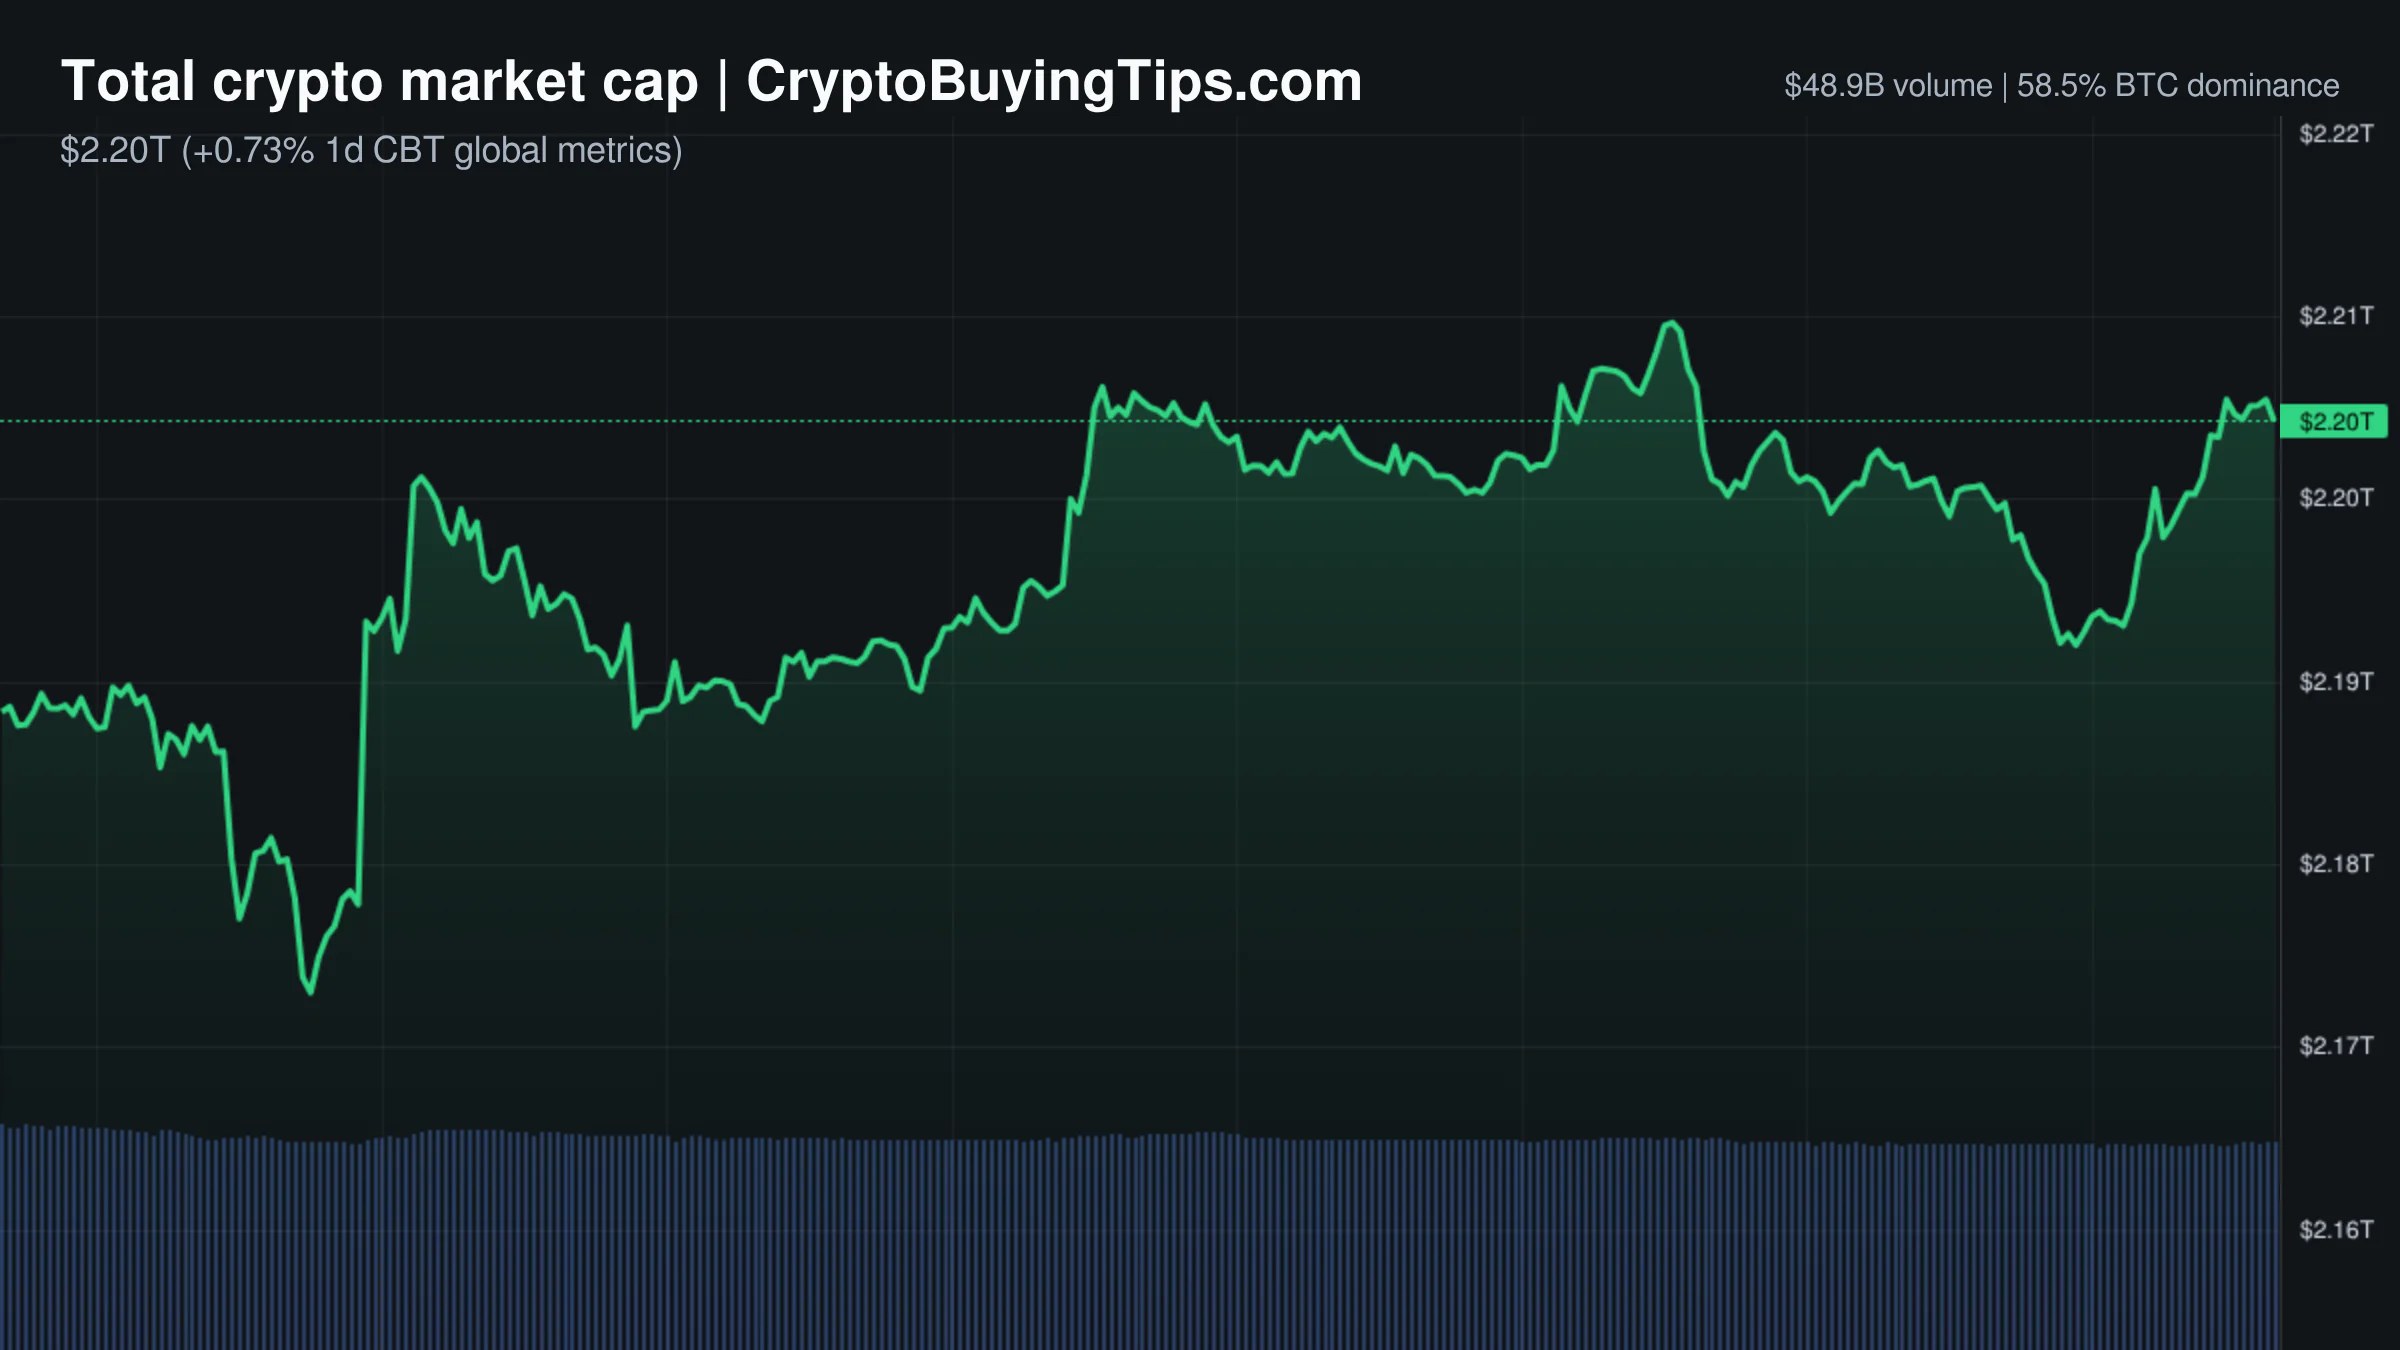
The crypto market is currently operating in a state of profound psychological contradiction. While the total market cap has ticked up slightly to $2.21T, the Fear and Greed Index is sitting at a dismal 22. It is a classic market irony: prices are drifting higher while the participants remain convinced the world is ending. This gap between price action and sentiment often suggests a market that is grinding upward despite a lack of conviction, or perhaps a retail crowd that is too terrified to buy the dip.

Liquidity is showing signs of exhaustion. Total 24h volume is down 6.63% to $48.75B, and the derivatives market is seeing an even sharper decline, with volume dropping 8.67% to $450.36B. When price rises while volume and derivatives activity fall, the move lacks the aggressive conviction usually associated with a true trend reversal. It looks more like a low-volume drift.

The most telling metric is the shift in dominance. Bitcoin dominance has climbed to 58.45%, while the Altcoin Season Index sits in a neutral zone around 47. Capital is not flowing into the broader market; it is rotating into the king. This regime effectively squeezes altcoins, which must now fight for a shrinking slice of the liquidity pie. Stablecoin dominance remains high at 11.40%, suggesting a significant amount of capital is still sitting on the sidelines, waiting for a catalyst that doesn't involve a 20% drawdown.

Bitcoin and Ethereum

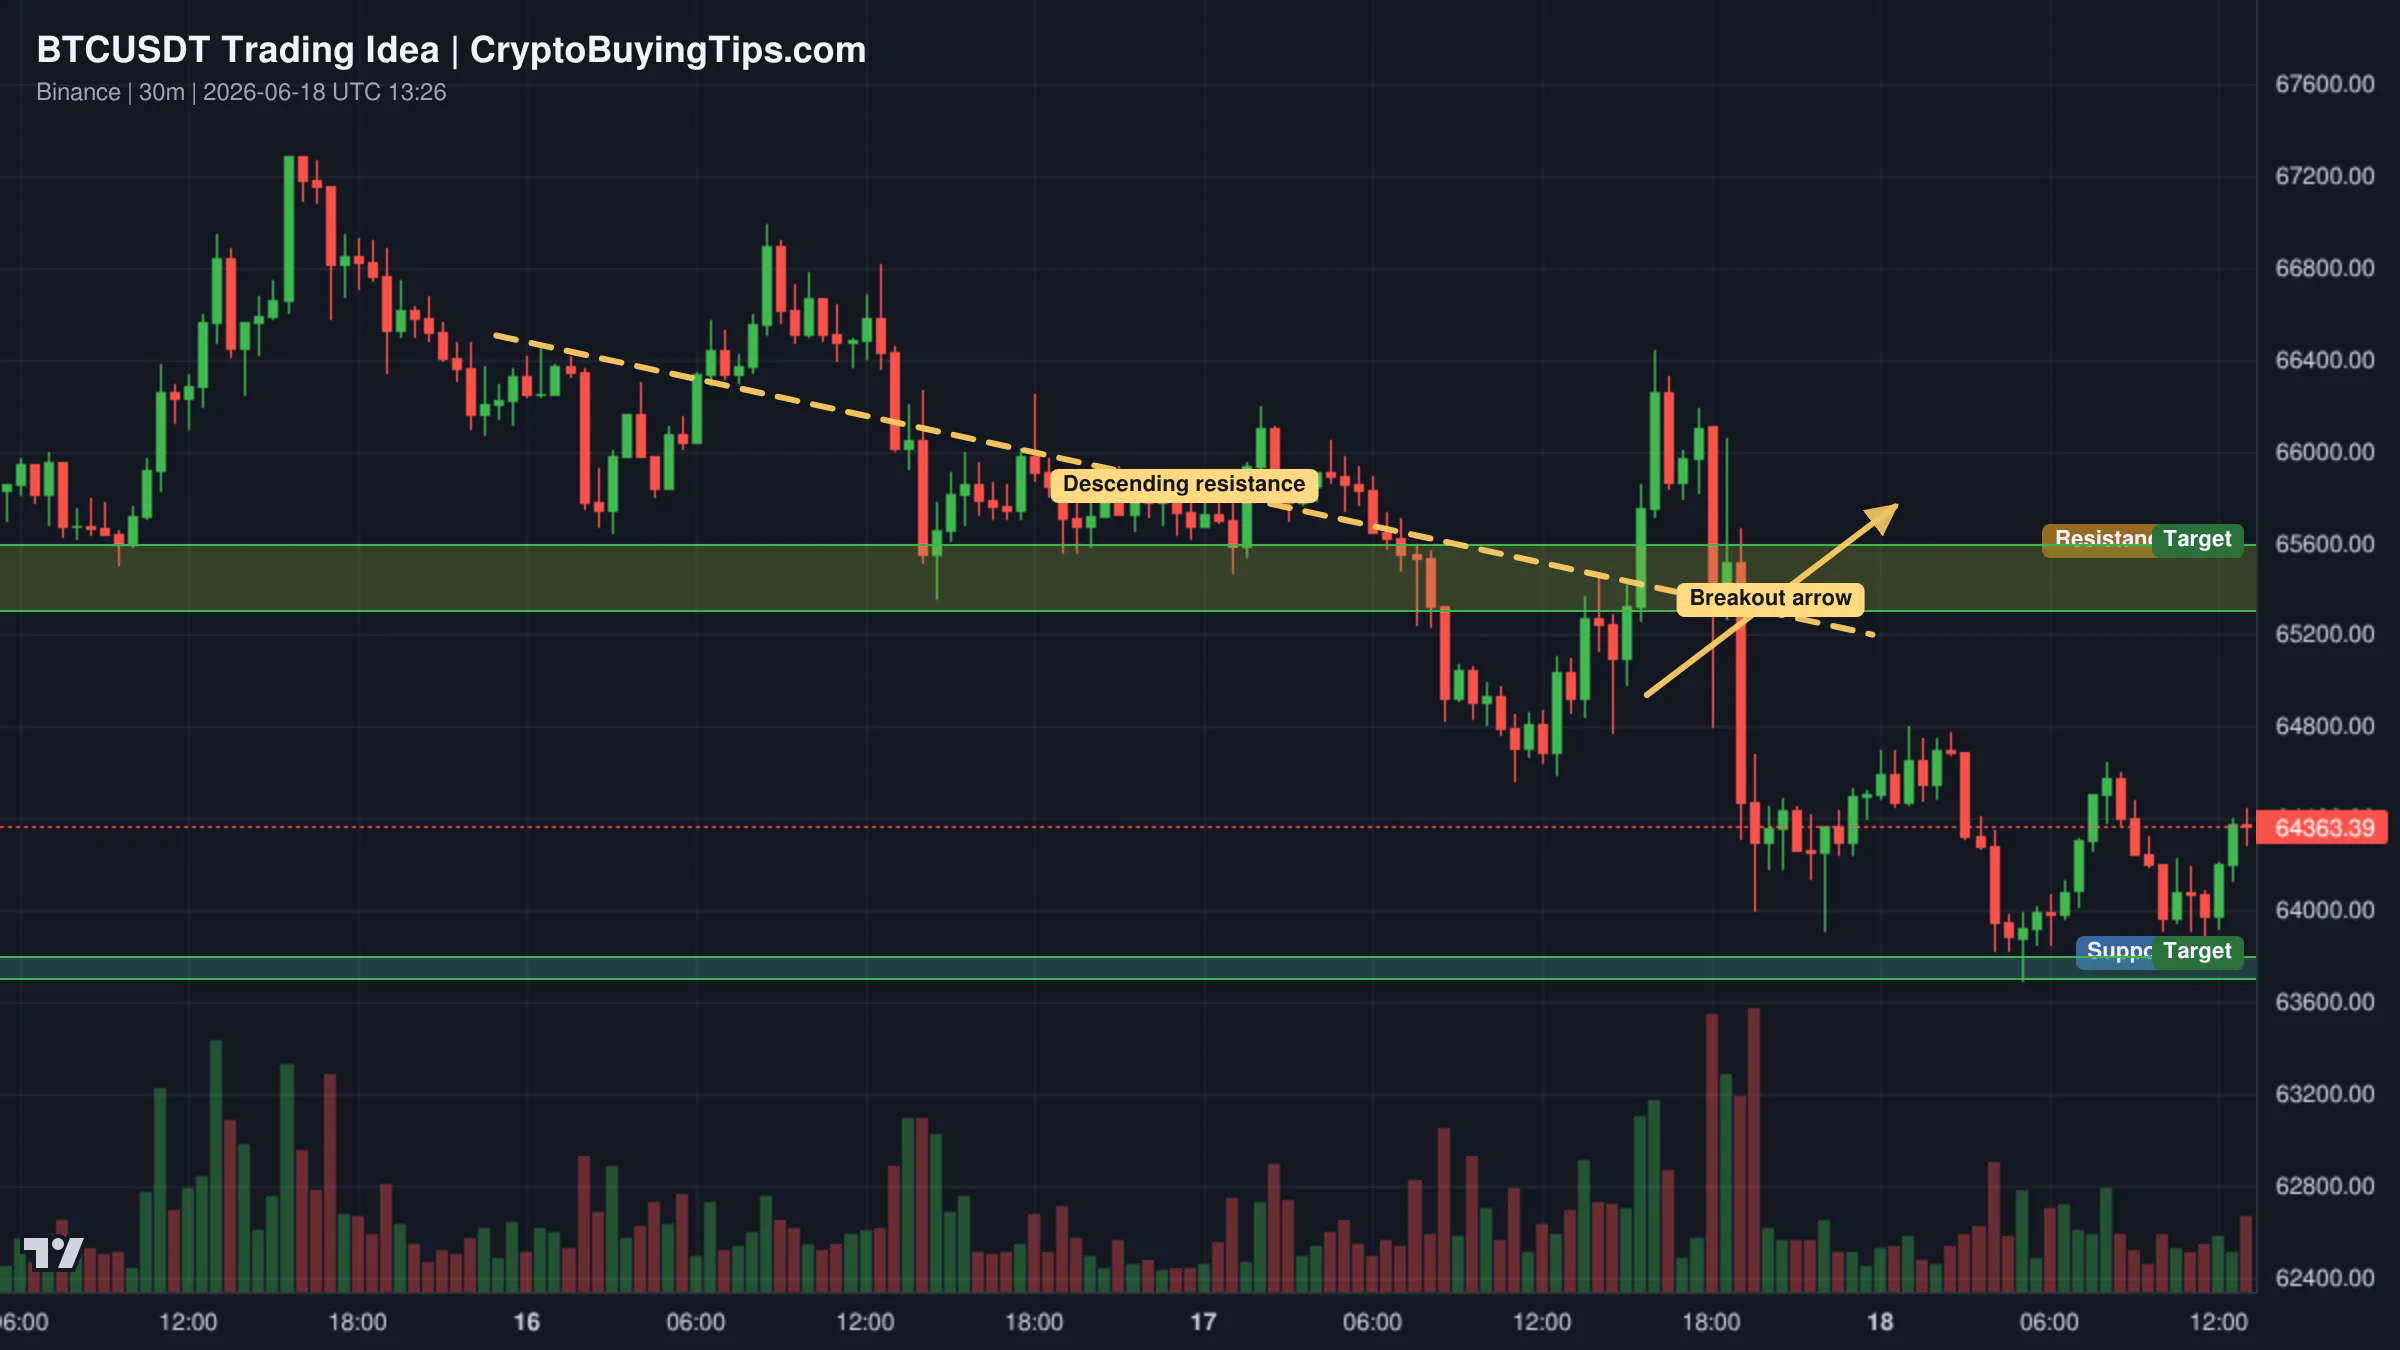
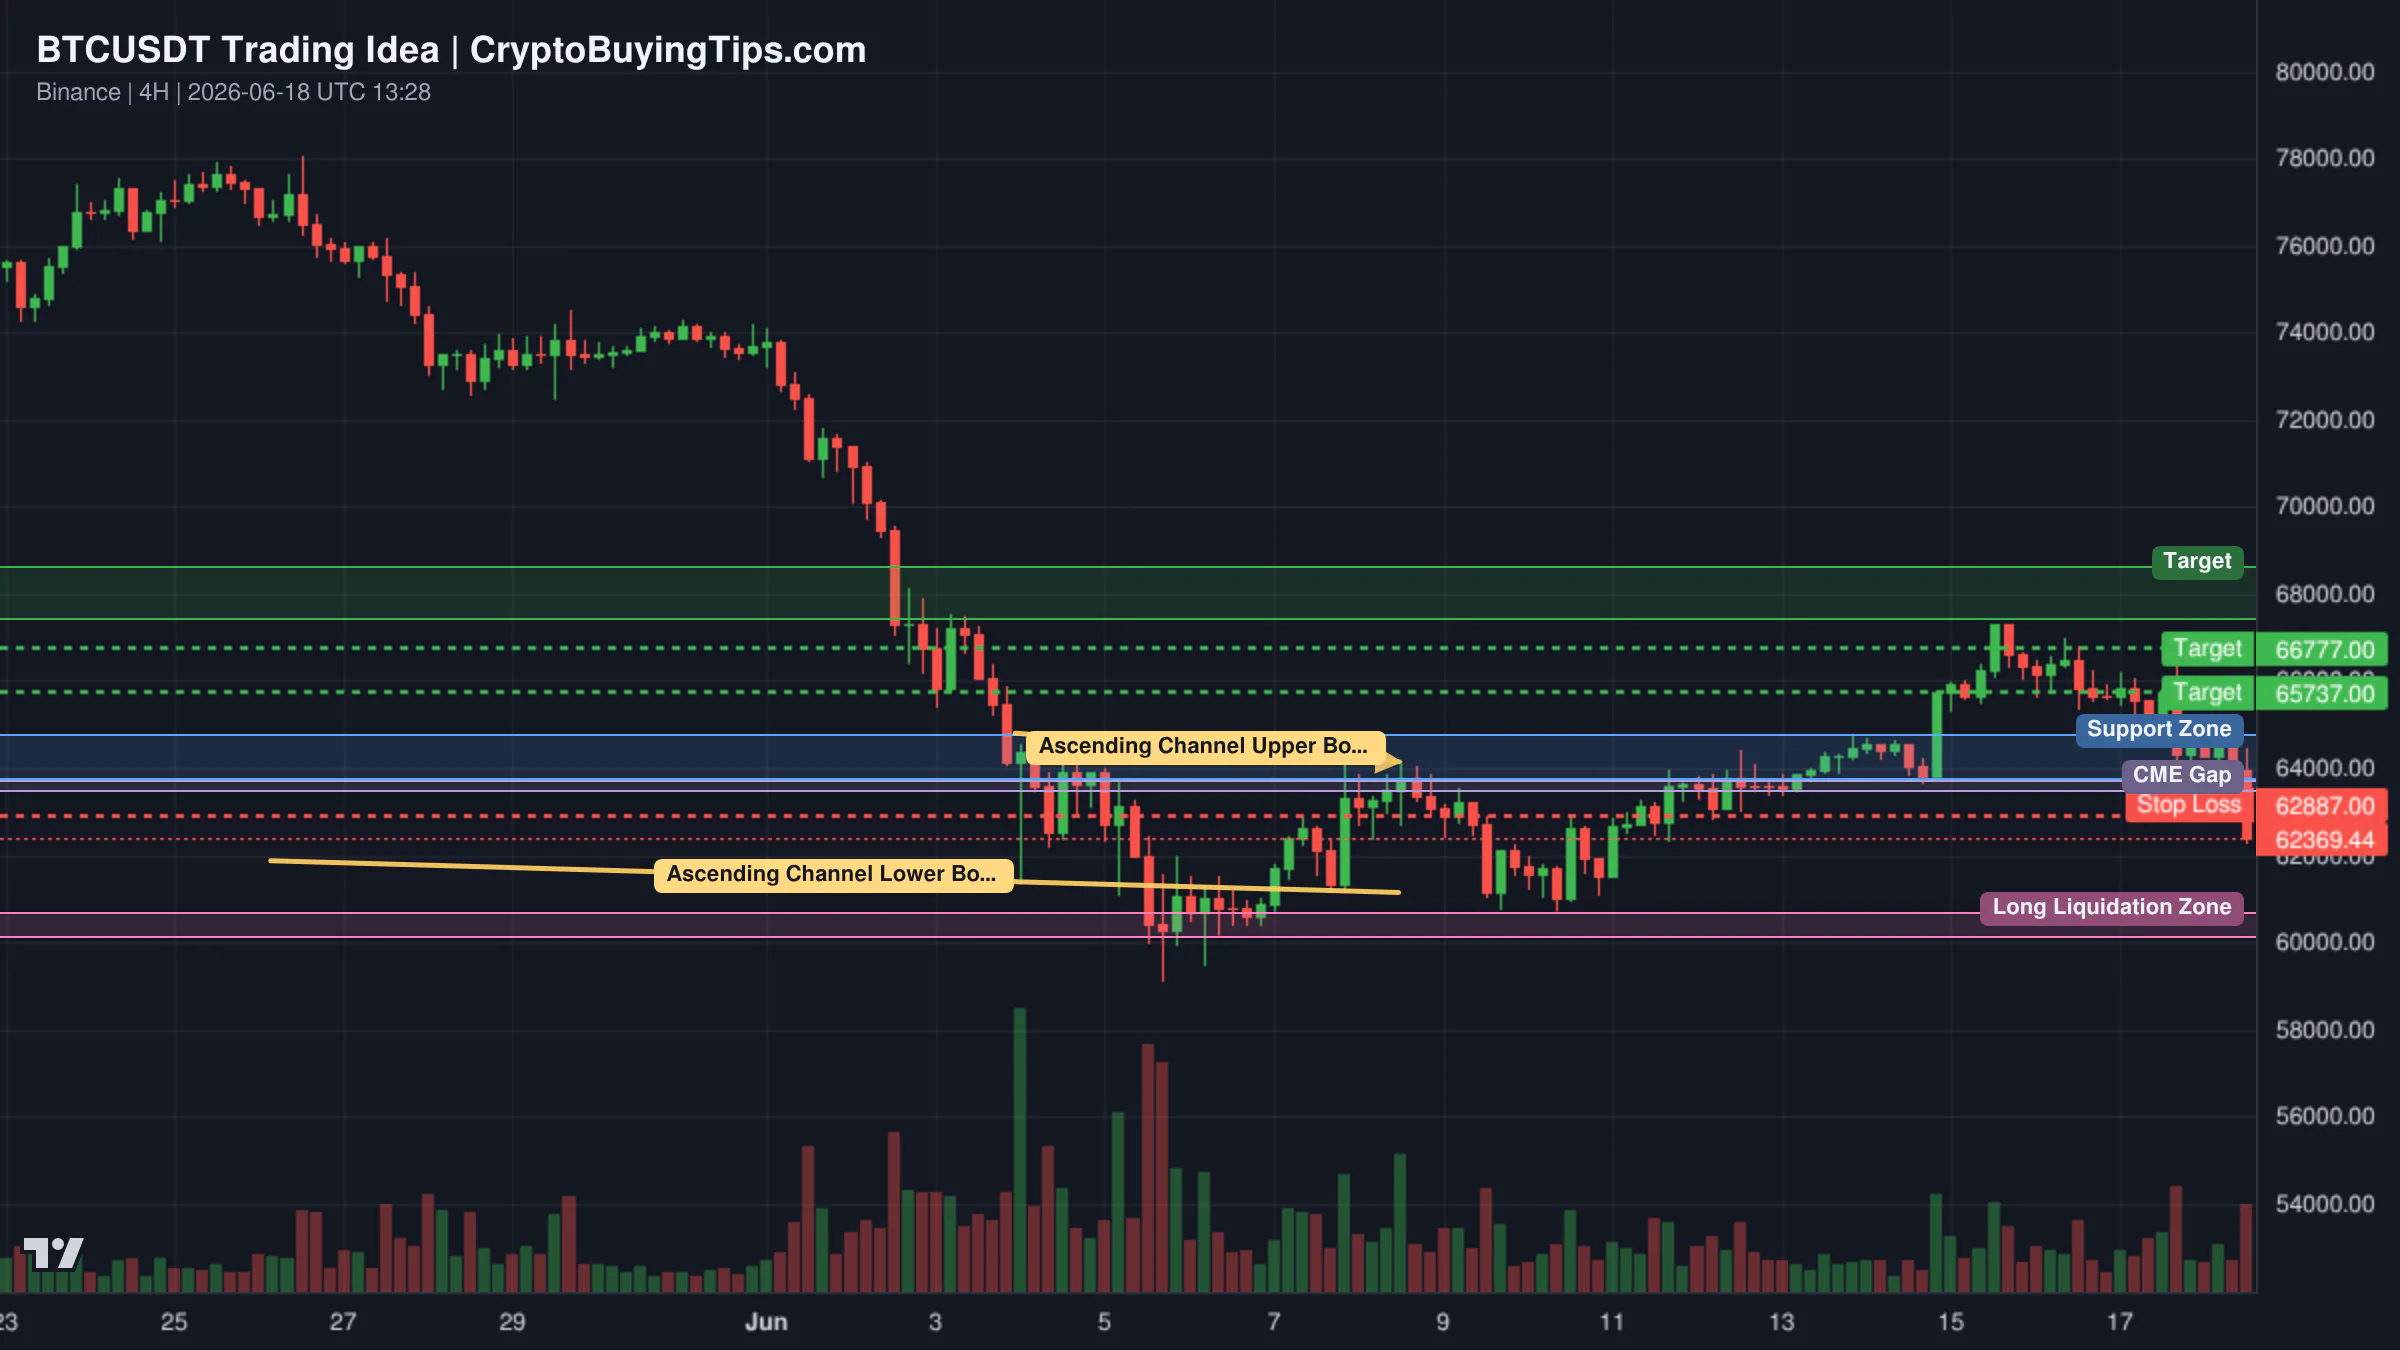
Bitcoin is trading at $64,266.41, up 1.04% over the last 24 hours. The asset is currently the primary beneficiary of the market's risk-off posture. While the price is nearly 50% below its peak, network activity is actually surging. This decoupling of price and utility often points to an accumulation phase where institutional players are building positions without triggering a vertical price spike. However, the "flywheel" narrative is under pressure, with critics questioning the long-term strategy of major holders as related assets like STRC slide.

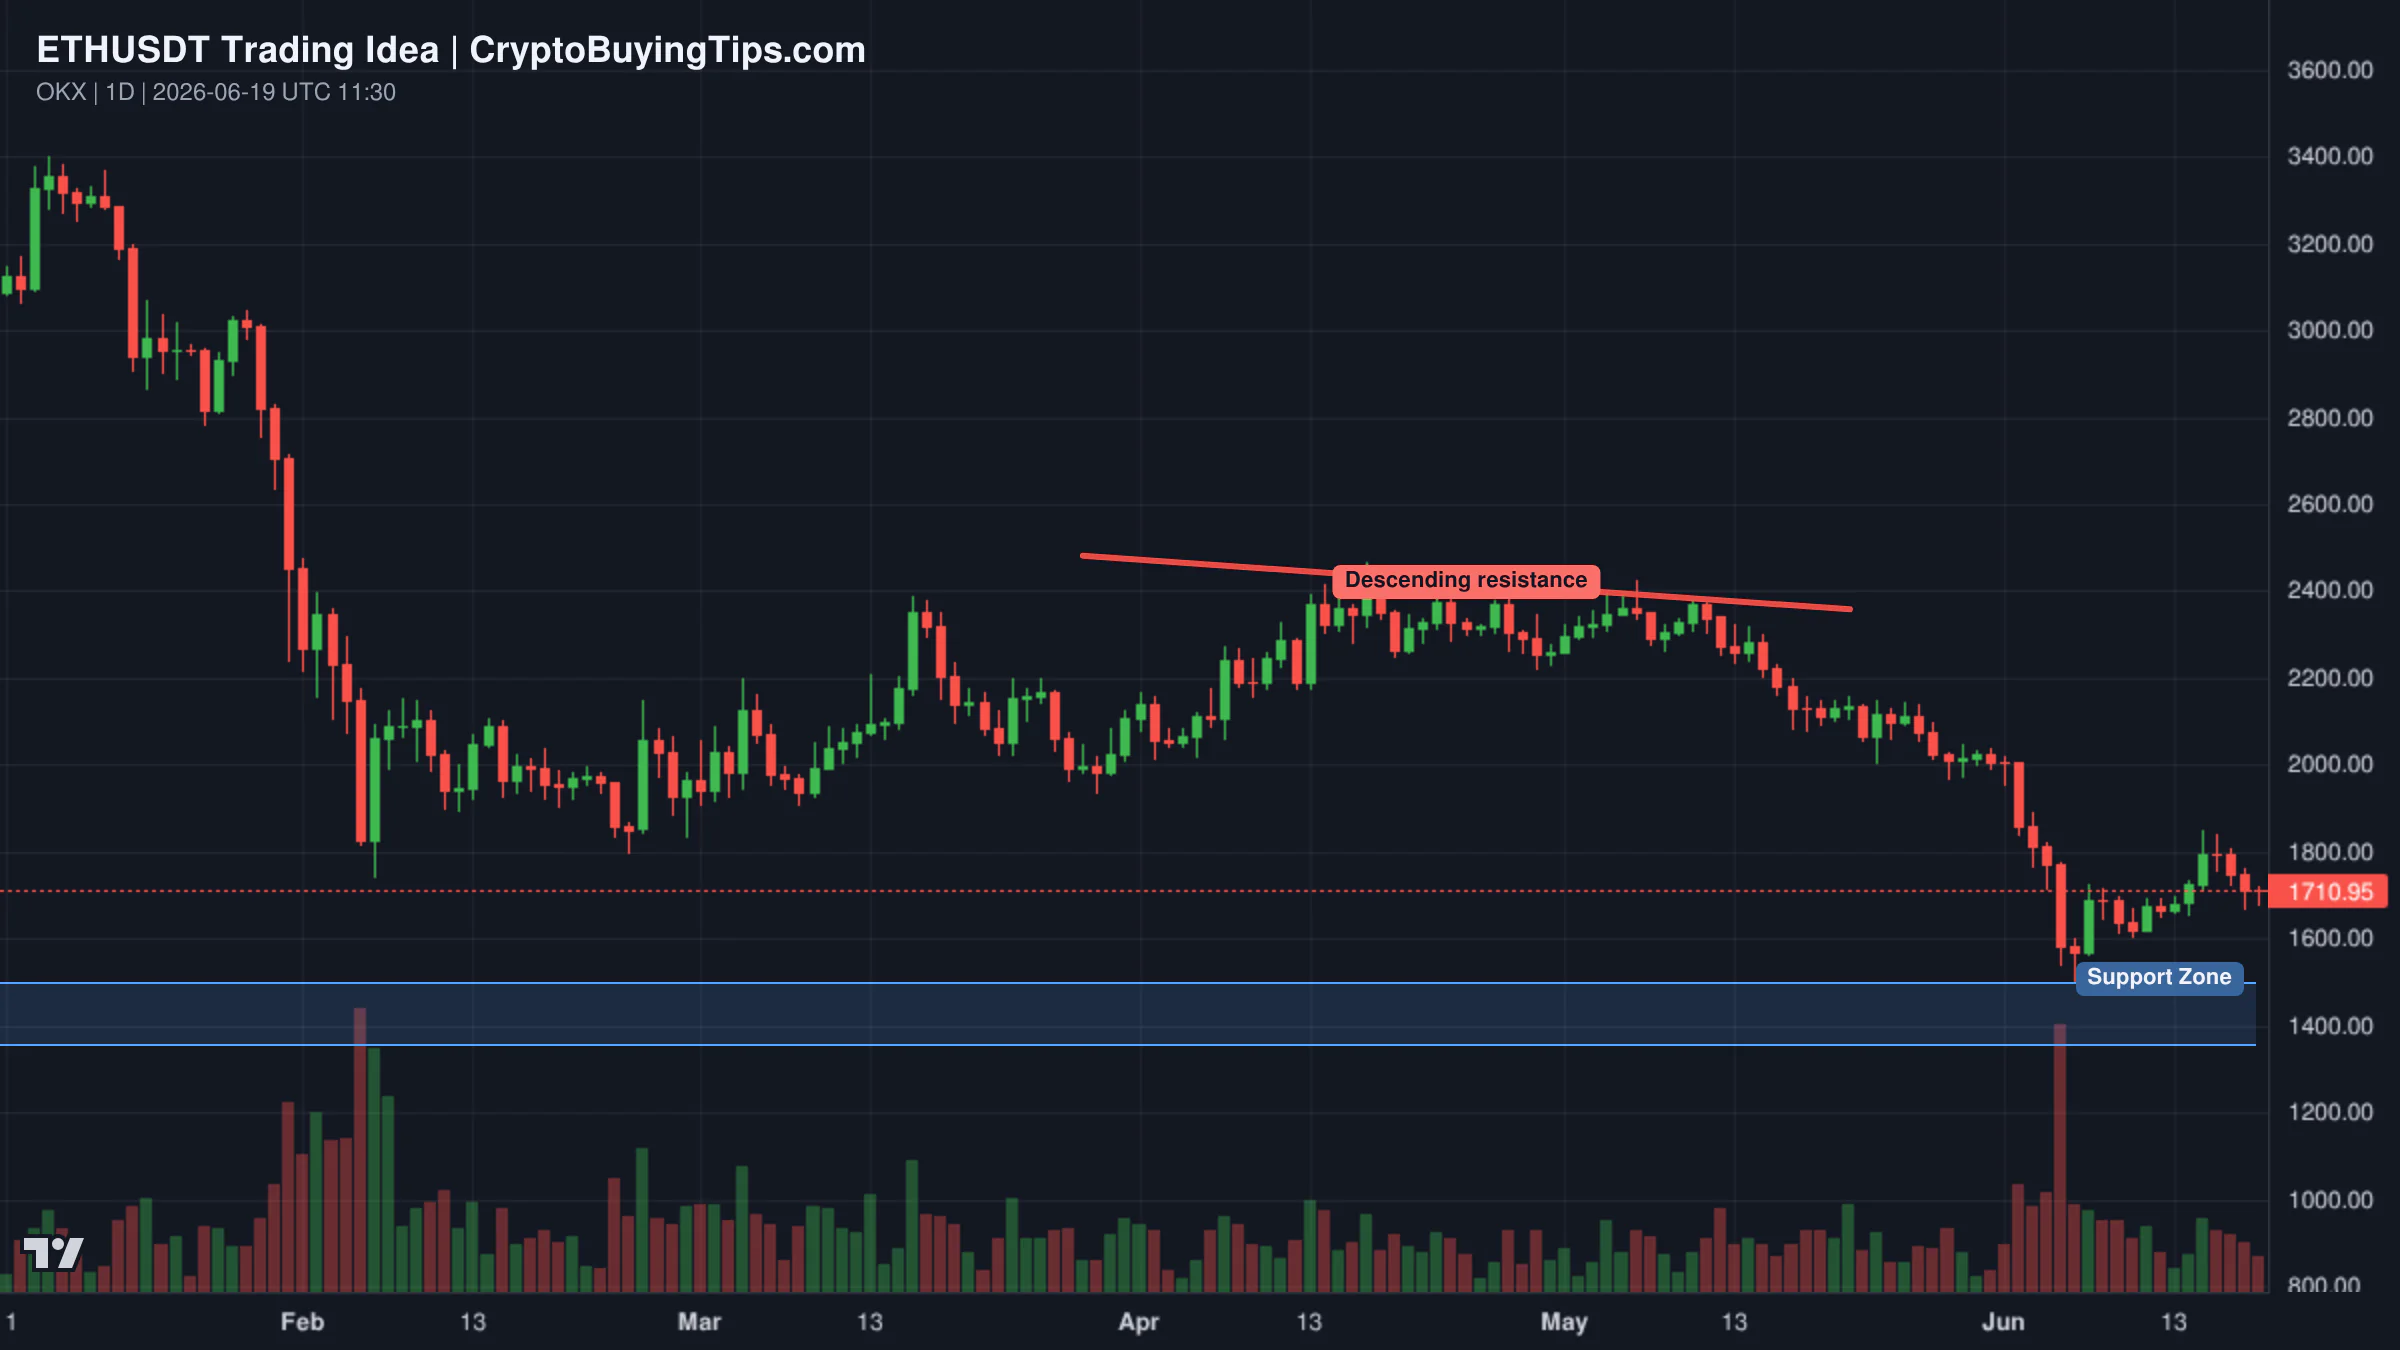
Ethereum is struggling to find a narrative. Trading at $1,729.89, it has managed a meager 0.21% gain. The most concerning data point is the network activity. Gas fees are exceptionally low, with fast transactions costing only 0.17 Gwei. While cheap fees are great for the end user, they are a bleak signal for the network's current demand. If no one is fighting for block space, there is no urgency to hold the asset.

Top crypto prices

Bitcoin leads the pack at $64,266.41, maintaining its role as the market's primary liquidity sink. Ethereum follows at $1,729.89, while BNB is holding steady at $589.54. XRP remains stagnant at $1.15.

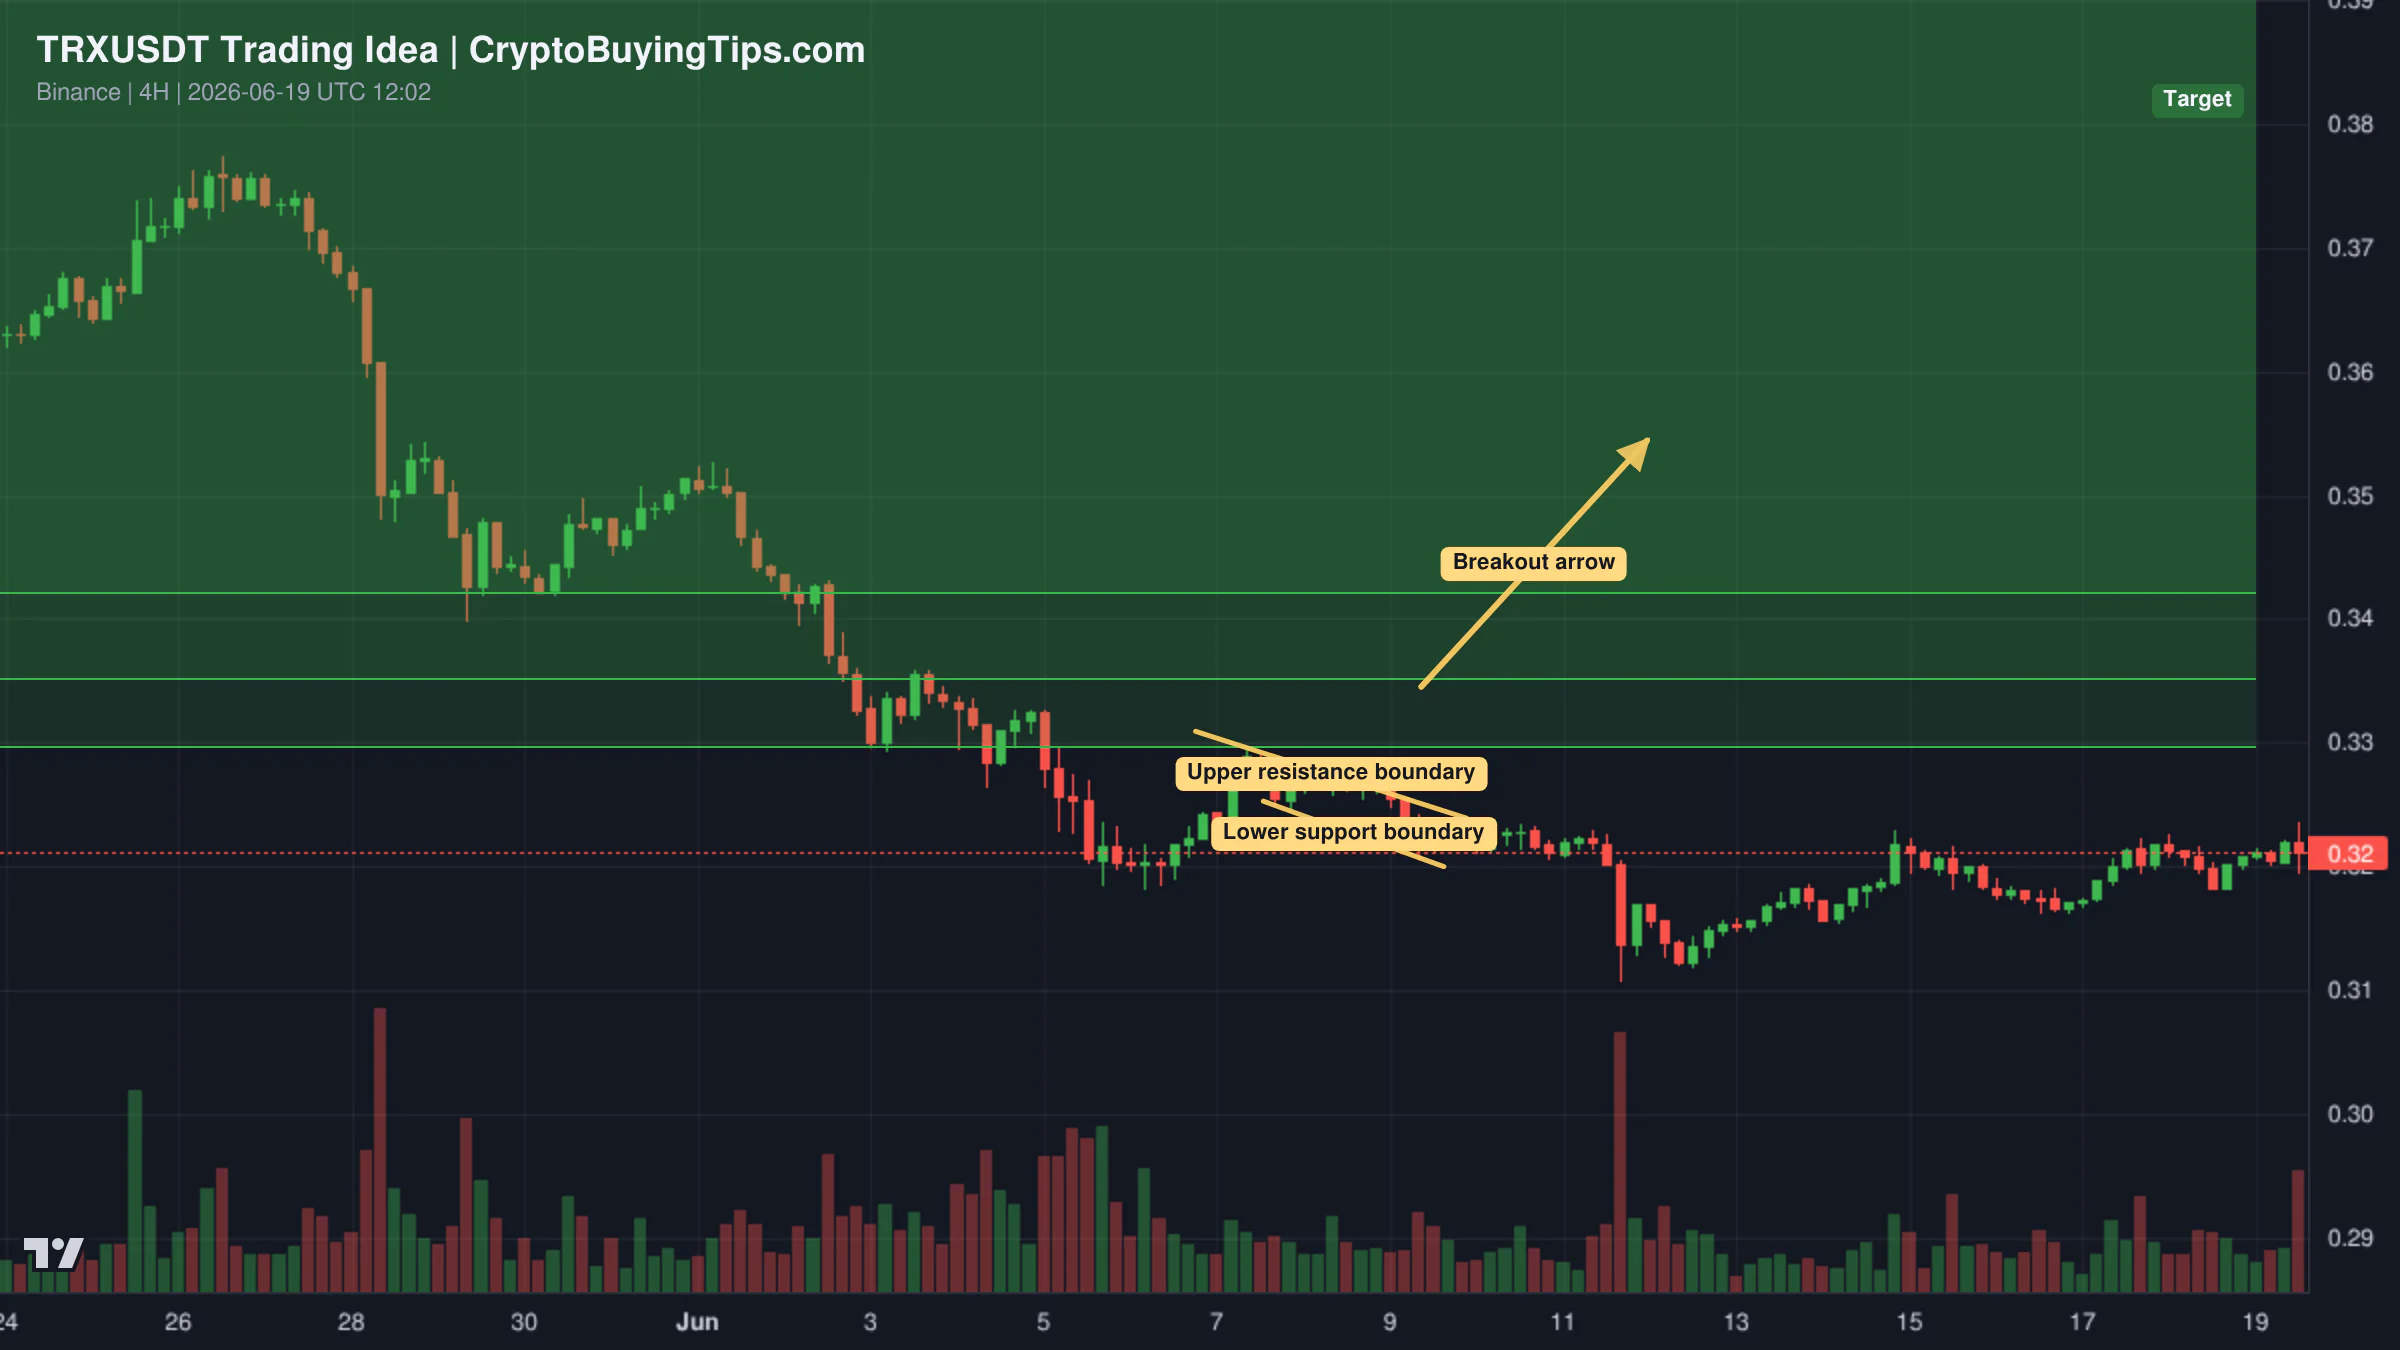
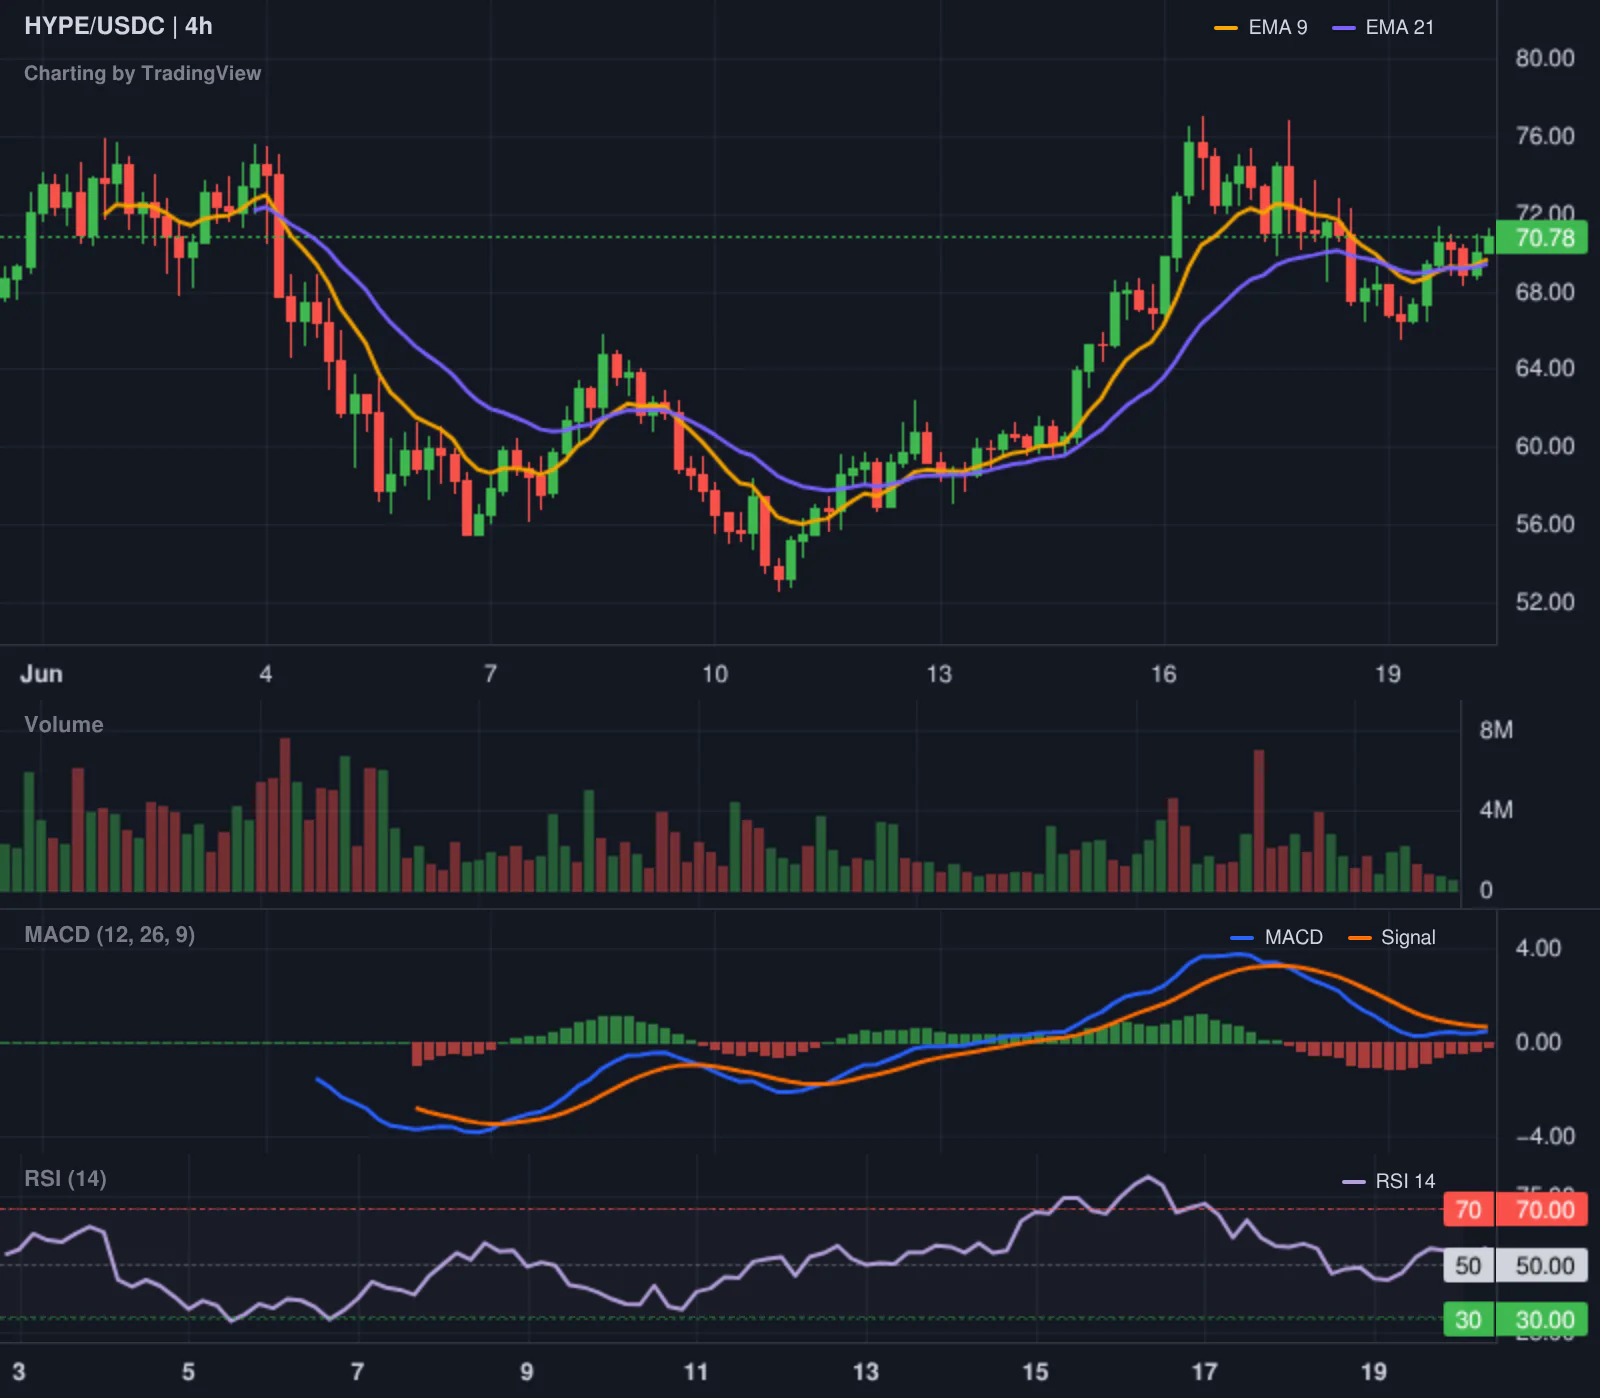
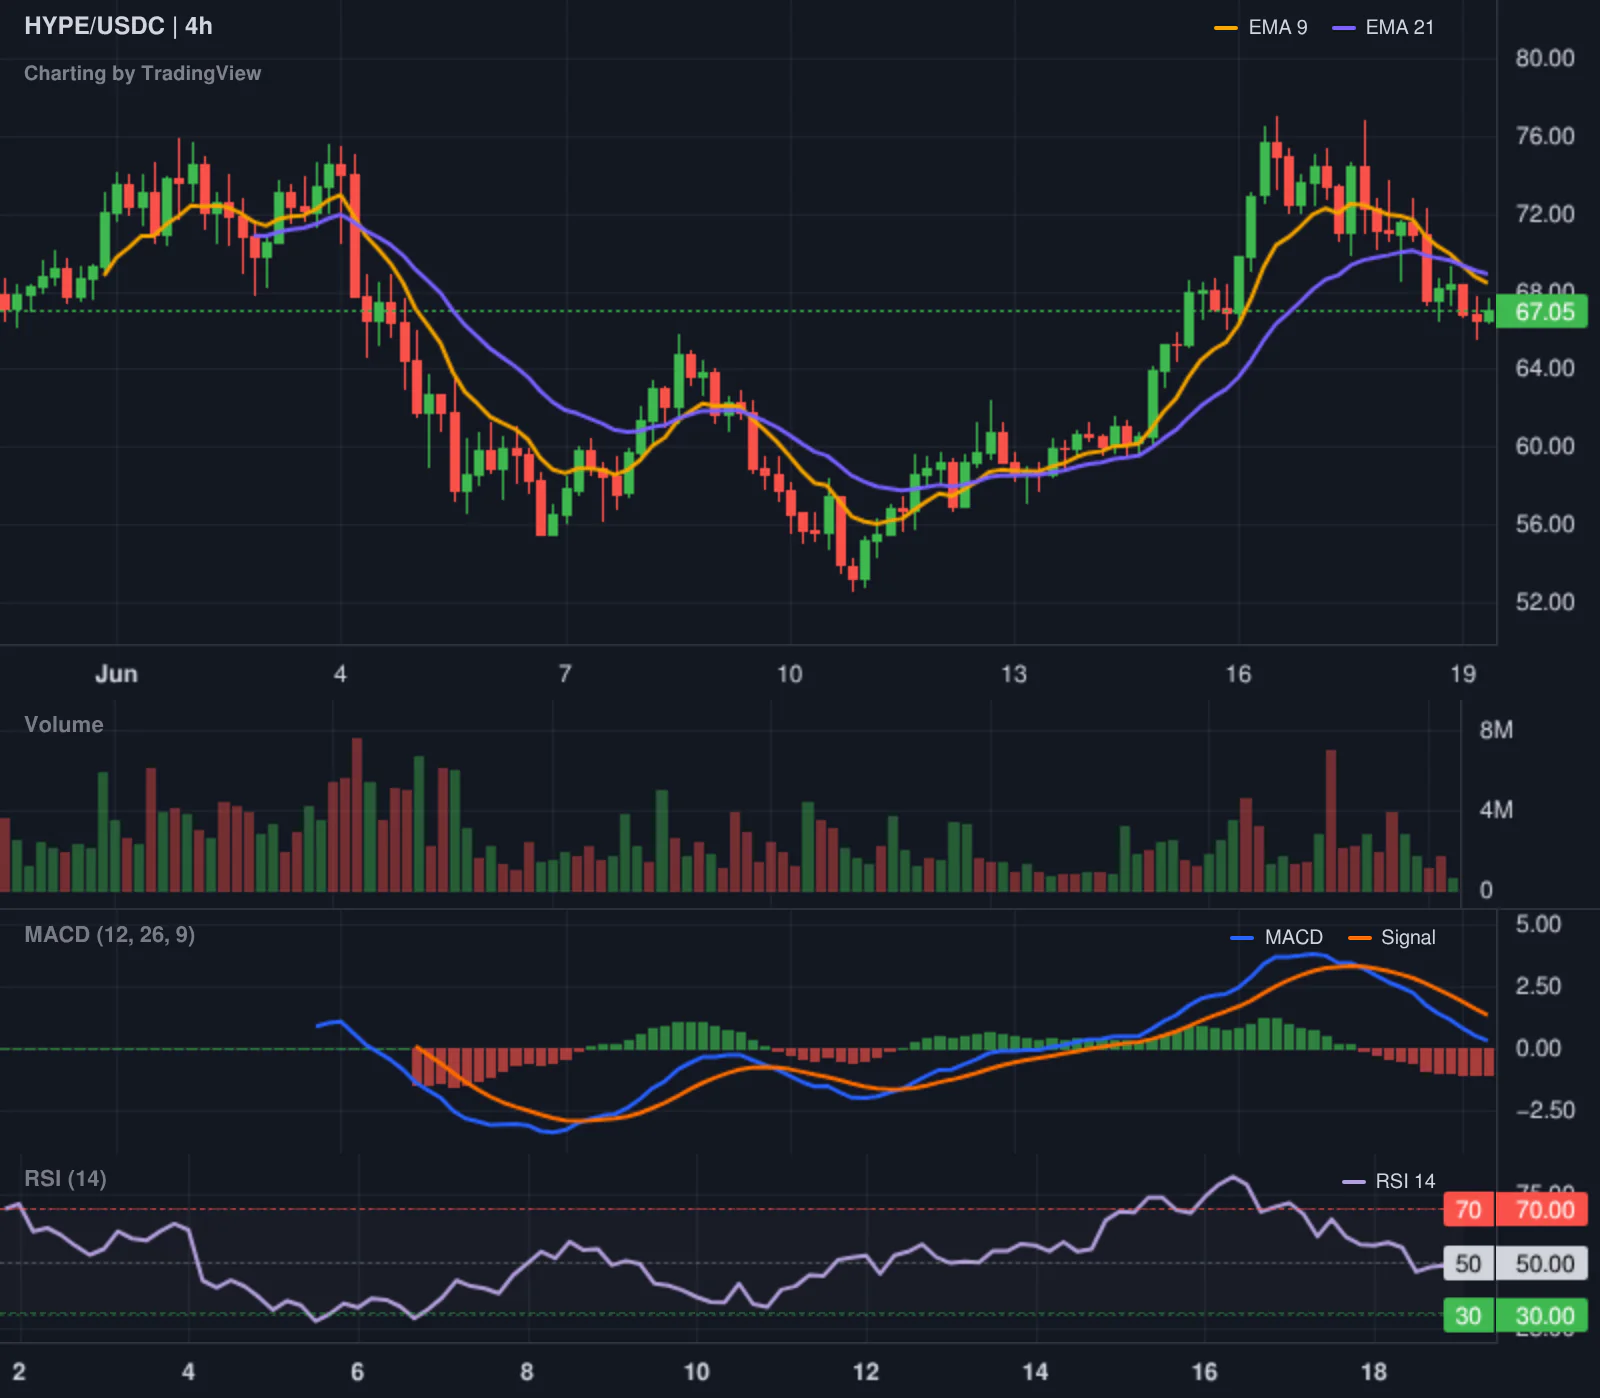
Solana is the standout performer among the majors, gaining 3.43% to reach $74.01. This strength suggests that when traders do venture into alts, they are prioritizing high-throughput chains over the legacy options. TRON is up 0.92% at $0.3264. Meanwhile, Hyperliquid has dropped 3.47% to $68.52, showing that even high-performing protocols aren't immune to the current volatility.

News driving today's market

Institutional adoption continues to trickle in through the back door. A Japanese corporate pension fund is planning a 1% allocation to crypto for currency diversification. While 1% sounds small, the scale of pension funds means this is a meaningful amount of sticky capital entering the ecosystem. This aligns with the broader trend of institutional conviction remaining high even when retail sentiment is in the gutter, a theme we previously covered regarding SOL ETFs filing news.

On the regulatory front, the EU is preparing "MiCA 2.0," with a focus on refining rules for DeFi and stablecoins. The industry is hoping for more clarity to maintain a competitive edge over the US. However, the lack of security in the DeFi space remains a persistent drag. The Secret Network's Axelar bridge was drained of $4.67 million in an exploit that went unnoticed for a full week. The fact that Axelar declined to freeze the remaining funds is a cold reminder that "code is law" often means "the hacker keeps the money." We previously covered tokenizing stocks trap for more background.

The broader financial world is also flirting with prediction markets. Charles Schwab is working with Cboe to launch binary options for the S&P 500. While not a crypto project, it signals that the "yes-or-no" betting style popularized by Polymarket is migrating into traditional brokerage accounts. This shift in risk appetite generally increases market depth, though it does little to solve the current liquidity crunch in altcoins.

Social intelligence

The on-chain data is currently a mix of high-stakes gambling and professional liquidation. The MEV bot jaredfromsubway was recently exploited for $7.7 million, with the attacker already moving 1,000 ETH into Tornado Cash. This is a stark reminder that in the world of automated trading, the only thing faster than a bot is a bot that finds a hole in your code.

Whale activity is showing a shift toward caution. The trader known as pension-usdt.eth, who had a remarkable 23-trade winning streak, recently closed a massive 60,000 ETH short for a $5.8 million profit. When a "smart trader" exits a massive short, it often suggests they believe the downward momentum has peaked, though it doesn't necessarily mean they are bullish.

Finally, the meme coin sector has reached a new level of absurdity. Pump fun's new bounty feature is paying users to perform humiliating stunts for crypto. Reports of people tattooing "bounty fun" on their foreheads for $15,000 is the kind of behavior that makes the "digital gold" narrative feel like a joke. It is a vivid illustration of the desperation that exists in the retail corners of the market.

Trading ideas worth watching

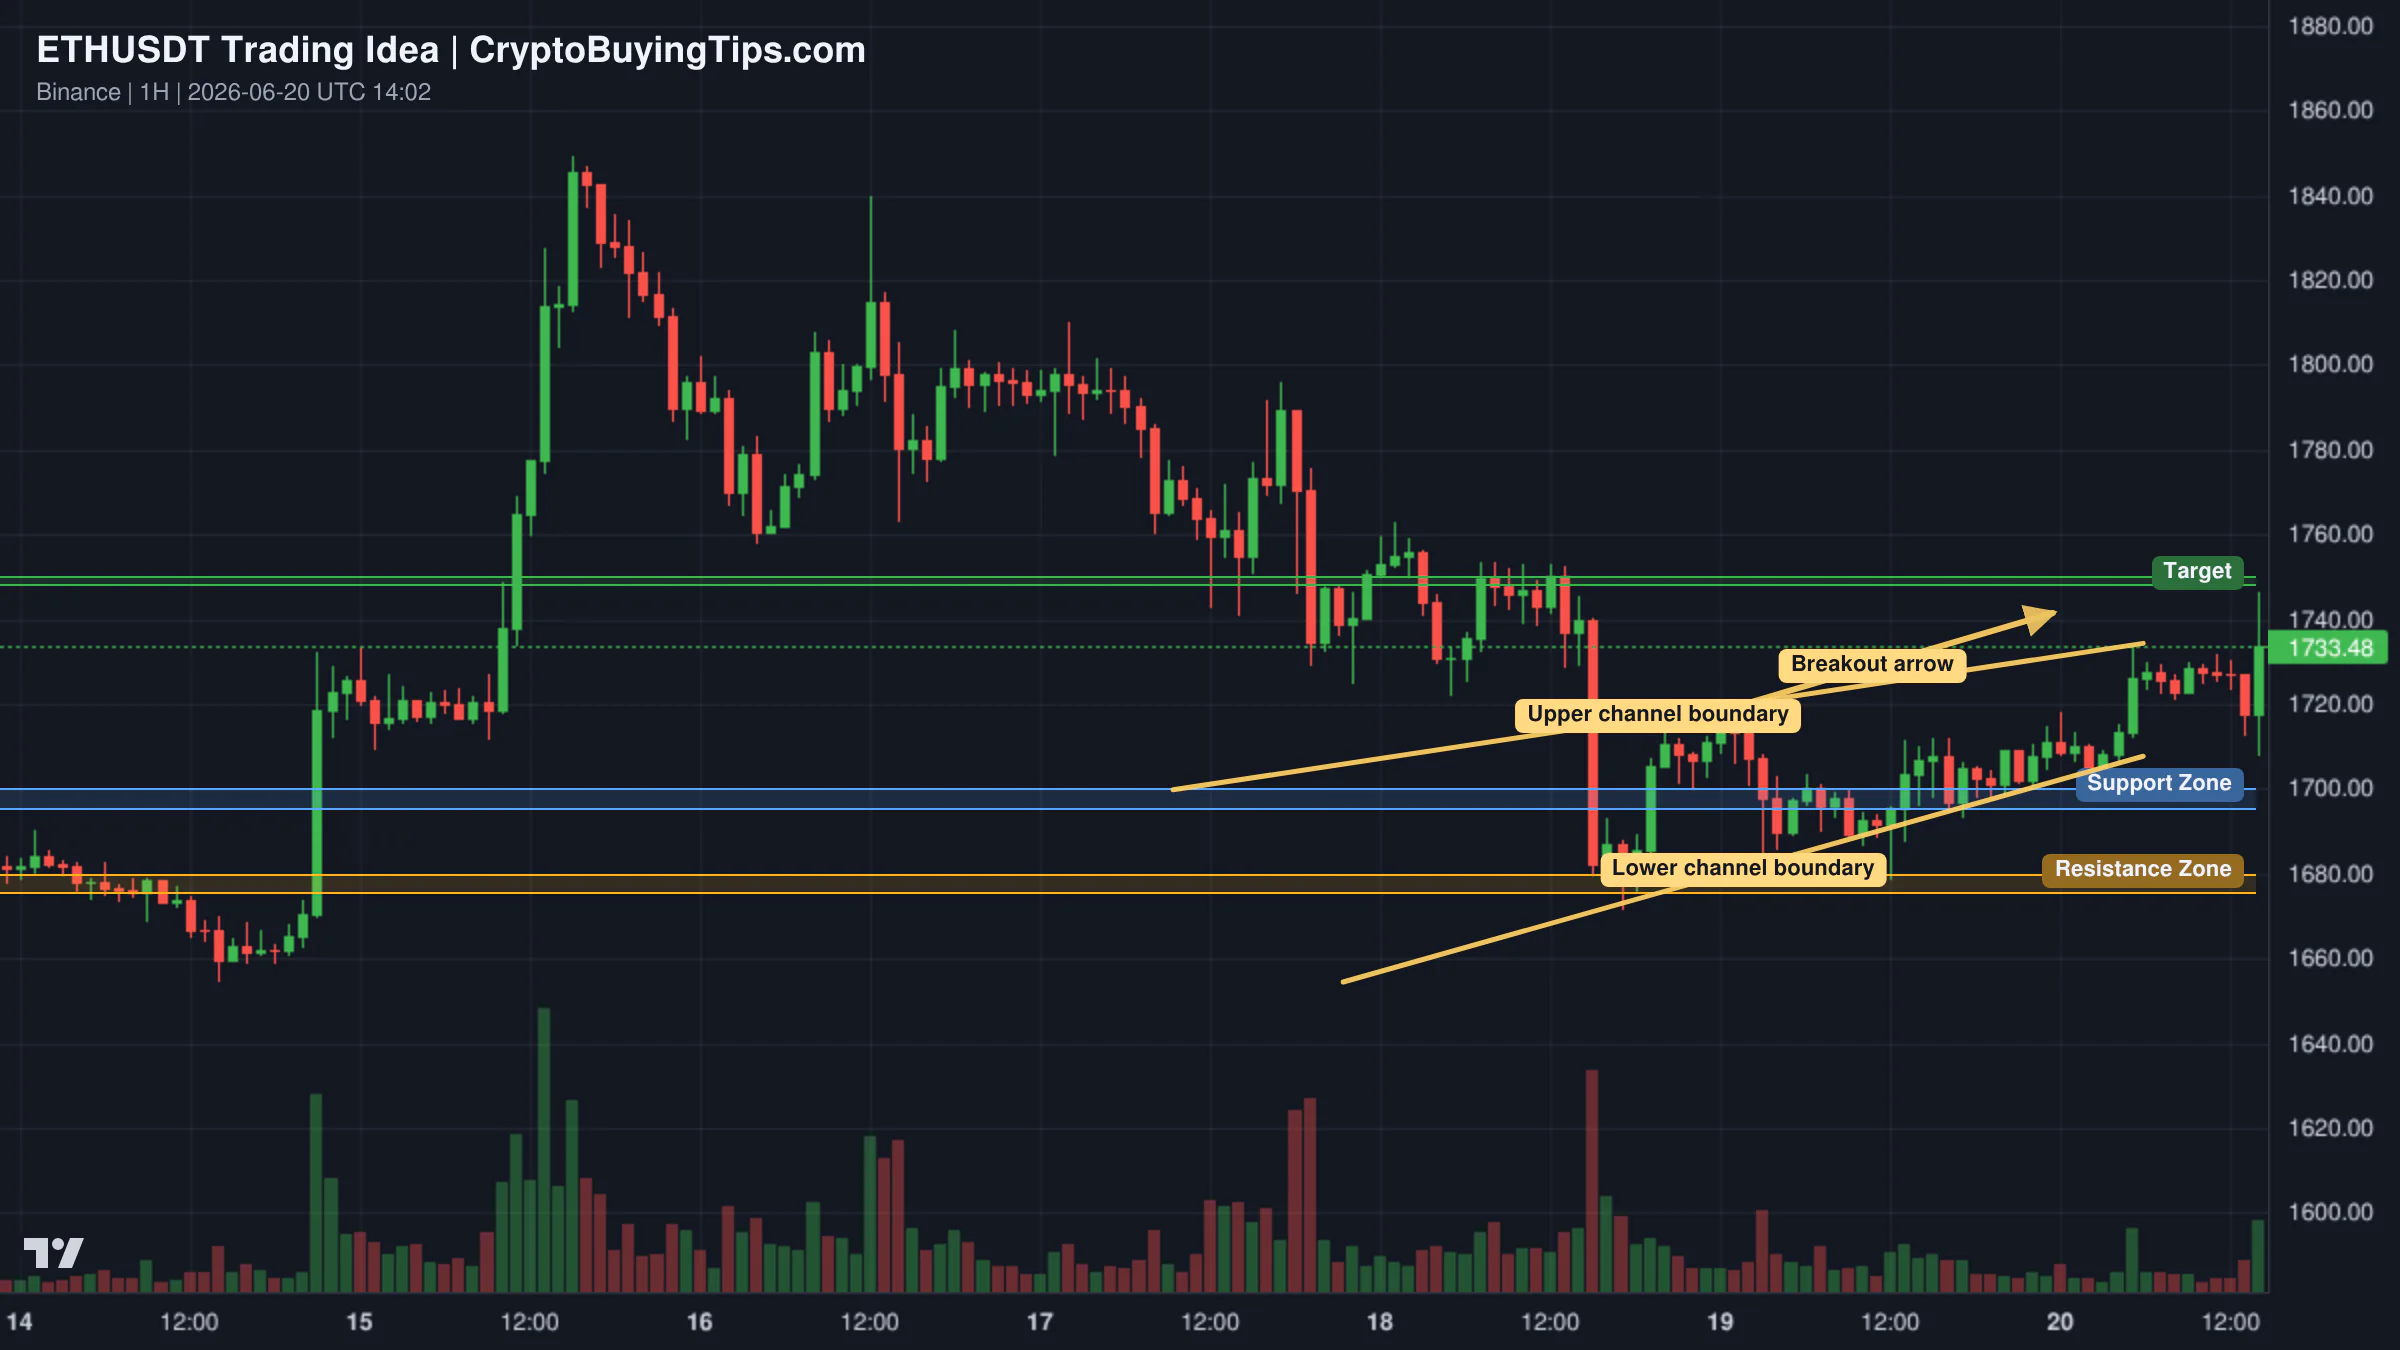
Ethereum is currently carving out a rising channel. After reclaiming support between $1,675 and $1,680, the price has drifted toward resistance at $1,720. The likely scenario is a short-term pullback toward the lower channel boundary around $1,695 to $1,700. If this support holds, a bounce toward the $1,748 to $1,750 zone is the next logical target. A break above $1,750 would be the first real signal that the asset is escaping its current malaise.

Redrawn ETHUSDT 60 trading idea chart for ETH Rising Channel Setup: Pullback Before the Next Push Higher

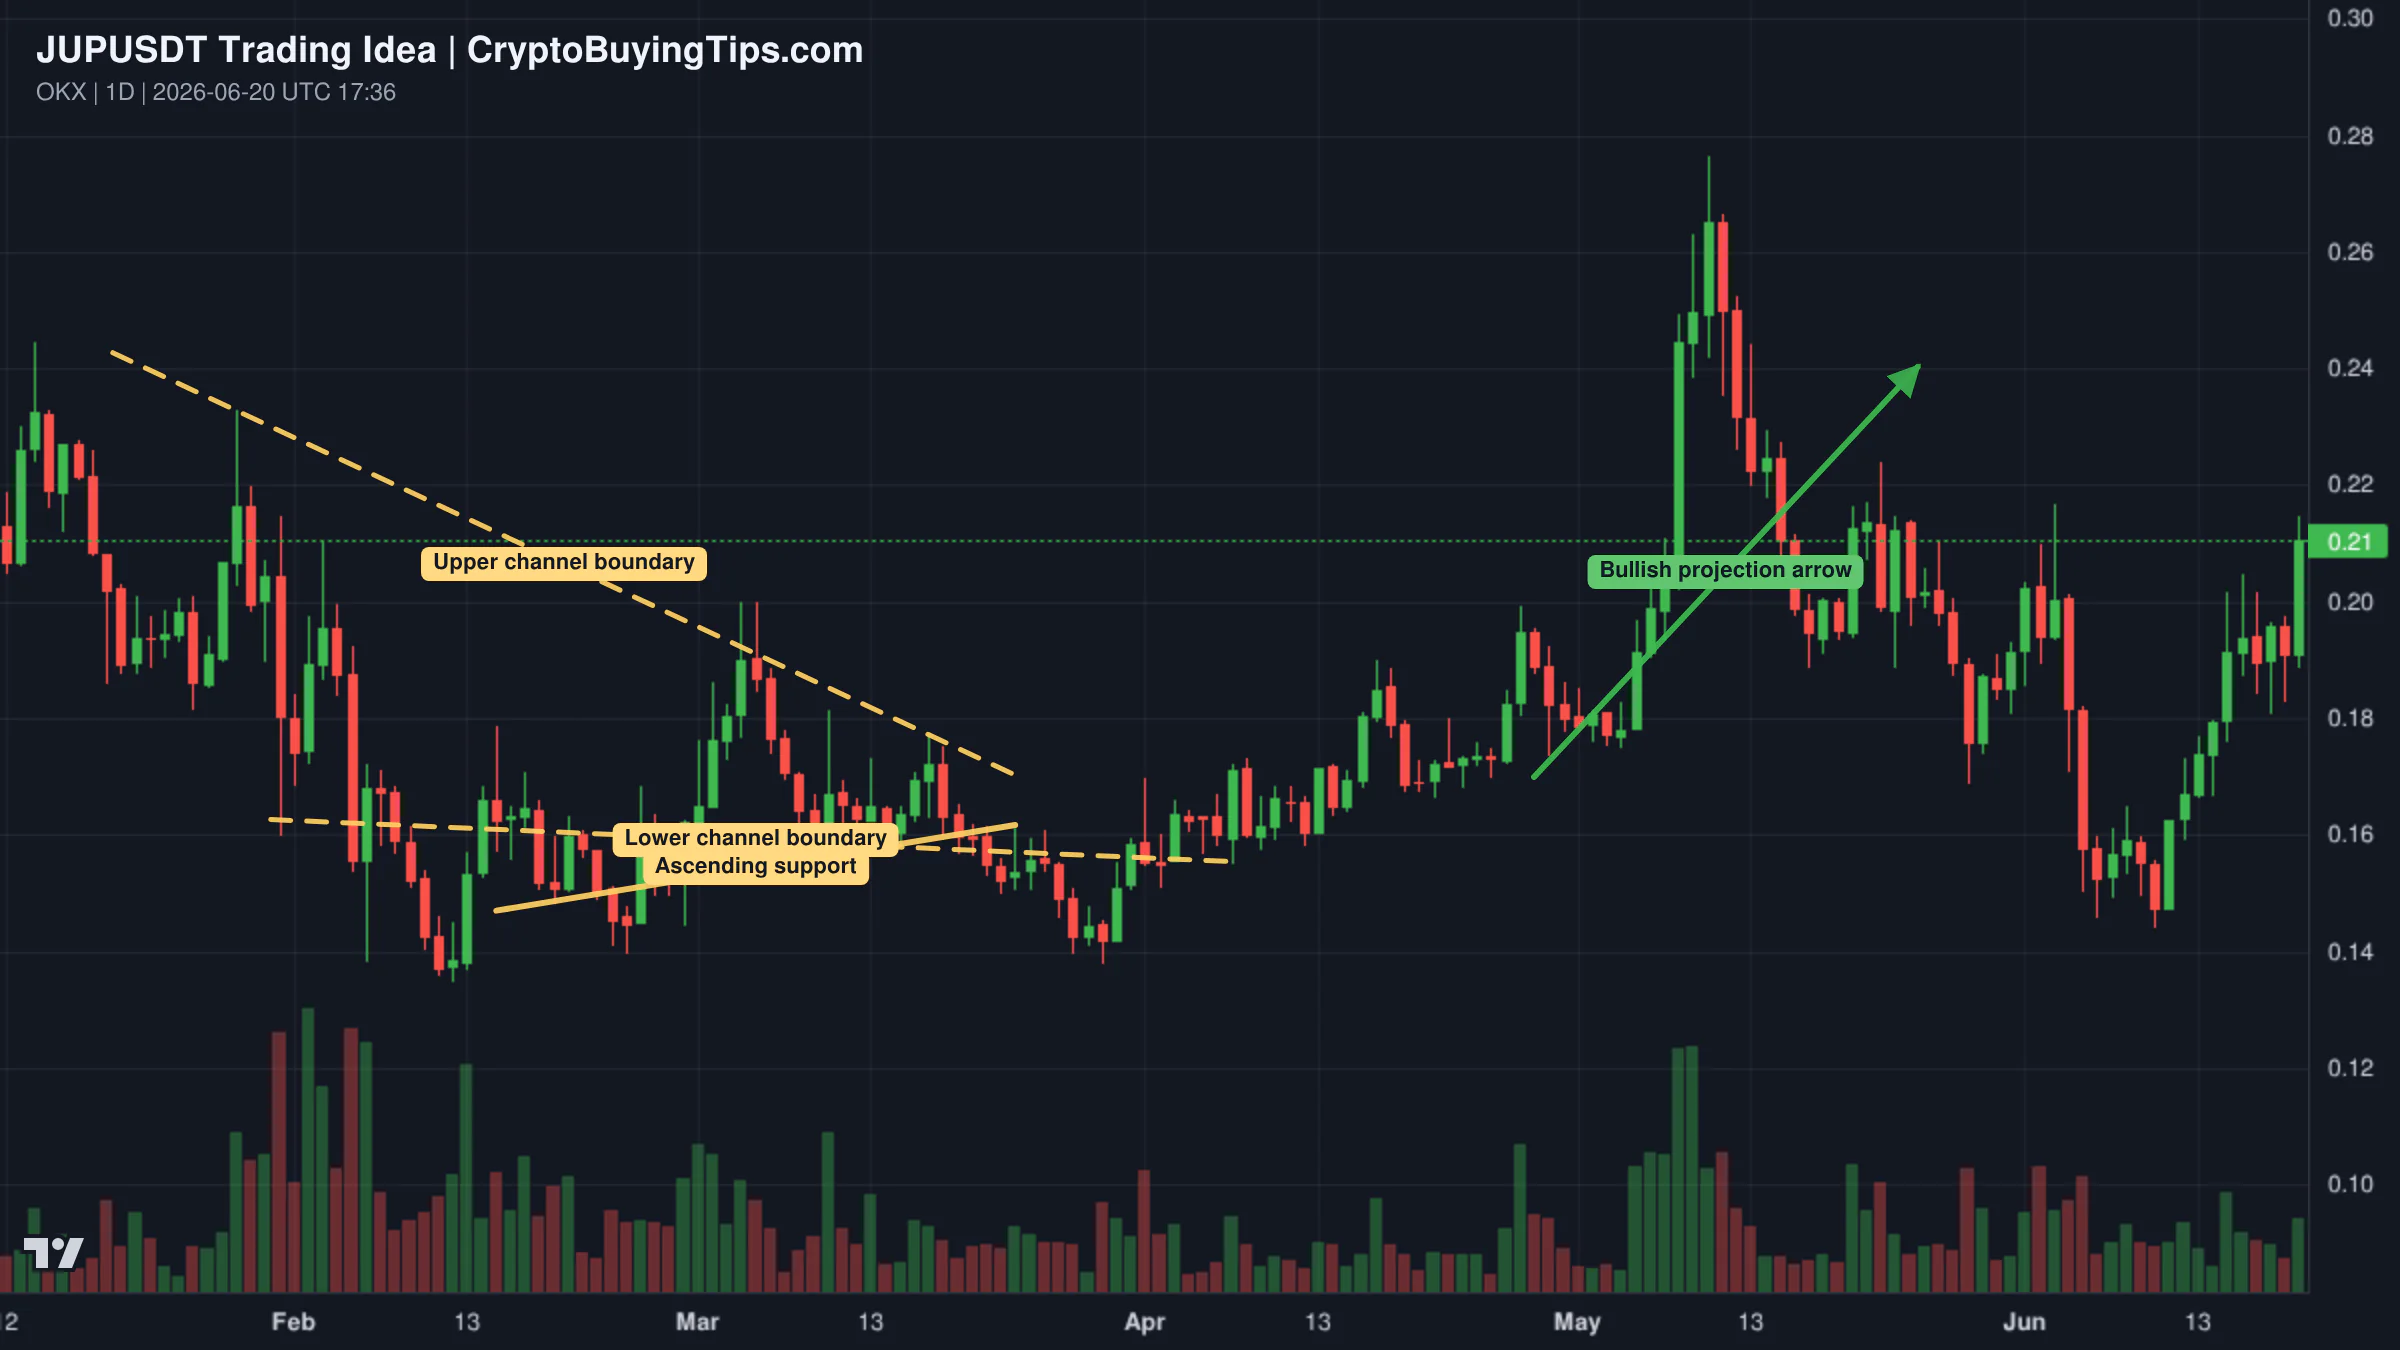
Jupiter is showing a structure of higher lows on the 2-day chart, suggesting the long-term downtrend ended months ago. The current setup looks like a retrace that has found a bottom, potentially leading to a new set of higher highs. For those tracking the Solana ecosystem, this is a high-conviction play on the recovery of altcoin liquidity.

Redrawn JUPUSDT 2D trading idea chart for Jupiter JUP-BOOM!

Dolomite (DOLO) is presenting a bullish divergence on the MACD and RSI. After a "final flush" that hunted stop-losses, the asset has produced a green candle that flipped a previous low into resistance. The setup suggests a return to the bottom accumulation range, with long-term targets looking significantly higher if the broader market stabilizes.

Smart Money Signals — Hyperliquid Leaderboard

Hyperliquid LONG HYPE leaderboard chart

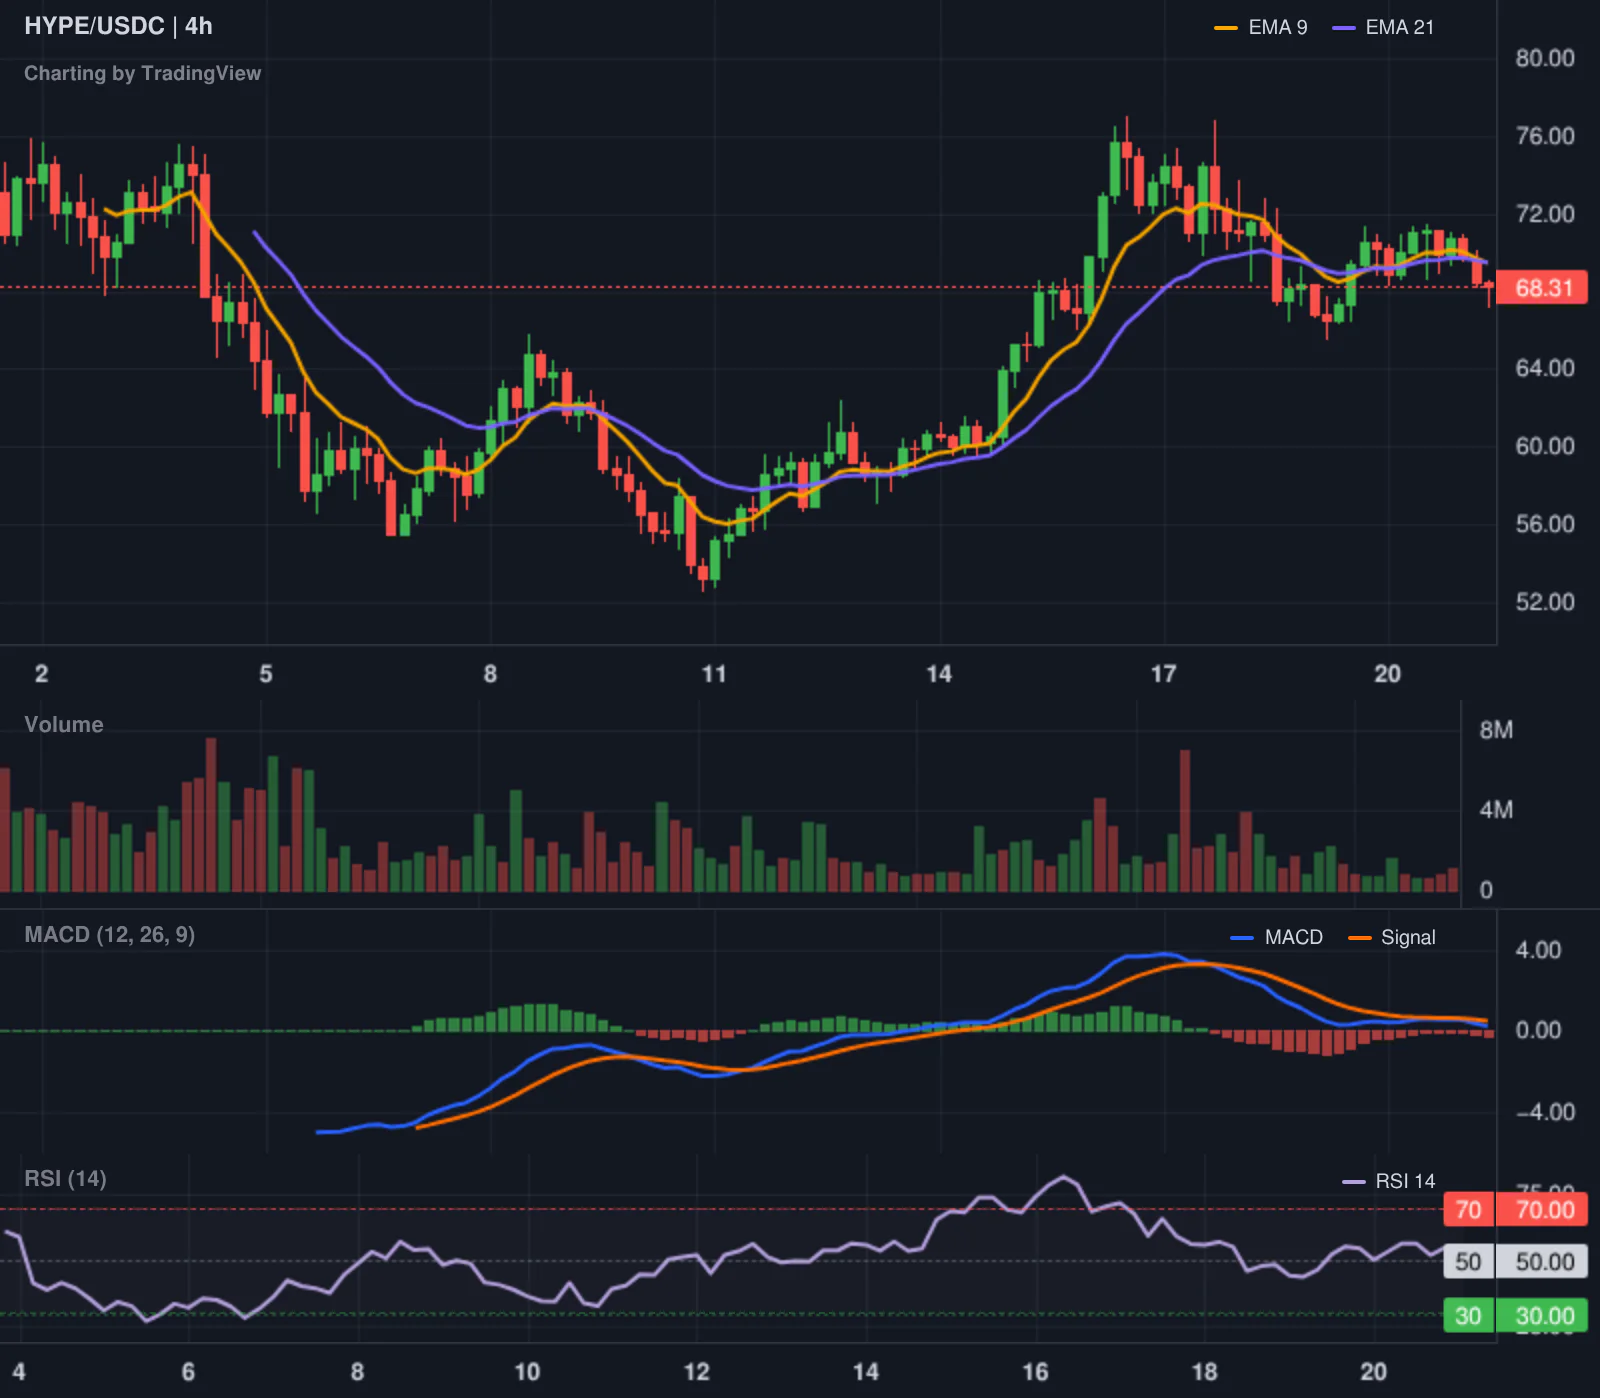
Our tracker has flagged a high-confidence move from trader kko, who boasts a 115% 30-day ROI. kko has opened a long position in HYPE at an entry price of $69, with a notional value of $76,741. Given kko's track record and the current price of $68.52, this is a bet that the recent dip in Hyperliquid is a buying opportunity rather than the start of a collapse.

What to watch next

The market is in a holding pattern. We have a bullish divergence where prices are rising while sentiment remains in "Fear," but the lack of volume suggests this is a fragile equilibrium. The key metric to watch over the next few days is Bitcoin dominance. If it continues to climb toward 60%, expect altcoins to continue bleeding regardless of whether Bitcoin moves sideways or up.

We are also watching the Ethereum gas fees. If they remain at these historic lows, it confirms a total lack of on-chain demand, making any price recovery purely a result of speculative trading rather than fundamental growth. The market is waiting for a reason to stop being afraid, but until the volume returns, the current drift is a dangerous place to get complacent.

Crypto Market Overview | bullish drift amid low volume and high retail fear | June 20, 2026
Sigrid Voss·

Crypto Market Overview | bullish drift amid low volume and high retail fear | June 20, 2026

Market overview

The crypto market is currently presenting a curious contradiction. Total market cap has ticked up to $2.27T, reflecting a short-term bullish drift, yet the Fear and Greed Index is sitting at a dismal 21. It is the classic market irony: prices are climbing while the retail crowd is convinced the world is ending. This sentiment gap is further highlighted by the top 20 and top 100 indices, both of which posted gains of nearly 2% today.

Under the surface, the conviction behind this move is questionable. While the market cap rose, 24-hour trading volume plummeted by over 30%, falling to $52.21B. Even more telling is the collapse in derivatives activity, with volume dropping 35.15% to $492.35B. When prices rise on thinning volume and disappearing leverage, it usually suggests a lack of aggressive buying. We are seeing a market that is drifting higher simply because there isn't enough selling pressure to keep it down, rather than a coordinated surge of confidence.

Bitcoin dominance remains the dominant theme, currently at 58.26%. Money is rotating back into the flagship asset, effectively starving the broader altcoin market. This is confirmed by the Altcoin Season Index, which sits at a neutral 44, suggesting we are firmly in a Bitcoin season. With stablecoin dominance at 11.49%, there is still a significant amount of capital sitting on the sidelines, waiting for a clearer signal before deploying into riskier assets.

Bitcoin and Ethereum

Bitcoin is trading at $63,589.06, up 1.77% over the last 24 hours. The price action is being supported by a wave of institutional product innovation. Franklin Templeton has filed for two new ETFs that would systematically convert corporate dividends from US stocks into Bitcoin exposure. This is a structural shift; it turns passive equity income into a steady, automated feed of demand for BTC. It is the kind of "set and forget" institutional plumbing that creates a floor for the price over the long term.

However, the immediate horizon is clouded by a $13B options expiry. Current data suggests bears hold the upper hand in this event, which often introduces short-term volatility and downside pressure. While the macro trend is being bolstered by institutional adoption, the derivatives market is currently a minefield.

Ethereum is priced at $1,725.6, marking a 2.05% gain. Despite the price tick, the internal health of the network is a point of contention. Reports from former contributors suggest a core development funding crisis, with the network potentially needing $30 million in annual funding to maintain its ecosystem. This coincides with a wave of departures from the Ethereum Foundation. When the people building the road start leaving the construction site, it usually warrants a closer look.

On the positive side, on-chain activity is quiet, with gas fees remaining very low at around 1.24 Gwei for fast transactions. We are also seeing some whale accumulation, with reports of significant ETH withdrawals from Binance by entities like K3 Capital and Chun Wang. This suggests that while the developers are arguing about budgets, the big money is still happy to hold the asset.

Top crypto prices

The market is showing a preference for high-beta assets and established ecosystems today. Solana is a standout performer, up 4.91% to $71.42. Hyperliquid has seen an even stronger move, climbing 6.28% to $70.73.

Other notable movements include BNB rising 2.39% to $585.69 and XRP increasing 2.29% to $1.14. TRON remains relatively flat, up 0.60% to $0.3233.

News driving today's market

The primary catalyst is the Franklin Templeton filing. By linking traditional equity dividends to Bitcoin exposure, the firm is bridging the gap between the S&P 500 and digital assets. This follows a broader trend of institutional integration we previously covered regarding direct BTC and ETH trading.

In the DeFi space, the narrative is shifting toward Real World Assets (RWA). The Philippine SEC has signaled readiness for RWA tokenization, and overall tokenized RWAs have topped $43 billion. This is a genuine move toward utility, though we remain skeptical of "everything apps" that are essentially just centralized receipts. We previously discussed how tokenized stocks mean for investors and the risks of the tokenizing stocks trap.

Regulatory pressure is also mounting. The US House has introduced a bill to ban lawmakers from betting on prediction markets, and the FBI is publicly vowing to hunt down crypto scammers. While these are targeted actions, they contribute to the general atmosphere of "regulatory cleanup" that keeps retail sentiment in the "Fear" zone.

Social intelligence

The social sentiment is a mix of whale accumulation and security warnings. On-chain trackers like @lookonchain are flagging heavy ETH accumulation from Binance, which often precedes a price floor. However, the mood on X is dampened by reports of malware spreading via Steam's Wallpaper Engine to steal crypto credentials. It is a reminder that while the institutions are building ETFs, the average user is still fighting off anime-themed infostealers.

Geopolitical noise is also present, with reports of Russia selling a stake in a seized gold miner for $1.3B. While not a direct crypto event, these massive state-level commodity shifts often impact global risk appetite and the relative attractiveness of BTC as "digital gold."

Trading ideas worth watching

For Ethereum, the technical outlook remains cautious. The asset is trading below a falling trendline and consistently printing lower highs. While there is a support zone between $1,350 and $1,500 that is acting as a magnet, a recovery requires a clean break above the current red resistance structure. Until that happens, the bears are effectively in control of the daily timeframe.

Redrawn ETHUSDT 1D trading idea chart for ETH – Bears Still Have the Upper Hand

TRON is showing a more constructive pattern. An ascending triangle is developing on the 4-hour chart, suggesting buyers are gradually regaining momentum. A confirmed breakout could trigger a move toward targets at 0.3295 and 0.3350. This is a low-volatility play compared to the rest of the market, but the structure is textbook.

Redrawn TRXUSDT 240 trading idea chart for TRX: Ascending Triangle Could Open the Door to Higher Targets

Solana has recovered back above critical support and is currently retracing. Some analysts are eyeing a long position in the $62 to $70 entry zone, with an aggressive target set as high as $188. However, this is a high-leverage setup. The key invalidation point is a weekly close below $60. For those who prefer not to gamble with 7x leverage, simply buying spot at support remains the safer bet.

Smart Money Signals — Hyperliquid Leaderboard

Hyperliquid LONG HYPE leaderboard chart

Our tracking of the Hyperliquid leaderboard shows that top trader 'kko' has opened a LONG position in HYPE at $69. This trader has a 30-day ROI of 115% and a total PnL of $137.1K. The position size is significant, with a notional value of $76,741. This signal aligns with the 6.28% gain HYPE has seen today, suggesting that "smart money" is riding the momentum of the protocol's current growth.

Altcoin Spotlight

Hyperliquid deserves attention today. Not only is it leading the gains among the top 10 assets, but it is also seeing direct backing from leaderboard traders. With a market cap of $17.91B and a price of $70.73, it is benefiting from the current rotation into high-performance DeFi infrastructure. While Bitcoin dominance is high, HYPE is one of the few assets showing genuine strength and volume-backed interest.

What to watch next

The immediate focus is the $13B Bitcoin options expiry. If the bears successfully push the price lower during this event, the current "bullish drift" will be revealed as a fake-out. Conversely, if BTC holds its ground despite the pressure, it will be a strong signal that institutional demand is overriding the retail fear.

Keep an eye on the Ethereum funding situation. If the reports of a core development crisis are verified or lead to more high-profile departures, the "whale accumulation" we are seeing may not be enough to stop a deeper correction. Finally, watch the volume. A market that rises on falling volume is a fragile market. We need to see a return of trading activity to confirm that this isn't just a low-liquidity bounce.

Crypto Market Overview | broad liquidity withdrawal amid extreme fear and regulatory pressure | June 19, 2026
Sigrid Voss·

Crypto Market Overview | broad liquidity withdrawal amid extreme fear and regulatory pressure | June 19, 2026

Market overview

The crypto market is currently in a high-stress environment, with the total market cap sliding to $2.24T. This decline is not a localized dip but a broad withdrawal of liquidity. Spot volume, derivatives volume, and DeFi activity are all trending downward simultaneously, which usually suggests that traders are not rotating into different assets but are simply exiting the arena.

The disconnect in sentiment is particularly stark. The Fear & Greed Index has plummeted to 19, placing the market in a state of extreme fear. While such readings often precede a local bottom, the immediate price action remains bearish. Bitcoin dominance sits at 55.97%, indicating that while the entire market is bleeding, altcoins are generally suffering more. The Altcoin Season Index is contradictory across data sources, with some metrics suggesting a neutral zone and others flagging a late-stage altcoin season, but the price action for the top 100 assets tells a clearer story of systemic decline.

Interestingly, traditional risk assets are moving in the opposite direction. The S&P 500 and NASDAQ are both up, with the NASDAQ climbing 2.51%. This divergence suggests that the current panic is specific to the crypto ecosystem rather than a global risk-off event. The market is effectively ignoring the TradFi rally, preoccupied instead with a domestic regulatory storm in the US.

Bitcoin and Ethereum

Bitcoin is trading at $62,484.85, down 2.53% over the last 24 hours. The price is currently hovering near a critical support zone between $63,700 and $64,770. If this level fails, the next significant liquidity pocket sits lower, near the $60,000 mark. The bearish momentum is reinforced by a massive liquidation event, with over $361M in long positions wiped out in a single day. This suggests that the recent move was less about fundamental selling and more about a leveraged cascade.

Ethereum has fared worse, dropping 3.34% to $1,691.01. Beyond the price drop, the network is eerily quiet. Gas fees have fallen to a range of 0.08 to 0.11 Gwei, signaling a collapse in on-chain demand. When gas is this low during a price correction, it typically means the "degens" have stopped trading, leaving the asset to be moved primarily by institutional flows and algorithmic bots.

Despite the immediate gloom, there are institutional flickers of hope. Morgan Stanley has filed amendments for both ETH and SOL ETFs, aiming for the lowest fees in the market. This suggests that while retail traders are panicking, the largest players in the world are still trying to build the plumbing for mass adoption.

Top crypto prices

The broader market is seeing a sea of red. BNB has fallen 3.03% to $572.01, and XRP is down 3.97% at $1.12. Solana has experienced a sharper decline of 4.27%, now trading at $68.06.

The only notable outlier among the majors is TRON, which managed a slight gain of 0.18% to $0.3214. In a market of extreme fear, the assets that hold their ground usually do so because they are perceived as "safe havens" or are tied to stablecoin utility that remains necessary even during a crash. Hyperliquid has been hit hard, dropping 7.14% to $66.49, reflecting the general volatility of high-beta ecosystem tokens when liquidity dries up.

News driving today's market

The primary driver of today's bearish sentiment is a coordinated regulatory push from the US Federal Reserve and Treasury. The agencies have proposed new rulemaking under the GENIUS Act that would require stablecoin issuers to maintain customer identification programs similar to those used by regulated banks. For the crypto market, stablecoins are the primary source of liquidity. Adding bank-grade KYC requirements to these issuers introduces significant operational friction and threatens the anonymity and speed that make DeFi attractive. We previously covered Bittensor for more background.

Parallel to this, the introduction of the CLARITY Act (the Digital Asset Market Clarity Act) signals that the US is finally attempting to build a comprehensive federal framework for digital assets. While long-term clarity is usually bullish, the process of getting there is often messy and filled with uncertainty, which traders hate.

On the institutional side, there is a curious mix of signals. Franklin Templeton has proposed a "Bitcoin DRIP" ETF that would funnel stock dividends into Bitcoin. This is a clever way to create a permanent, automated bid for the asset. We also saw news that Alchemy's AI-driven identity service now has access to the Visa network, allowing AI agents to make purchases. This is a genuine step toward "agentic commerce," though it does little to stop the current price bleed.

We previously covered the SOL ETFs filing news, and the latest Morgan Stanley amendments confirm that the institutional appetite for Solana and Ethereum remains intact even as the Fear & Greed Index hits rock bottom.

Social intelligence

The social mood is a mix of macro anxiety and technical post-mortems. On the macro front, the CME FedWatch tool shows a 40.6% chance of a rate hike at the July 29 meeting. In a world of extreme fear, the prospect of higher borrowing costs is a heavy weight on risk assets.

The derivatives market is also providing a cautionary tale. The CEO of Strive, Cole Macro, described today as the most difficult day in Digital Credit's history. He attributed the sharp drops in STRC and SATA to a leverage liquidation event rather than a failure in credit quality. This mirrors the broader market experience, where forced selling triggers a cascade that pushes prices far below their actual "fair value" for the day.

There is also a growing narrative around "agentic activity." Analysts like @ethereumJoseph suggest that a huge amount of AI agent activity will hit the chain by the end of the year. While this is a bullish long-term thesis, it is currently being drowned out by the immediate reality of $361M in liquidated longs.

Trading ideas worth watching

For Bitcoin, there is a strong case for a relief rally if the current support holds. Analysis suggests that BTC is currently sitting in a "Time Reversal Zone" (TRZ) between $63,720 and $64,770. From an Elliott Wave perspective, this could be the bottom of a corrective Wave 4. If the price can hold above the $62,887 stop-loss level, the first target for a bounce is $65,737, with a more ambitious target near $68,650 where short liquidations are clustered.

Redrawn BTCUSDT 30 trading idea chart for BTC/USDT: Descending Trendline Break Could Trigger a RecoveryRedrawn BTCUSDT 240 trading idea chart for Bitcoin Near TRZ and Support _ A Rebound Be Loading

Another perspective on BTCUSDT focuses on a descending trendline. The price has defended the $63,700-$63,800 zone multiple times. A decisive break above the local descending trendline would shift the short-term momentum back to the bulls and likely trigger a move toward the 100-period SMA near $65,300. Until that breakout happens, the structure remains cautious.

For XRP, the focus is on a "blue wedge" pattern. The asset is currently retesting the lower bound of this wedge, which coincides with a strong demand zone. As long as this intersection holds, the broader structure remains bullish. However, a confirmed recovery requires a break above the red channel to signal that the correction phase has ended and the next impulse move is beginning.

Smart Money Signals — Hyperliquid Leaderboard

Hyperliquid LONG HYPE leaderboard chart

Our tracker has flagged a high-confidence move from trader kko, who has a 115% 30-day ROI. kko has opened a long position in HYPE at an entry price of $69, with a notional value of $76,741. Given that HYPE has dropped over 7% today, this is a classic "buy the blood" play from a trader who has consistently outperformed the market.

What to watch next

The immediate focus is on the $63,000 level for Bitcoin. If the market can stabilize here, the extreme fear reading (19) may actually act as a contrarian indicator for a sharp bounce. However, the regulatory pressure on stablecoins is the real "black swan" to watch. If the Fed's proposed KYC rules lead to a significant exodus of liquidity from USDT or USDC, the price floors we are currently watching will not matter.

Keep an eye on the July 29 Fed meeting probabilities. If the chance of a rate hike climbs higher, the "risk-off" sentiment will likely persist regardless of how many ETFs Morgan Stanley files. For now, the market is in a state of paralysis, waiting to see if the institutional bid is strong enough to absorb the retail panic.