
Crypto Market Overview | relief rallies meet volume collapse amid institutional inflows and regulatory uncertainty | July 4, 2026
Crypto Market Overview | relief rallies meet volume collapse amid institutional inflows and regulatory uncertainty | July 4, 2026
Market overview
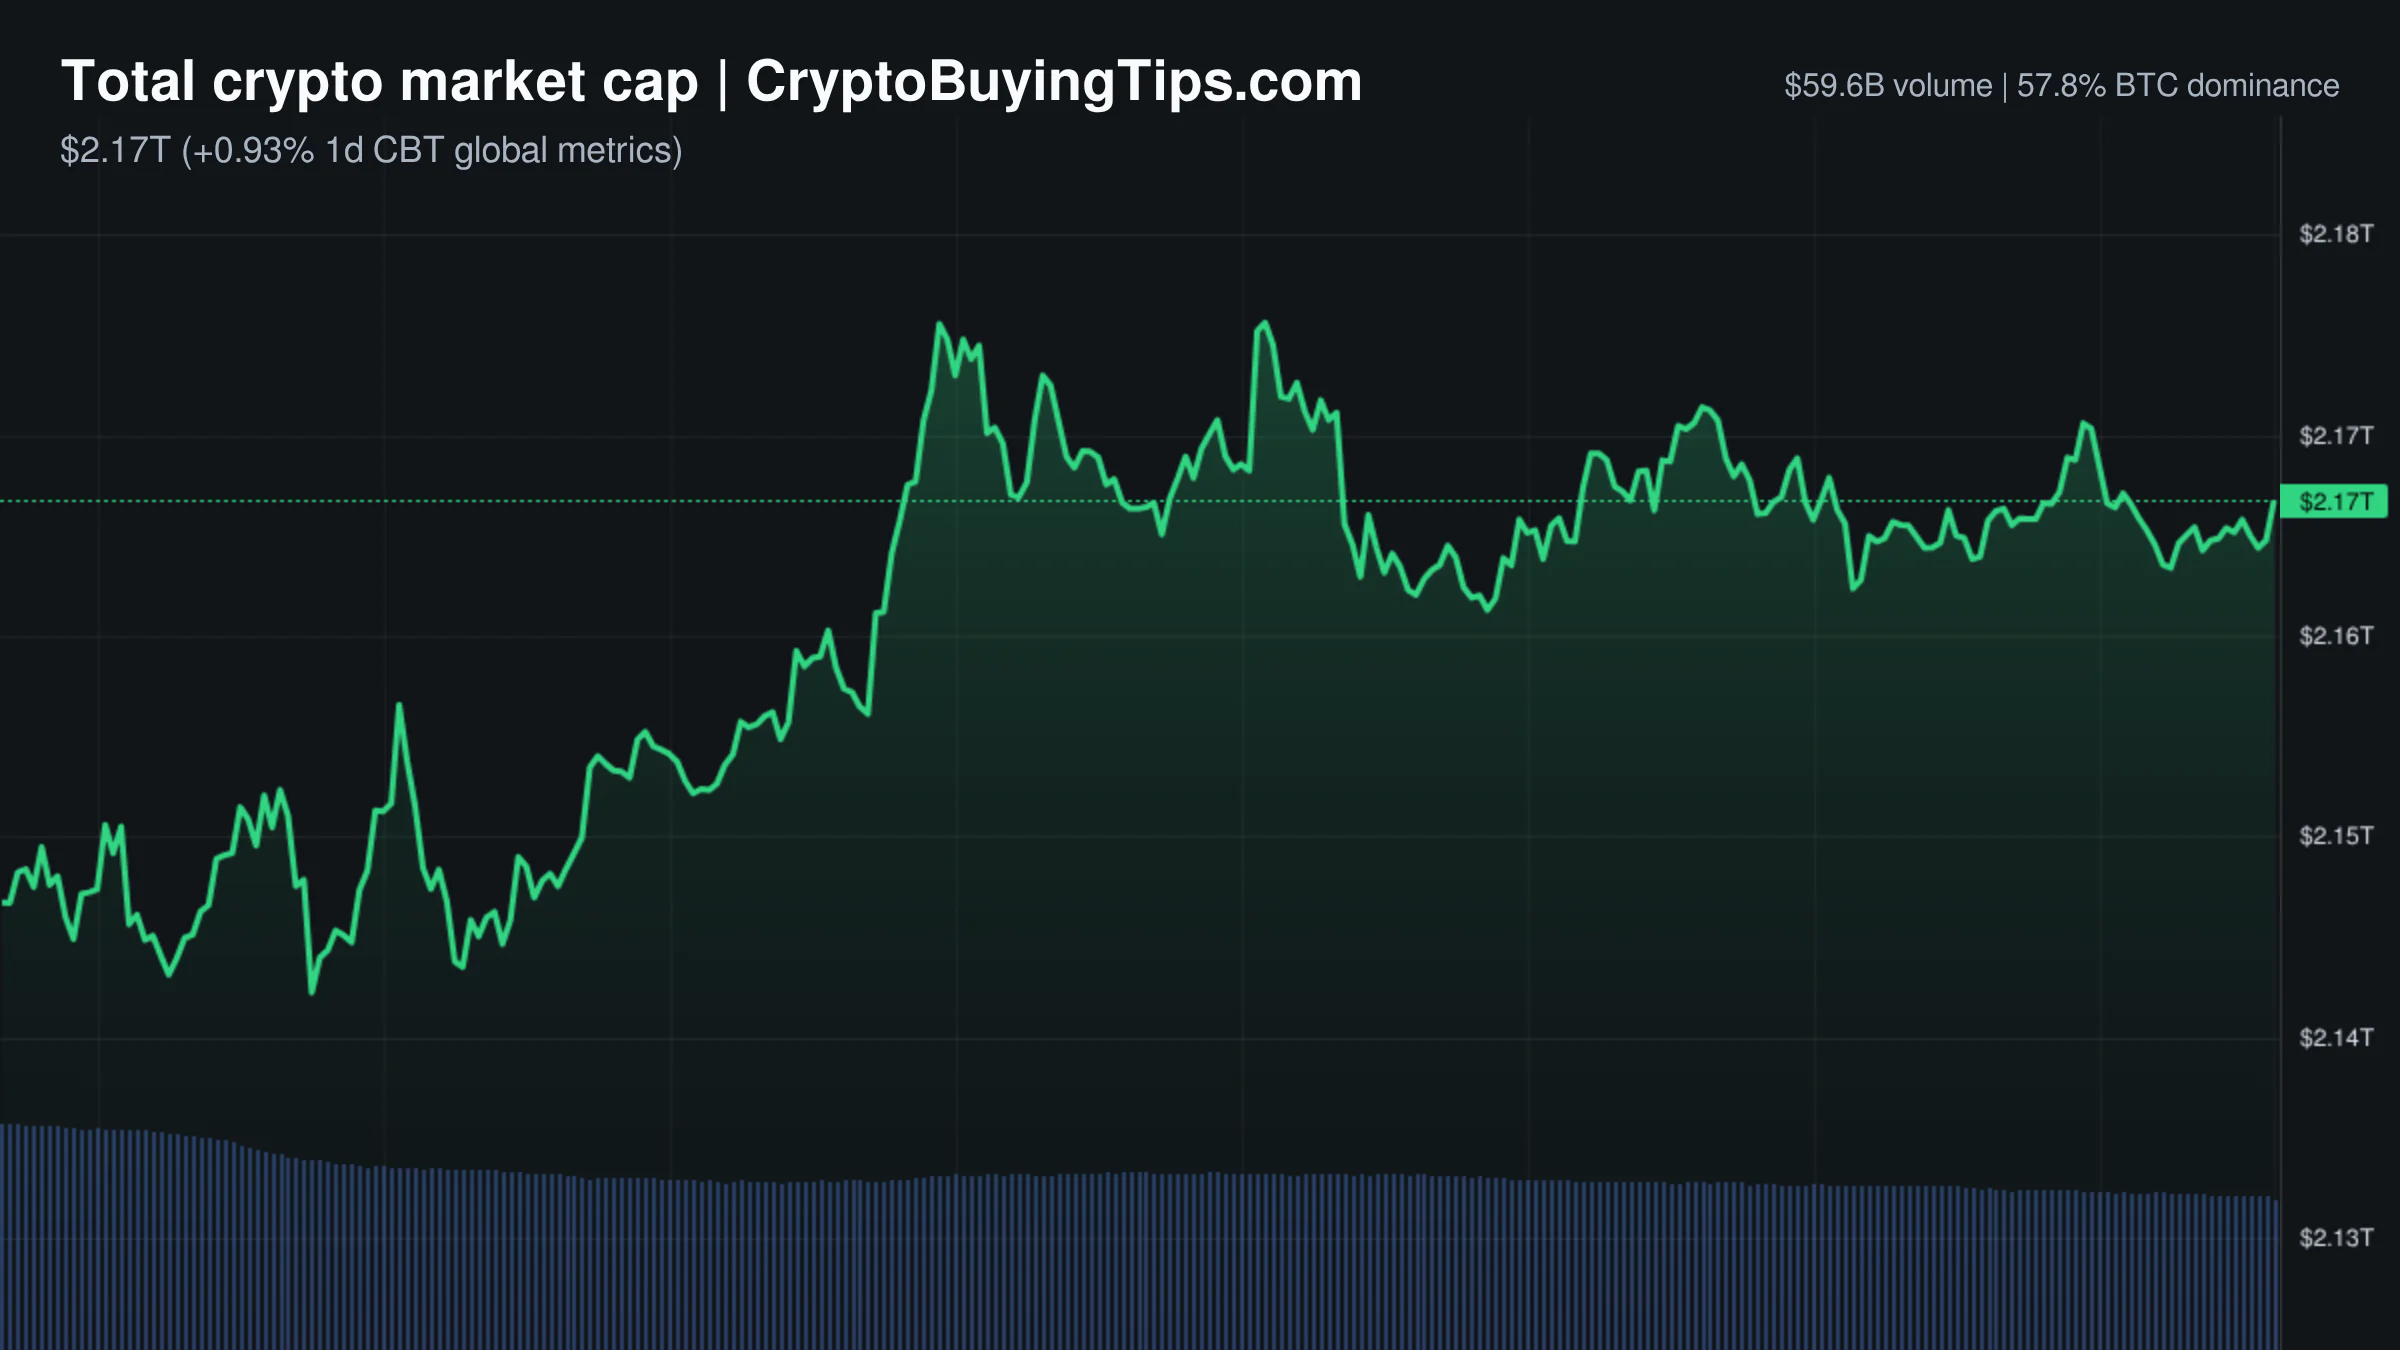
The crypto market is currently presenting a strange paradox. Prices are ticking higher, but the actual activity suggests a ghost town. Total market capitalization sits at $2.25T, up slightly by 0.89%, yet trading volume has collapsed. Spot volume is down 26.03%, and derivatives volume has fallen by 26.66%. This is a low-conviction environment. We see a relief rally occurring while the Fear and Greed Index remains stuck at 25, firmly in the Fear zone.
This divergence is telling. Usually, a price bounce accompanied by a volume drop suggests a lack of aggressive buying. It is more of a technical correction than a fundamental reversal. Bitcoin dominance is high at 55.63%, which means the limited capital returning to the market is flowing into the safest bet rather than venturing into altcoins. Stablecoin dominance at 11.42% shows that a significant amount of capital is still sitting on the sidelines, waiting for a reason to enter.
The macro backdrop adds to the tension. The NASDAQ is down 1.73%, suggesting a risk-off mood in tech that usually bleeds into crypto. The fact that crypto is slightly green while the NASDAQ slides is an interesting anomaly, but the volume collapse suggests this decoupling is fragile.
Bitcoin and Ethereum
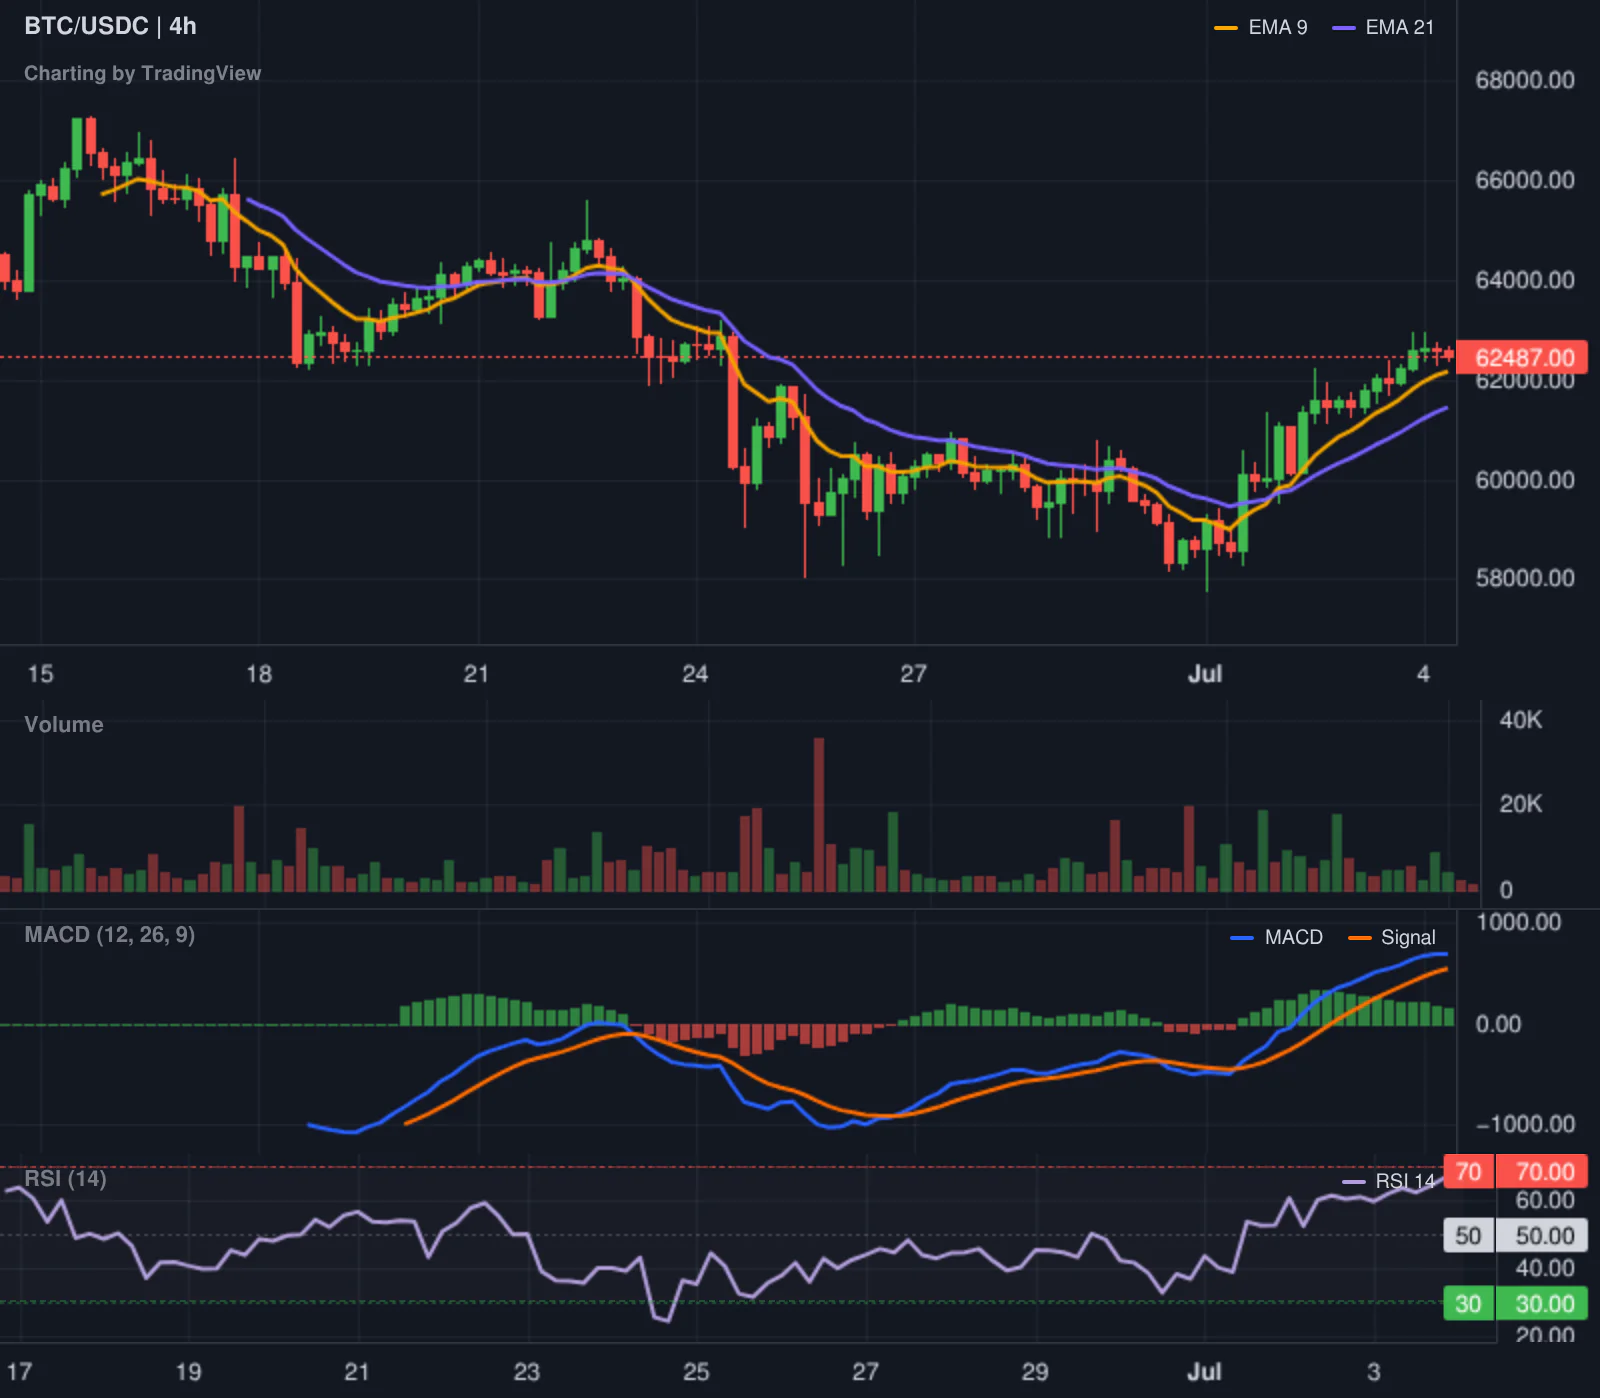
Bitcoin is trading at $62,481.48. The primary catalyst for the current stability is a return of institutional interest. Spot BTC ETFs saw a $221 million inflow on July 2, snapping a ten-day losing streak that had drained $2.7 billion. This institutional bid is providing a floor, but it is not yet enough to spark a full trend reversal.
Ethereum is at $1,758.49, up 0.85%. The outlook for ETH is less convincing. Dominance has slipped to 9.42%, and on-chain activity is nearly non-existent. ETH gas fees are at a negligible 0.07 Gwei. This level of network stagnation is worrying for a protocol that claims to be the foundation of decentralized finance. We previously covered how Ethereum market share vanishes as it attempts a corporate rebranding, and today's data suggests that the institutional PR is not yet translating into network usage.
Top crypto prices
The top assets are showing a general, if sluggish, recovery. Bitcoin leads at $62,481.48. Ethereum follows at $1,758.49. BNB is trading at $571.27, up 1.05%. XRP has seen a more notable jump of 2.76% to reach $1.13.
Solana remains flat at $81.53. TRON is up 1.64% at $0.3250. Hyperliquid is performing well, trading at $70.68, a 2.46% increase.
News driving today's market
The political theater in the US is providing a weird mix of bullish and bearish signals. President Trump recently disclosed a $1.4 billion crypto windfall from 2025. His insistence that there is nothing wrong with profiting from crypto ventures while in office is a signal to the market that the administration is deeply embedded in the industry. For some, this is a bullish sign of regulatory capture. For others, it is a red flag for ethics.
However, this has triggered a counter-reaction. Senator Kirsten Gillibrand is now calling for a ban on elected officials issuing memecoins. This is a direct hit to the speculative side of the market. If the US government begins banning specific asset classes like memecoins for officials, it could lead to broader restrictions on how these tokens are marketed to the public.
In Europe, the regulatory noose is tightening. The transition period for MiCA has ended. Crypto firms without authorization can no longer legally serve EU clients. The costs of compliance are high, with some estimates ranging from 350,000 to 600,000 euros. This creates a period of high uncertainty as firms either wind down or face fines starting at 5 million euros. Simultaneously, ESMA has warned that prediction market event contracts may be banned for retail investors, as they often fall under binary options restrictions.
These regulatory headwinds contrast with the ETF data. The $221 million inflow into Bitcoin ETFs suggests that while the regulators are fighting the "casino" side of crypto, the institutional "vault" side is still open for business. We previously noted that the volume data suggests fight between bullish narratives and actual trading activity, and today's 26% drop in volume confirms that the fight is currently a stalemate.
Social intelligence
On-chain data and social feeds are highlighting systemic risks. The US money supply has hit a record $23T. This is a massive amount of liquidity that eventually seeks a home in risk assets, but it also signals the ongoing erosion of fiat confidence. This is mirrored by the fact that central banks are stacking gold at record levels. When the world's bankers buy gold, it usually means they expect a storm.
In the whale world, the focus is on individual windfalls. Analyst @lookonchain noted that trader Ansem's portfolio grew by $193M in a single week due to $ANSEM. This is the typical "lottery" narrative that keeps retail interested even when the broader market is stagnant.
From a protocol perspective, the OUSD stablecoin is expanding, with the Polygon Foundation CEO announcing its arrival on Polygon. However, this is clouded by reports that Samsung and Dunamu were listed as consortium members without being consulted. This suggests a lack of professionalism in the governance of some of these new stablecoin initiatives.
Trading ideas worth watching
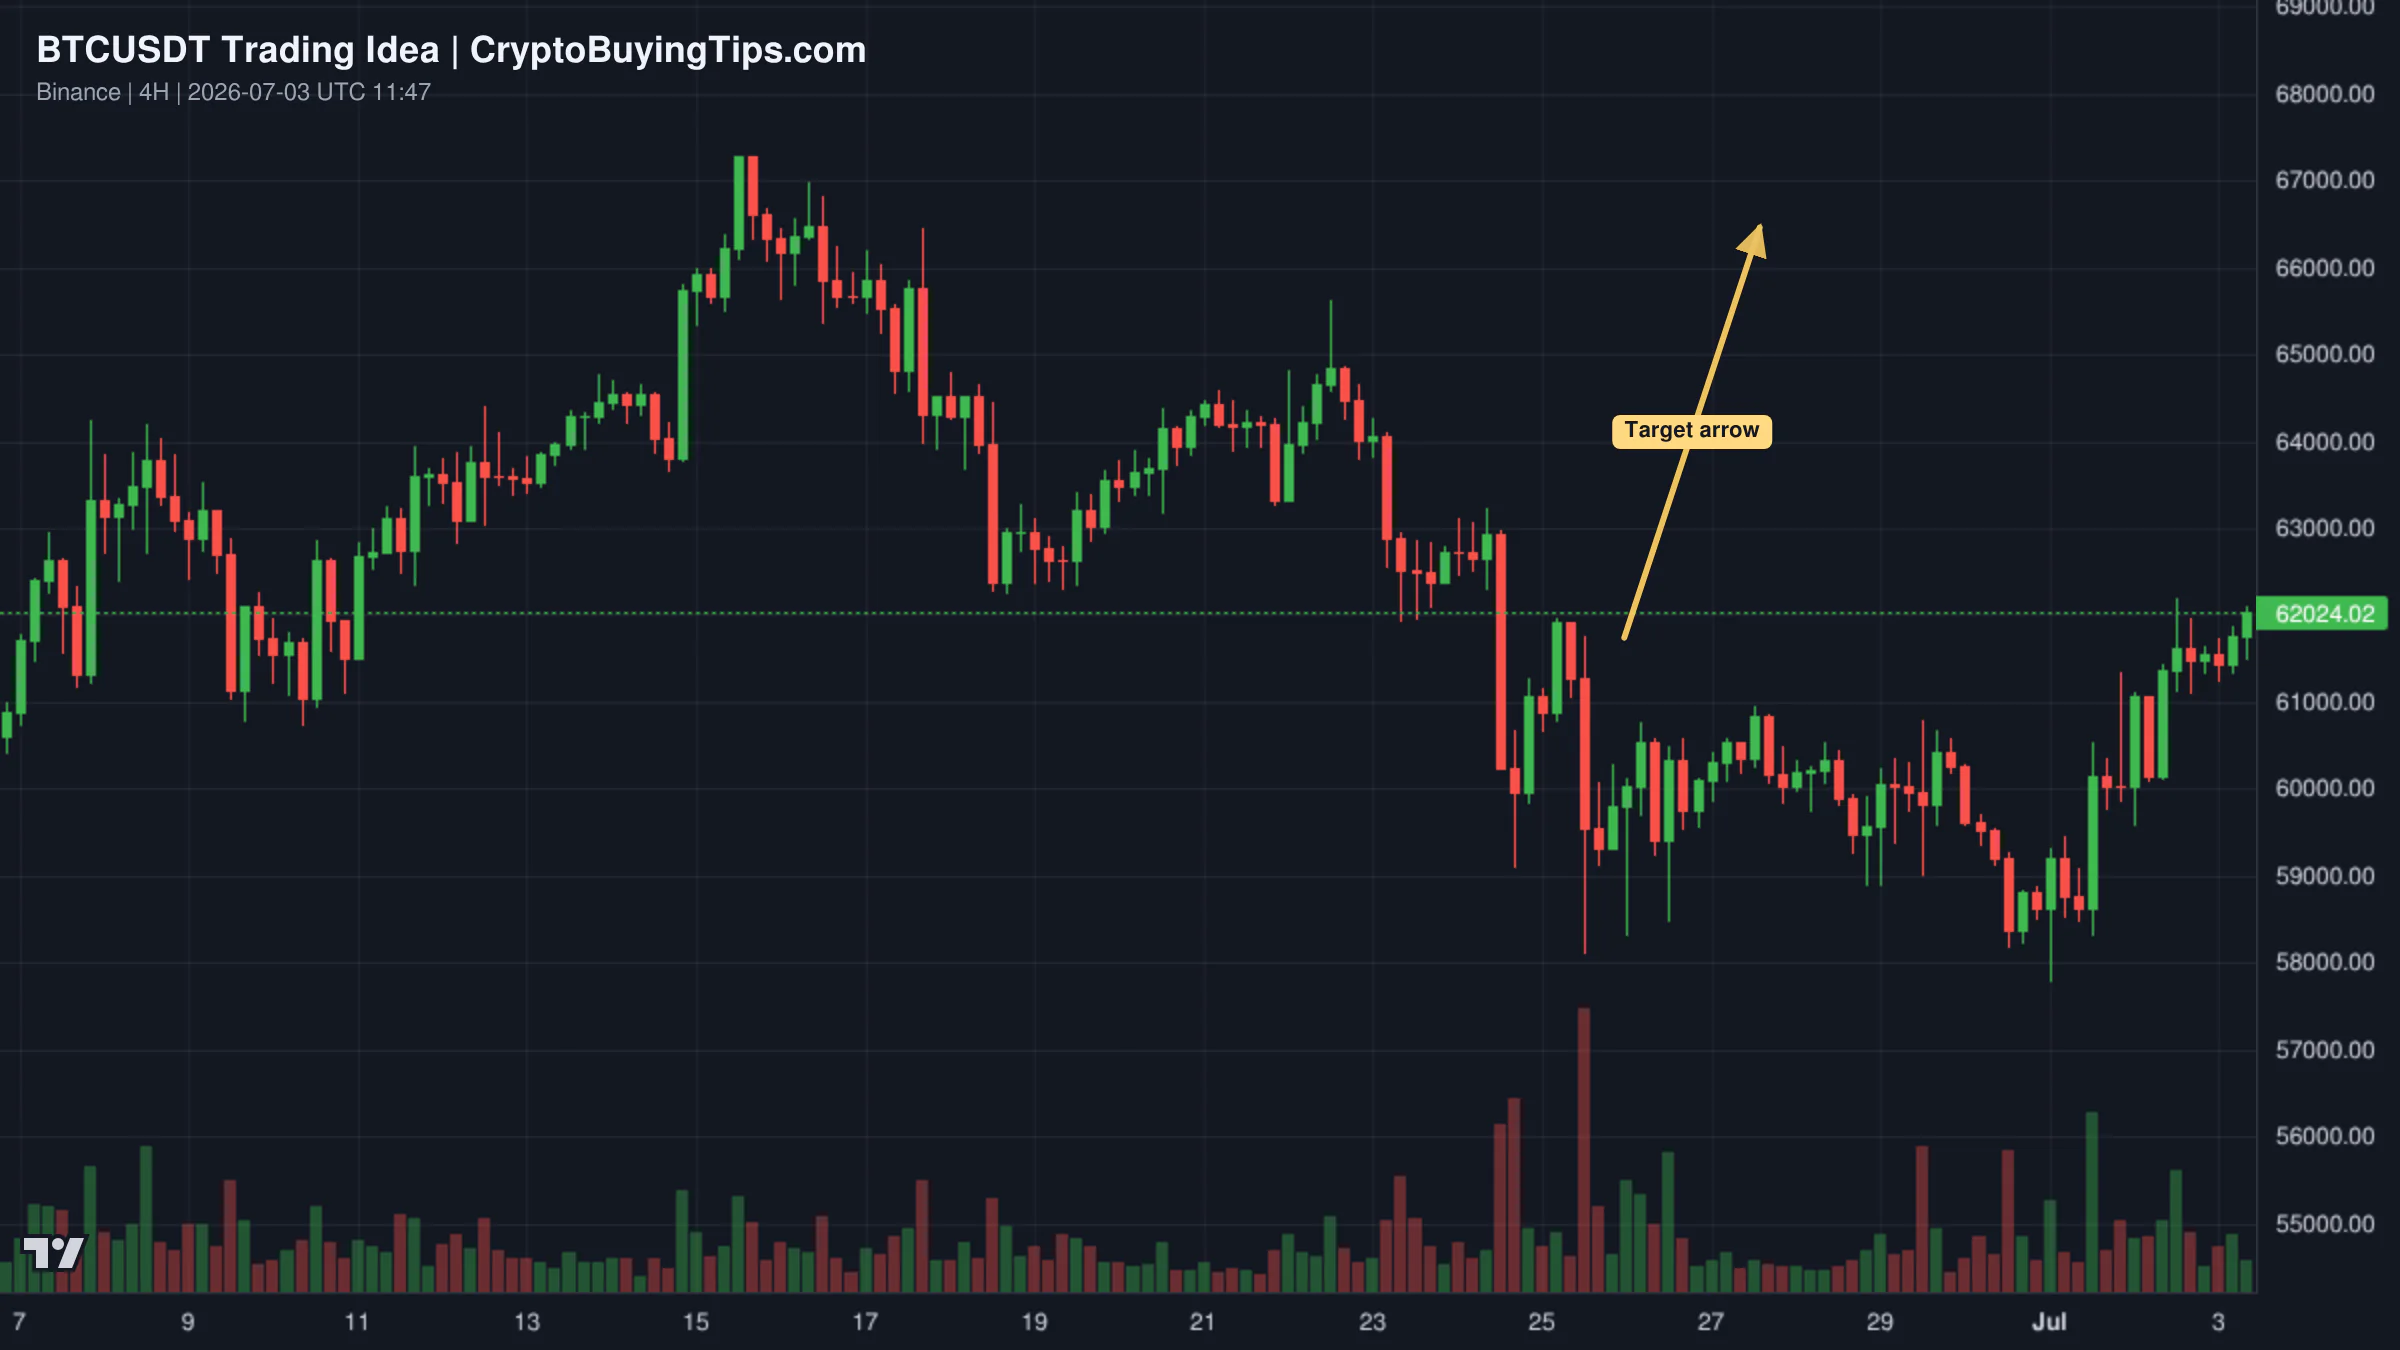
There is a sharp divide in Bitcoin analysis today. One bullish setup focuses on the support zone between $60,700 and $61,000. The read is that as long as this area holds, the path is open to $63,000 and $65,000. This is a short-term momentum play based on the recent rebound from the multi-year lows.
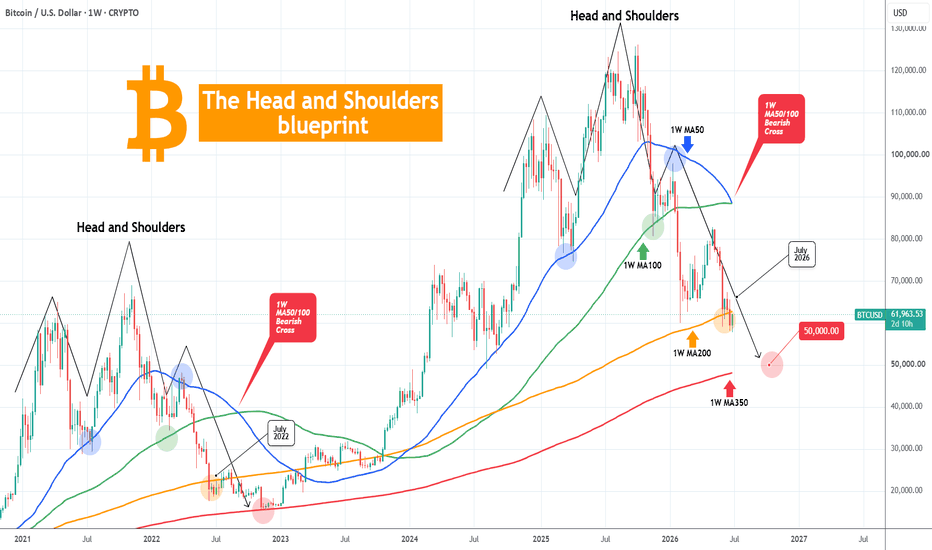
Conversely, a long-term bearish view suggests a Head and Shoulders pattern that mirrors the 2021-2022 crash. This analysis points to a target of $50,000, arguing that the current break below the weekly MA200 is a signal of a larger cycle bottom. The conflict between these two views is the essence of the current market. We have a short-term ETF-driven bid fighting a long-term structural decline.
For those looking at altcoins, Cardano is showing signs of a long-term recovery. After a brutal bearish cycle since 2021, ADA is now trading within a long-term support zone. The analysis suggests that a bottom was formed in June 2026, and the asset is now flipping old resistance into support. This is a slow-burn recovery play rather than a quick trade.
Smart Money Signals — Hyperliquid Leaderboard
Our tracker for the Hyperliquid leaderboard shows a high-conviction move from a top trader. A wallet with a 13,829% 30-day ROI opened a long position in Bitcoin at $60,428. The notional value of the trade was $380,093. This entry point is well below the current price, suggesting the "smart money" was comfortable buying the dip before the relief rally began.
Altcoin Spotlight
Hyperliquid deserves a mention today. It has climbed into the top 10 by rank and is up 2.46% to $70.68. While most of the market is drifting, HYPE is maintaining strength. This reflects a broader trend where users are moving away from stagnant legacy chains and toward high-performance derivatives platforms that actually have a working product.
What to watch next
The market is in a fragile state. The relief rally is happening on low volume, which is the opposite of what you want to see for a sustainable bull move. We need to see if the ETF inflows can continue for another week or if they were just a momentary blip.
The MiCA enforcement phase will be the next big catalyst for the European market. We expect to see a wave of exits or fines as non-compliant firms are forced out. This could lead to a temporary drop in liquidity for EU-based traders.
Finally, keep an eye on the $61,000 level for Bitcoin. If that support fails, the "relief rally" will be remembered as a bull trap, and the path to $50,000 becomes much more likely. For now, the market is simply holding its breath.
Some links in this article may be affiliate links. We may earn a commission at no extra cost to you — this never influences our analysis or coverage.
Sigrid Voss
Crypto analyst and writer covering market trends, trading strategies, and blockchain technology.
More Articles
Crypto Market Overview | speculative retreat amid sanctions and low on-chain activity | July 25, 2026
The crypto market retreats amid sanctions news and low on-chain activity; see our overview of current metrics.
Crypto Market Overview | leverage bets meet macro pressure amid institutional shifts | July 24, 2026
The crypto market overview shows leverage bets meeting macro pressure as institutional shifts drive volume amid fear…

Bitcoin dominance is at 59%. Here is why your altcoins are bleeding
Bitcoin dominance sitting near 60% suggests capital has found its safe haven for now. When BTC dominates this much, it…
Crypto Market Overview | Derivatives volume climbs while spot appetite fades | July 23, 2026
Derivatives volume climbs while spot appetite fades in today's crypto market overview; see why leverage drives price…