
Crypto Market Overview | Extreme fear and collapsing volumes signal market paralysis | June 13, 2026
Crypto Market Overview | Extreme fear and collapsing volumes signal market paralysis | June 13, 2026
Market overview
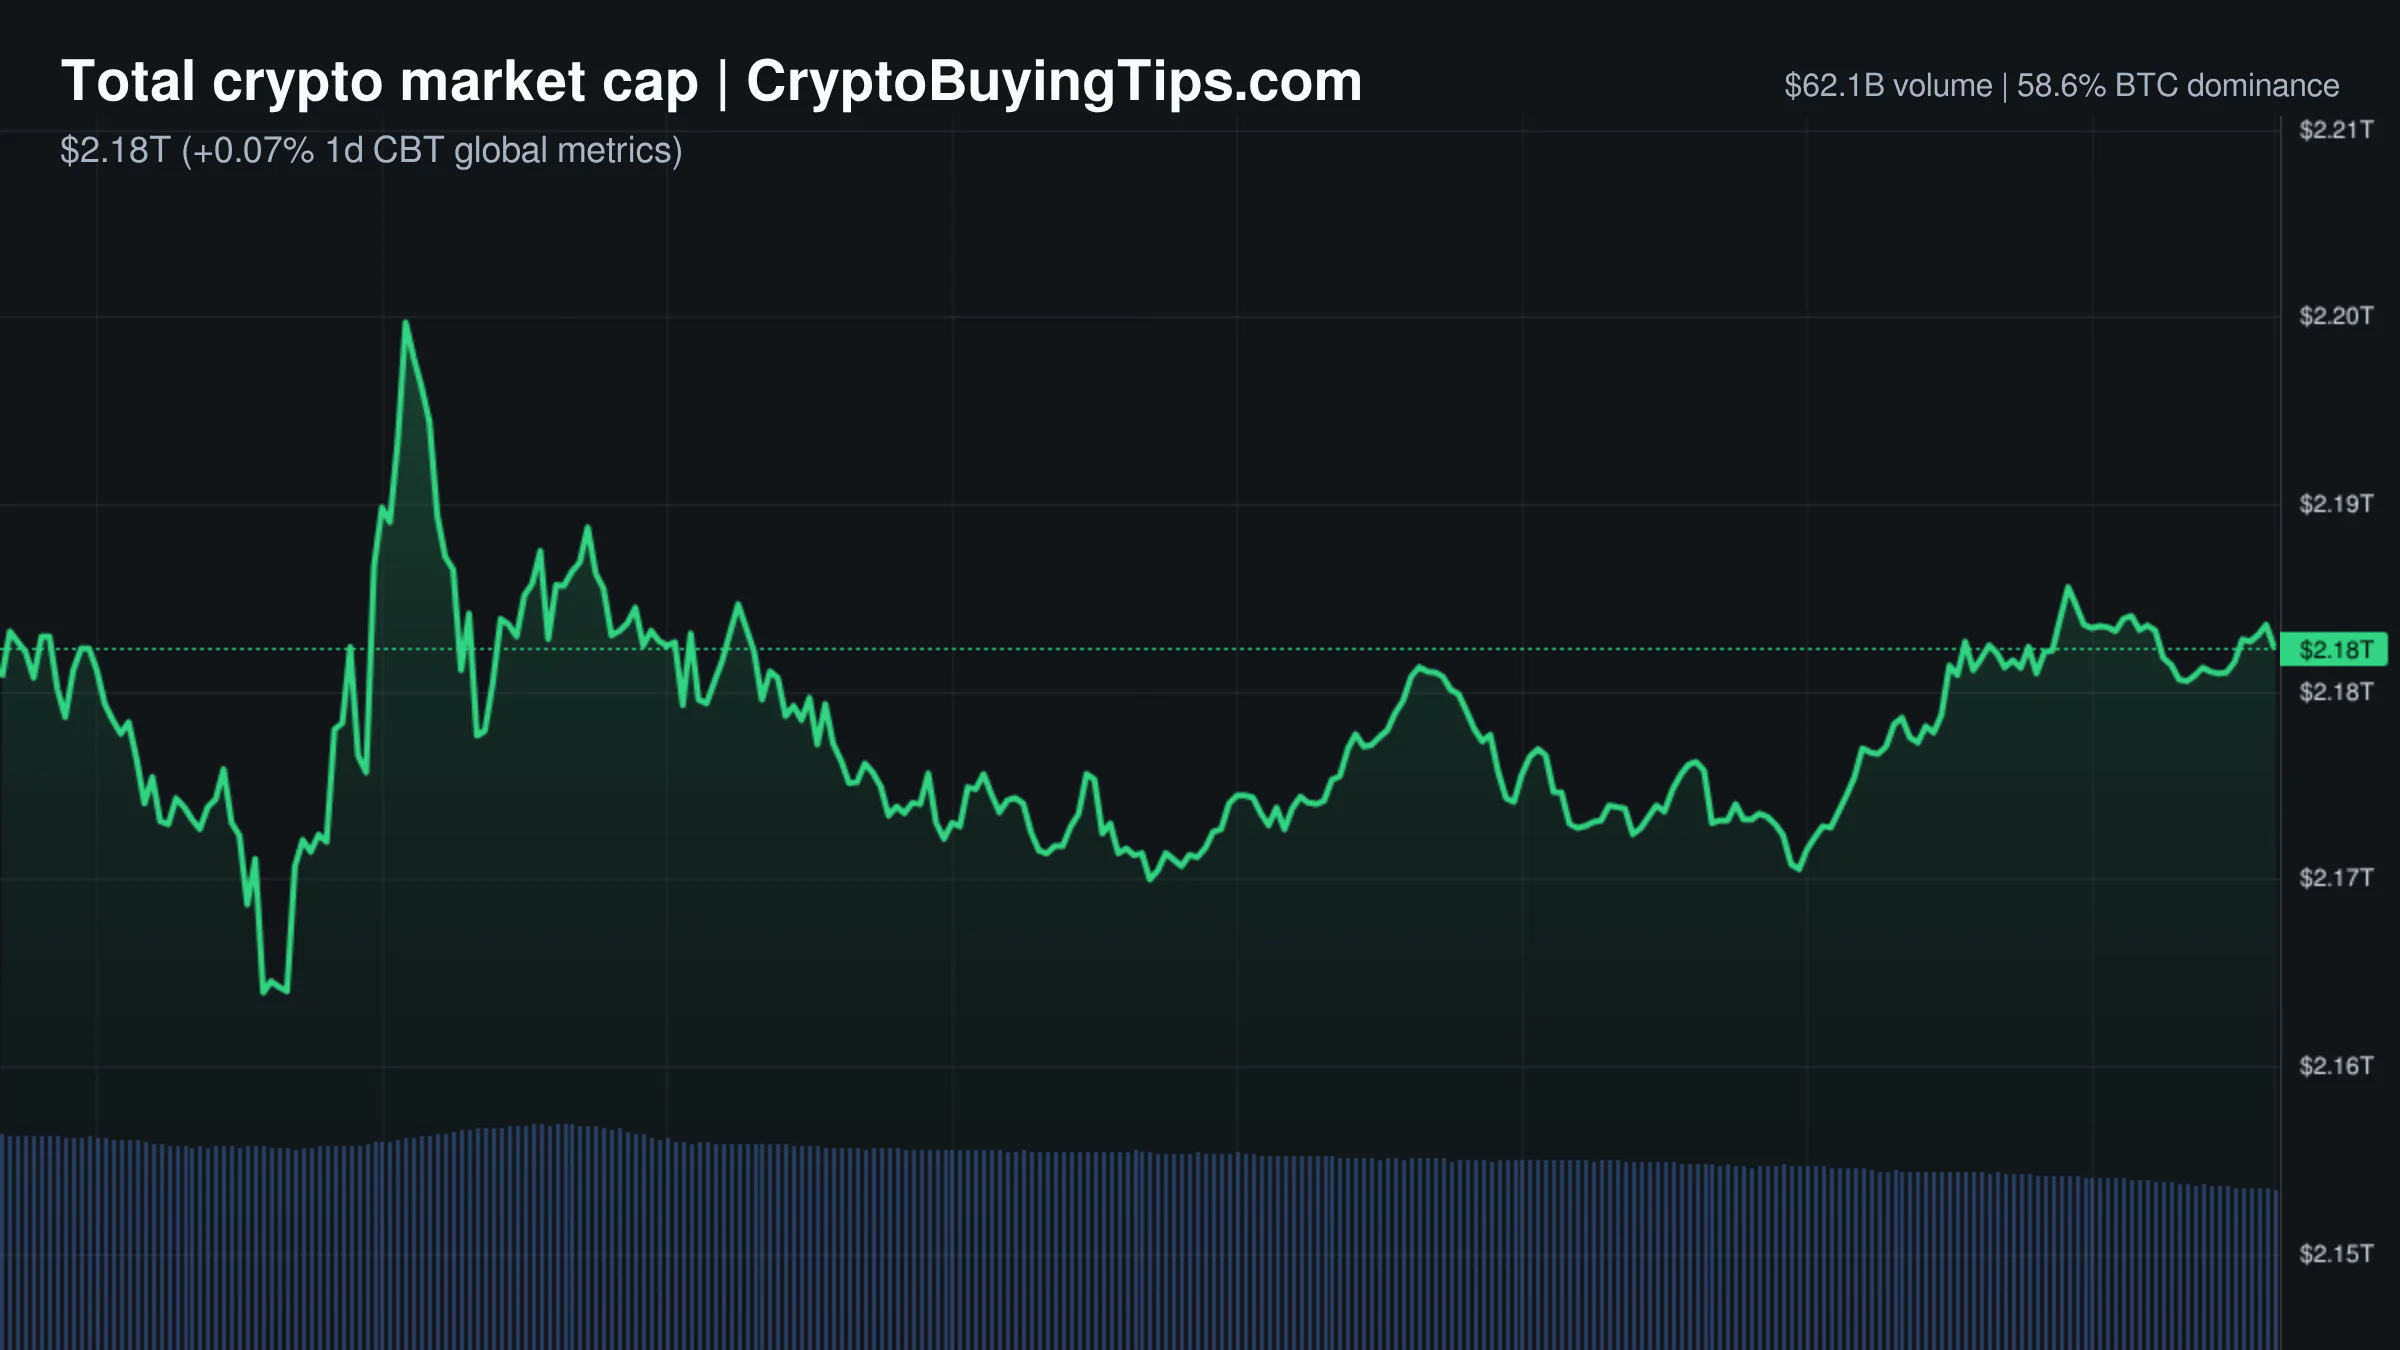
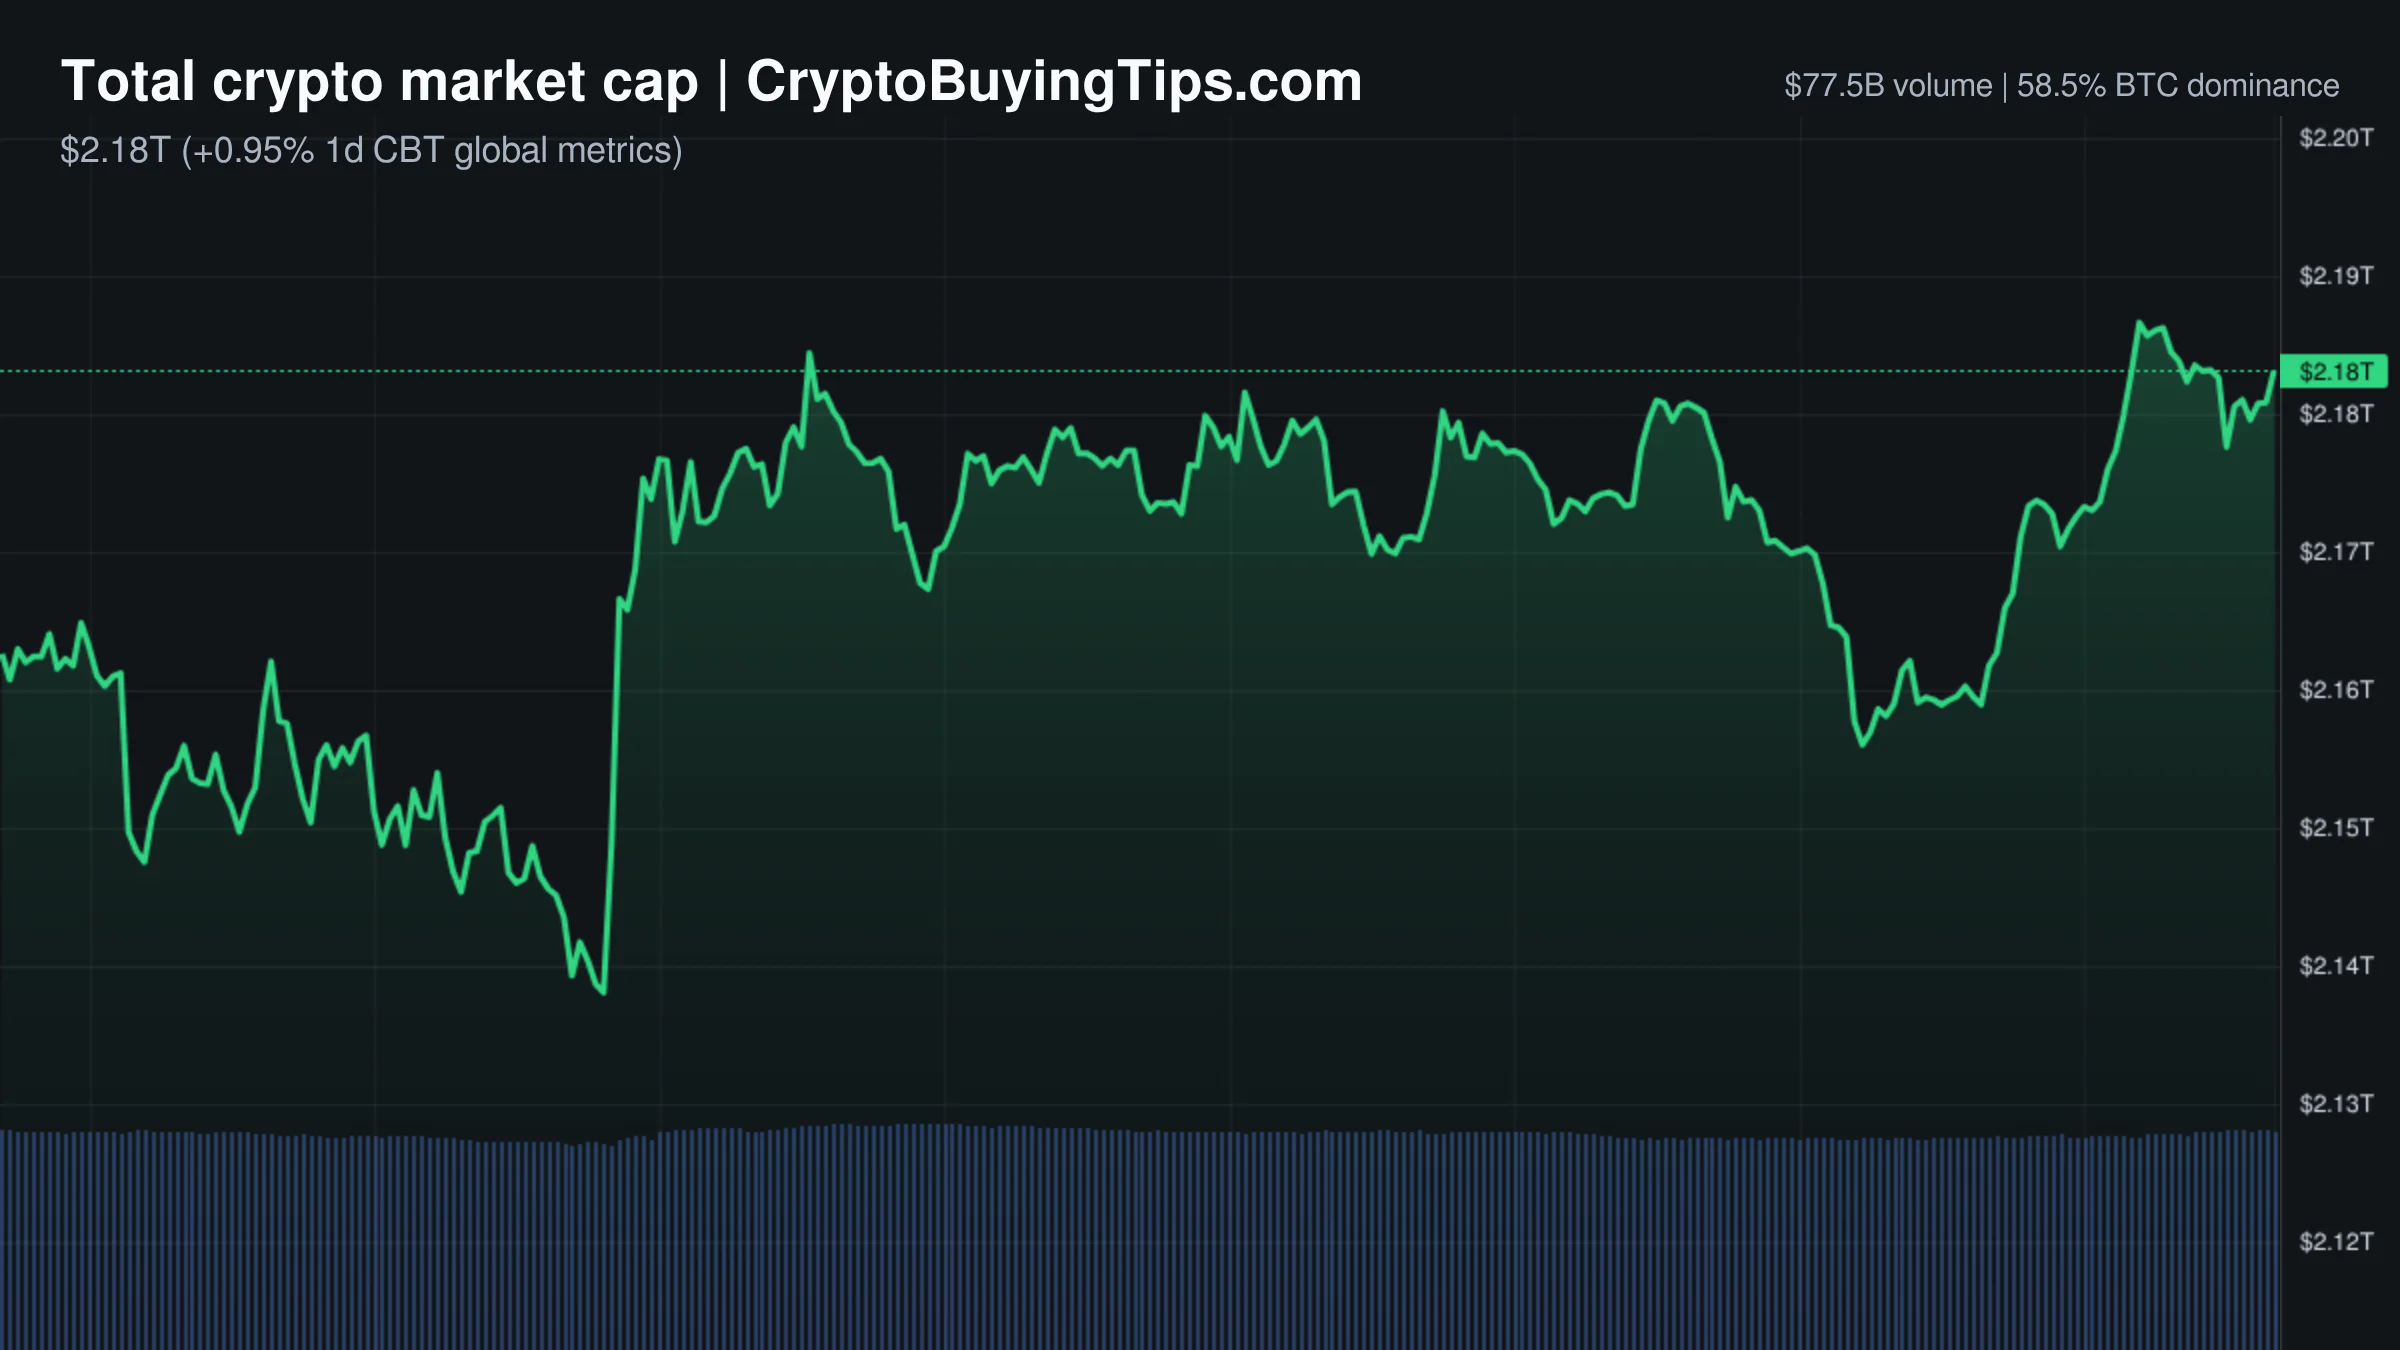
The crypto market is currently exhibiting a strange sort of paralysis. On paper, the total market cap is essentially flat, sitting around $2.27T with a negligible 24-hour change of 0.19%. However, the sentiment data tells a completely different story. The Fear and Greed Index has plummeted to 19, placing the market in a state of extreme fear. This is the kind of divergence that usually suggests traders are terrified of a move that hasn't actually happened yet.
The most telling metric today is the collapse in activity. Trading volume across the board is evaporating. Spot volume is down nearly 20%, and derivatives volume has dropped by over 21%. When both the bulls and the bears decide to stop trading at the same time, the result is the current price stagnation. We are seeing a "wait-and-see" approach where liquidity is drying up, leaving the market vulnerable to sharp, erratic moves if any significant news breaks.
Dominance remains skewed toward Bitcoin, which holds 56.44% of the market. Stablecoin dominance is at 11.52%, suggesting a decent amount of capital is sitting on the sidelines. The Altcoin Season Index is neutral, hovering around 50 to 71 depending on the timeframe, meaning money isn't rotating into alts with any conviction. It is a quiet, tense standoff.
Bitcoin and Ethereum
Bitcoin is trading at $63,778.1, barely moving in the last 24 hours. The price action is remarkably dull given the extreme fear in the sentiment indices. There is a clear conflict between the technicals and the mood. Some analysts, including those at Standard Chartered, argue that the recent dip to $59,000 marked a cycle bottom and that the "crypto winter" is over. However, the lack of volume suggests that the market isn't yet convinced.
Ethereum is slightly weaker, priced at $1,672.5. The most concerning data point for Ethereum isn't the price, but the network state. Gas fees are exceptionally low, ranging from 0.12 to 0.17 Gwei. This indicates a ghost town of on-chain activity. When gas is this cheap, it usually means the DeFi ecosystem is dormant or traders have migrated entirely to other chains.
Top crypto prices
Bitcoin remains the heavyweight at $63,778.1 (+0.23%). Ethereum follows at $1,672.5 (-0.08%), while BNB is holding at $604.74 (-0.05%). XRP is slightly up at $1.14 (+0.17%).
On the more active side, Solana has gained 1.04% to reach $67.48, and TRON is up 1.27% at $0.3163. Hyperliquid is struggling, dropping 1.48% to $58.27.
News driving today's market
The overarching theme of the last 48 hours is the friction between institutional ambition and operational reality. The RWA narrative took a hit after Bybit, Binance, and Bitget were forced to cancel tokenized SpaceX IPO allocations due to a share shortage. This failure highlights a gap between the marketing of tokenized assets and the actual plumbing required to deliver them.
On a more positive note, Metaplanet is moving beyond simple accumulation. The firm is acquiring Siiibo Securities for $13 million to launch Bitcoin-linked yield products in Japan. This is a strategic move to tap into Japan's massive national savings pool, moving Bitcoin from a passive treasury asset to an active financial product. We previously covered tokenized stocks for more background.
The macro environment is clouded by regulatory and existential threats. The US government's directive to Anthropic to suspend access to certain AI models for foreign nationals signals a tightening of export controls that could spill over into AI-related tokens. Meanwhile, reports of the US government investing $2 billion into quantum computing serve as a reminder that the current cryptographic foundations of blockchain are not permanent.
In the legal sphere, the failure of Sam Bankman-Fried to overturn his 25-year sentence removes a lingering shred of hope for the FTX era. It is a grim but necessary closing of a chapter that continues to haunt institutional trust in centralized exchanges.
Social intelligence
On-chain data shows that the "smart money" is currently nursing wounds. @lookonchain reported a whale closing a $35M long position in $SPCX with a $331K loss, having failed to take profits when the trade was up $2M. This is a classic example of the current market's cruelty; the opportunity was there, but the exit was missed.
Even more dramatic is the collapse of a whale in $ASTEROID. The trader is currently down $1.53M, an 84% loss, after spending $1.81M to enter the position. The asset is in a primary downtrend, and while it is attempting to establish a base near 0.0000499 WETH, the lack of buying pressure suggests the bottom is not yet in.
Trading ideas worth watching
There is a sharp divide in Bitcoin sentiment among technical analysts. One view suggests a "fakeout" to the upside is likely, forming a triangle pattern that will eventually break downward toward the $57,000 to $58,000 range where liquidity is concentrated. This would be a classic trap for late bulls before a deeper flush.
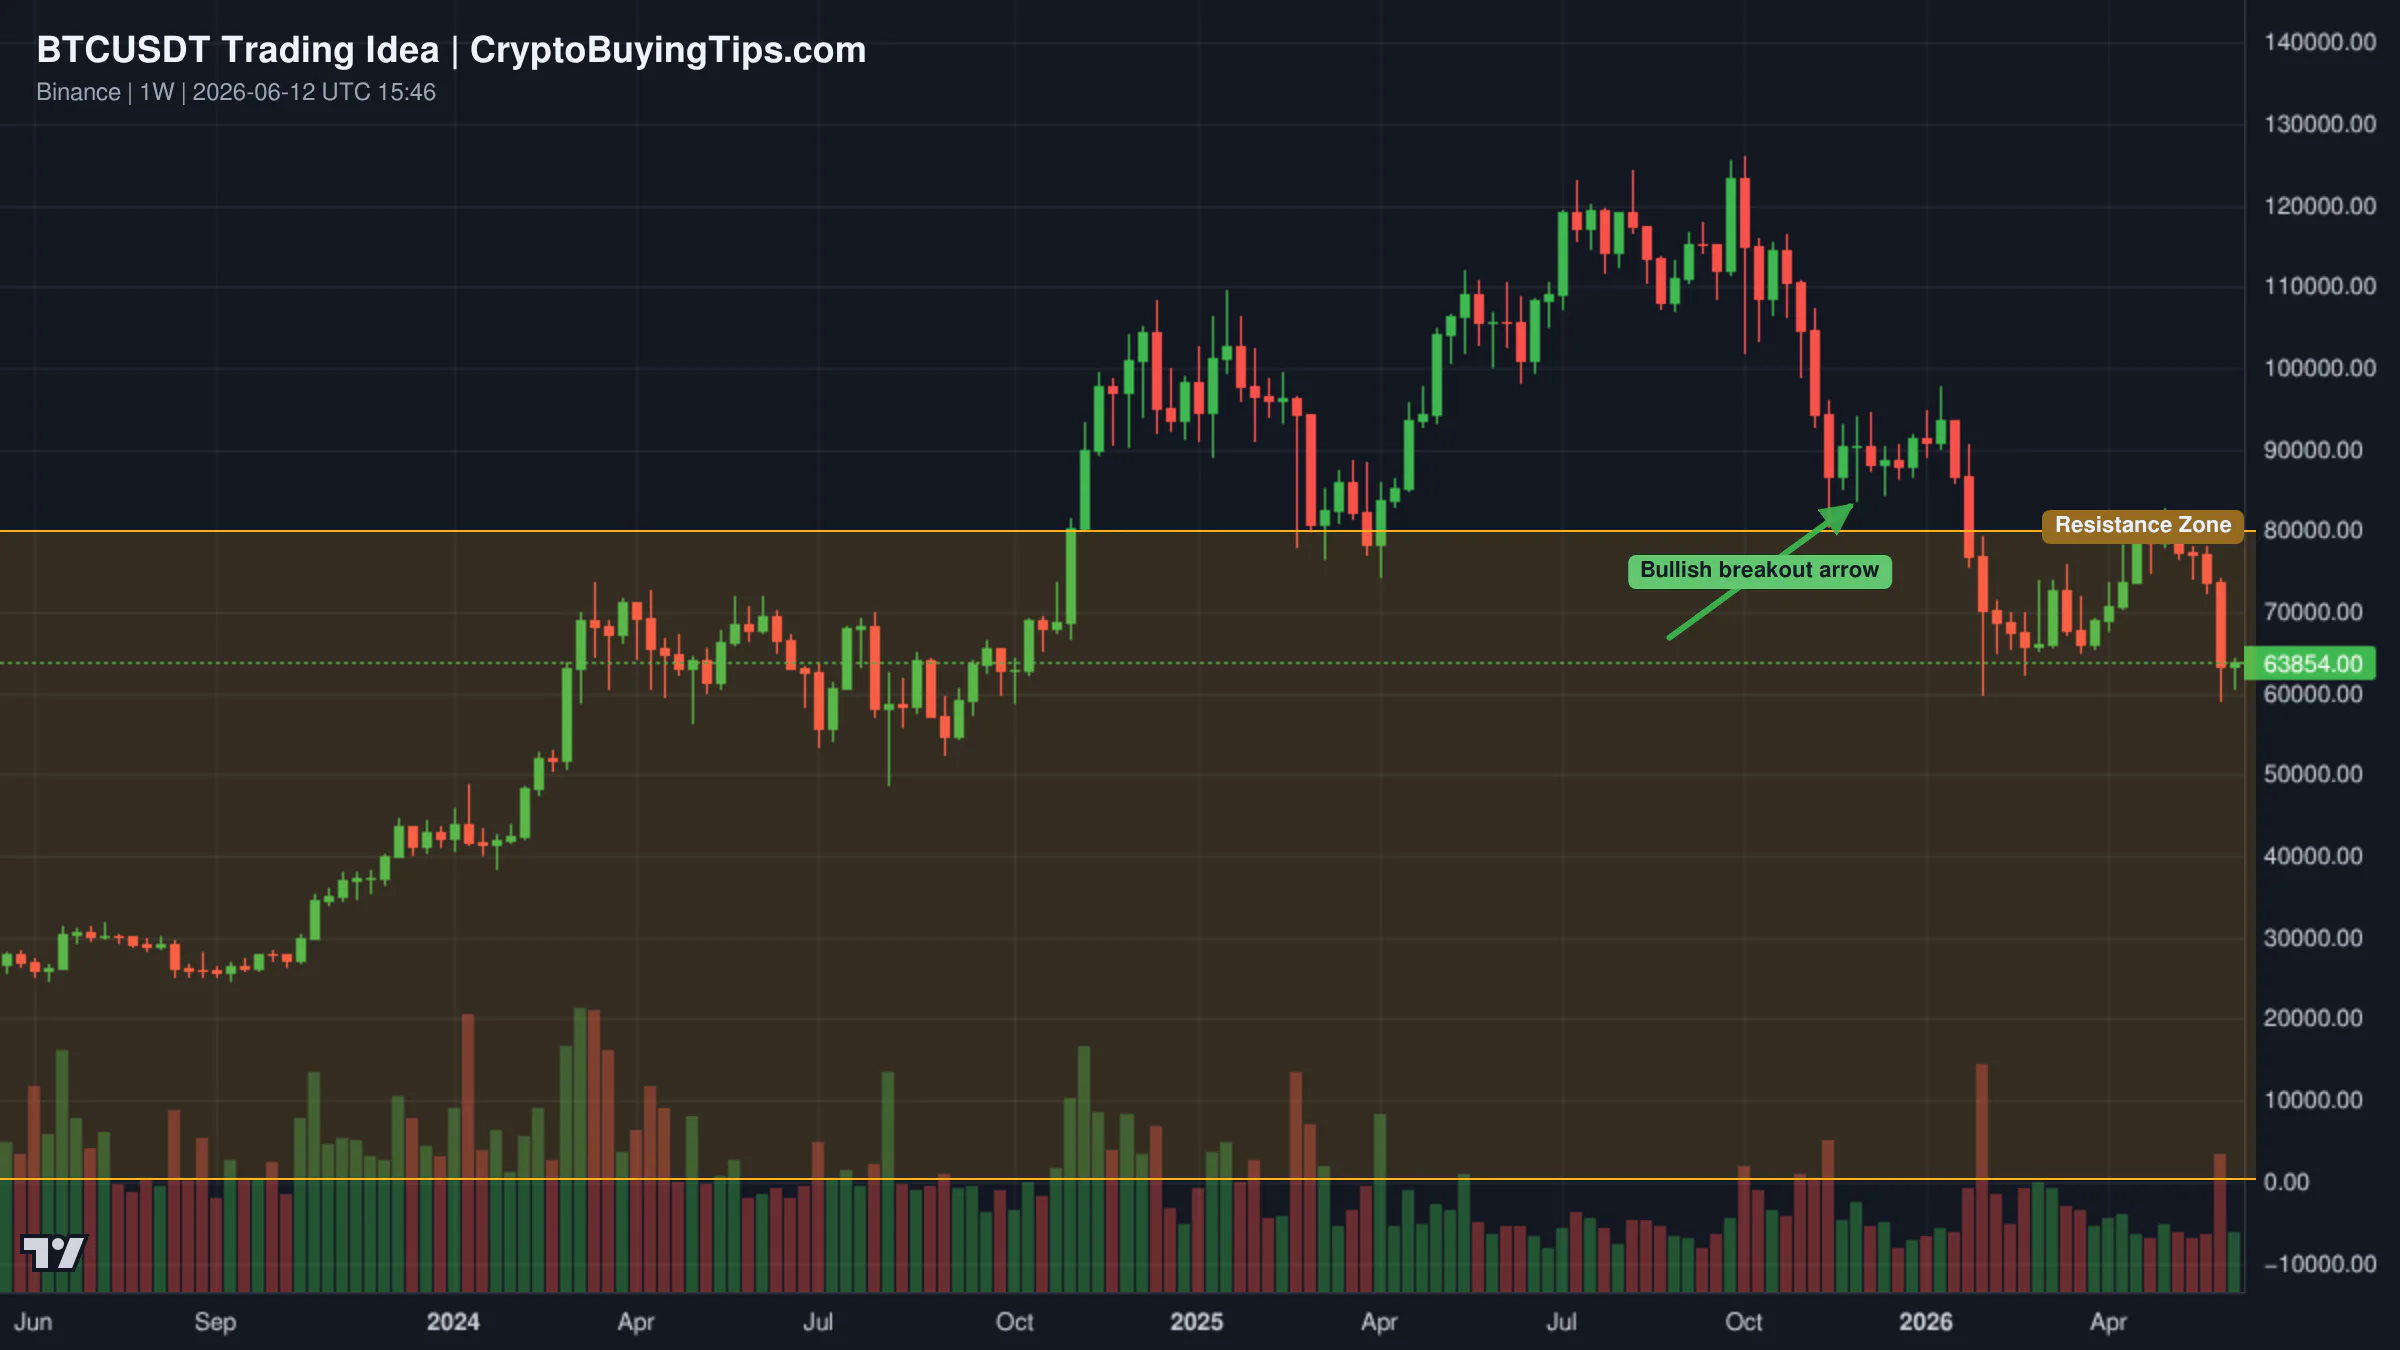
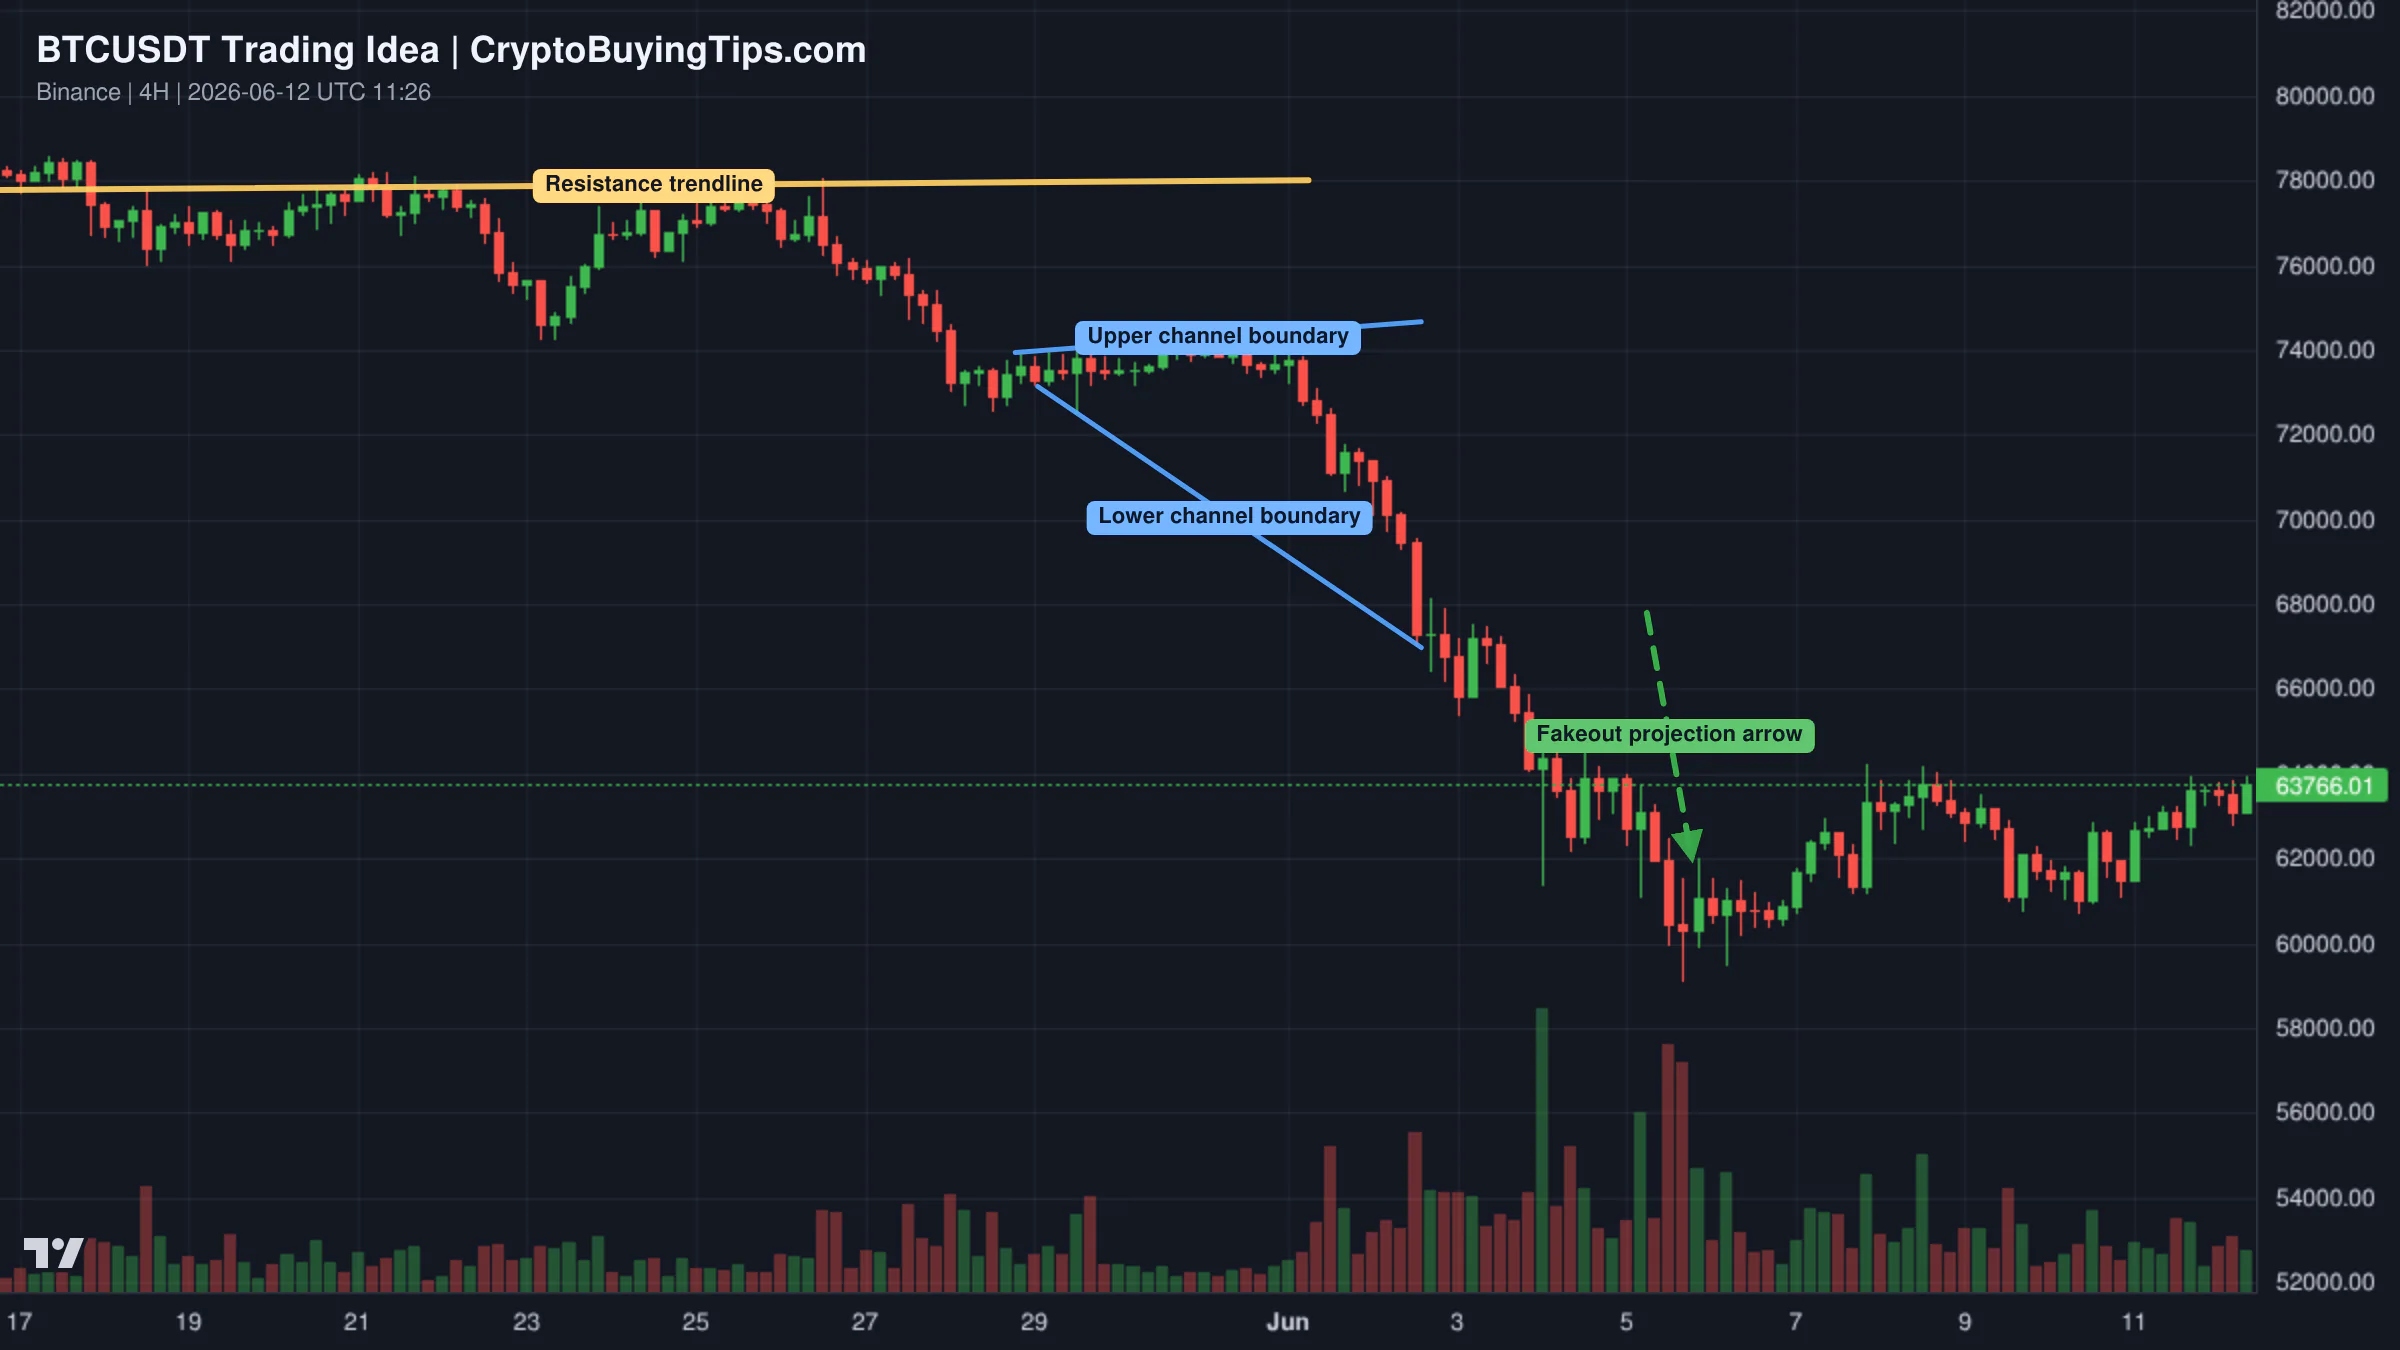
Conversely, some argue that the correction is simply over. After four weeks of red candles, the narrative is that any price below $70,000 is a buy zone. This perspective views the current "extreme fear" as the ideal time to accumulate before FOMO returns. Given the current volume collapse, both views are essentially guessing until a volatility catalyst arrives.
For XRP, the outlook is more long-term. Analysis of time cycles suggests the bear market that began in January 2025 has reached its technical bottom in June 2026. The emergence of a long-term double-bottom with declining bearish volume is often a signal that the asset is transitioning into a growth phase that could last until 2029.
Smart Money Signals — Hyperliquid Leaderboard
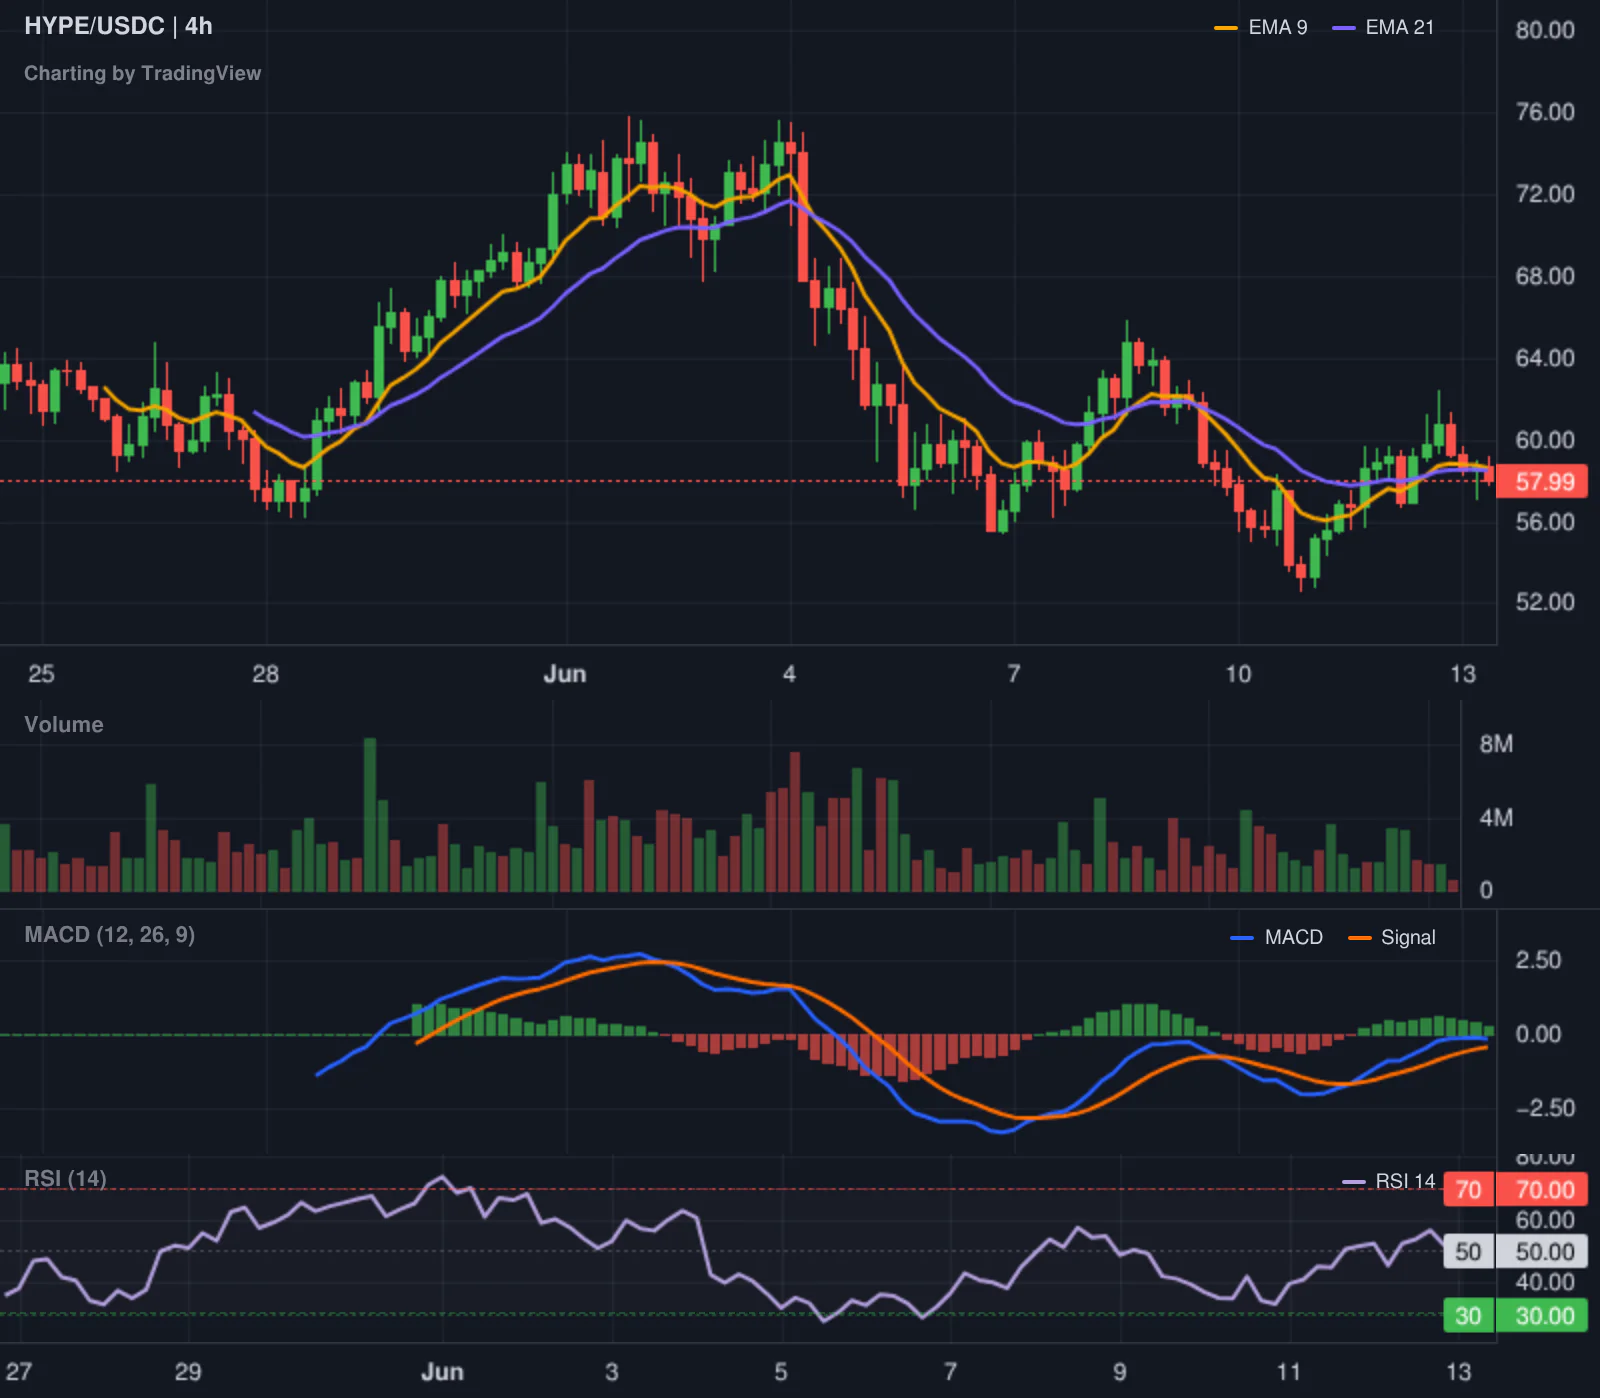
Our tracking of the Hyperliquid leaderboard shows a high-confidence short on HYPE. A trader with a 115% 30-day ROI opened a short position at $59.6 with a notional value of roughly $60,000. This move aligns with the asset's recent 1.48% slide and suggests that top-tier performers on the platform are betting on further weakness.
What to watch next
The market is currently a coiled spring, but it is unclear which way it will snap. The immediate focus should be on volume. If the current decline in spot and derivatives activity continues, we are looking at a period of prolonged boredom. But if volume spikes while the Fear and Greed Index remains at 19, we could see a violent "short squeeze" as the sentiment disconnect is priced in.
Watch the Ethereum gas fees. If activity remains this low, the narrative around ETH as the primary DeFi hub will continue to erode in favor of Solana. Finally, keep an eye on the Japanese market's reaction to Metaplanet's new securities arm. If they successfully attract retail capital through Bitcoin yield products, it could provide a new, non-US source of demand for the asset.
Some links in this article may be affiliate links. We may earn a commission at no extra cost to you — this never influences our analysis or coverage.
Sigrid Voss
Crypto analyst and writer covering market trends, trading strategies, and blockchain technology.
More Articles
Ethereum gas is at 0.14 Gwei. Here is what that actually tells you
Ethereum gas at 0.14 Gwei sounds like a bargain for users, but we caution against interpreting low fees as network…

The SpaceX IPO chaos is a warning for the RWA trade
The SpaceX IPO chaos was treated as a triumph for tokenized assets, but it proved otherwise. When allocations vanished…
Crypto Market Overview | Extreme fear meets institutional expansion Market overview The crypto market is currently defined by a stark divergence between price | June 12, 2026
Crypto Market Overview Extreme fear meets institutional expansion Market overview The crypto market is currently defined…

BlackRock is adding a yield switch to Bitcoin. Here is the catch
BlackRock’s new Bitcoin ETF offers investors a steady income stream through covered call options, but it comes with a…