
Crypto Market Overview | Extreme fear as Bitcoin and Ethereum face institutional outflows and equities and gold fall | November 20, 2026
Crypto Market Overview | Extreme fear as Bitcoin and Ethereum face institutional outflows and equities and gold fall | November 20, 2026
Market overview
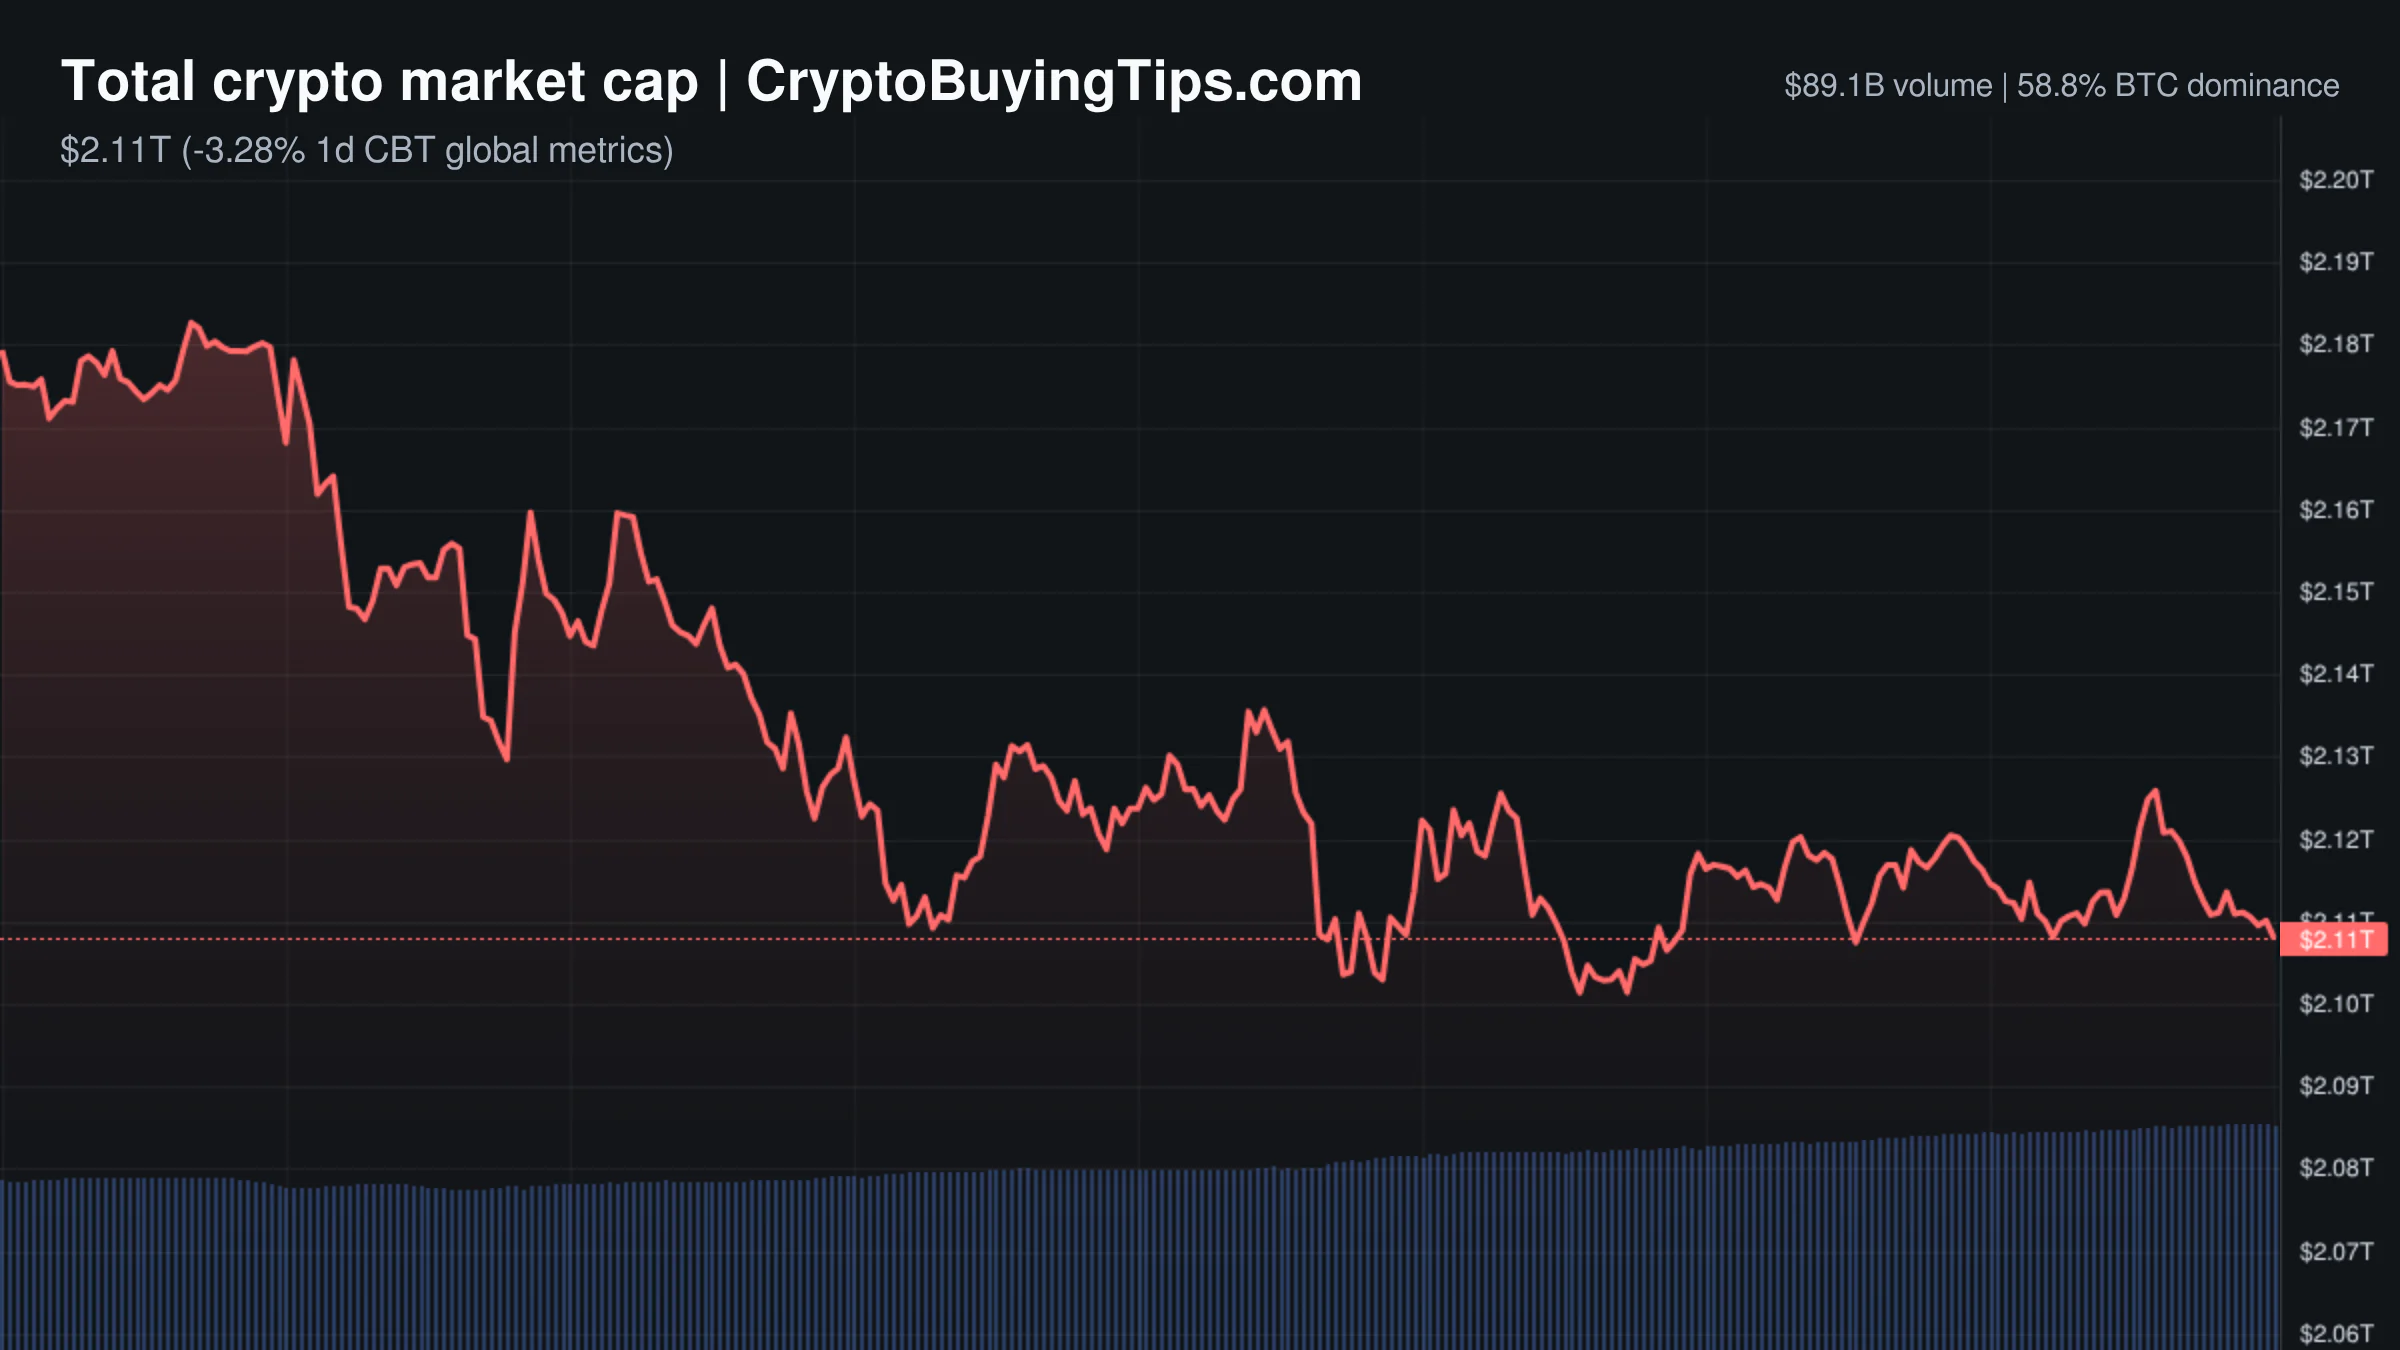
The total crypto market cap is $2.14T on CoinGecko's count, down 4.46% in 24 hours, and the Fear & Greed Index reads 10, which is extreme fear. CoinMarketCap shows $2.11T and a 3.23% drop. The two aggregators disagree on the size of the damage and agree on the direction, which is the part that matters. Spot volume is $88.3B on CoinGecko and $89.39B on CoinMarketCap, up 26.08%. Volume rising into a falling market usually means people are being forced to trade, not choosing to. A quiet drift lower this is not.
The derivatives numbers are larger than the spot ones. Derivatives volume is $984.38B, up 26.35%, roughly 11 times spot ($984.38B / $89.39B). Because it rose in step with spot, leverage is not unwinding faster than the underlying market is trading, but the ratio says futures and perpetuals are setting the price and spot is following. Perpetual open interest is $329.21B. Funding rates and liquidation totals did not load in today's feeds, so there is no honest way to say which side of that book is being squeezed. Stablecoin volume of $93.34B is above total spot volume, which mostly reflects stablecoins being the base pair in most trades. USDT and USDC together hold 11.39% of the market, and without a prior reading we can't say whether that share is rising.
Dominance and breadth show a market falling in one piece. Bitcoin dominance is 58.11% on CoinGecko and 58.84% on CoinMarketCap, with Ethereum at 9.99% and 10.12% respectively. Total2 (everything except Bitcoin) is $894.4B and Total3 (everything except Bitcoin and Ethereum) is $681.1B, so the gap between them is $213.3B, which is Ethereum's market cap give or take rounding. The Altcoin Season Index is 49 out of 100 in our feed and 52 to 53 on CoinMarketCap's pages. Both are neutral, and neither signals rotation. CMC20 fell 3.66% and CMC100 fell 3.65%, so there is no size skew either. Ethereum gas is 0.11 Gwei (slow) and 0.12 Gwei (fast), which means the panic is happening on exchanges and not on chain.
Macro offers no shelter. SPY is $715.87 (-1.96%) and QQQ is $645.04 (-2.19%). Gold has dropped below $3,540 an ounce and is down nearly 9% this week, its worst week since March, per Cointelegraph. Extreme fear is a proportionate response to a day on which equities, gold and crypto all fell and the safe-haven shelf was bare.
Bitcoin and Ethereum
Bitcoin trades at $61,730.57, down 3.43%, with a market cap of $1.24T. CoinDesk reports a third straight daily decline as Asian tech shares slid. The ETF data matches that run: @WuBlockchain relays $582 million of net outflows from spot Bitcoin ETFs on November 19, the third consecutive day, and CoinDesk says BlackRock's fund recorded its largest single-day outflow since launch more than two years ago. The dominance reading is awkward for the safe-haven story. On CoinMarketCap's figures, Bitcoin fell 3.43% against a 3.23% drop in the total market while dominance eased 0.11%, so Bitcoin did not act as a refuge today. Our read is that this is institutional redemption pressure, and a thin bid rather than a rotation into anything.
Ethereum is $1,746.03, down 3.33%, with a market cap of $213.47B. That is narrowly the best performance among the five largest assets in CoinMarketCap's dashboard, though it is hard to call it a victory. Spot Ethereum ETFs recorded $131 million of net outflows on November 19, the fifth consecutive day, so the institutional exit is longer-running here than in Bitcoin. Implied volatility from Volmex is 65.32 for Ethereum and 52.60 for Bitcoin, which means options markets are charging roughly 12.7 more points of volatility to hold Ethereum. With gas near zero, the premium is not about network congestion. Traders are pricing the chance of a larger move, and they have not said which direction.
Top crypto prices
Bitcoin ($61,730.57, -3.43%) and Ethereum ($1,746.03, -3.33%) set the tone. BNB is $569.44, down 3.82%, for a $74.88B market cap. XRP is $0.9522, down 3.81%, at $60.48B, and it has slipped under the $1 mark.
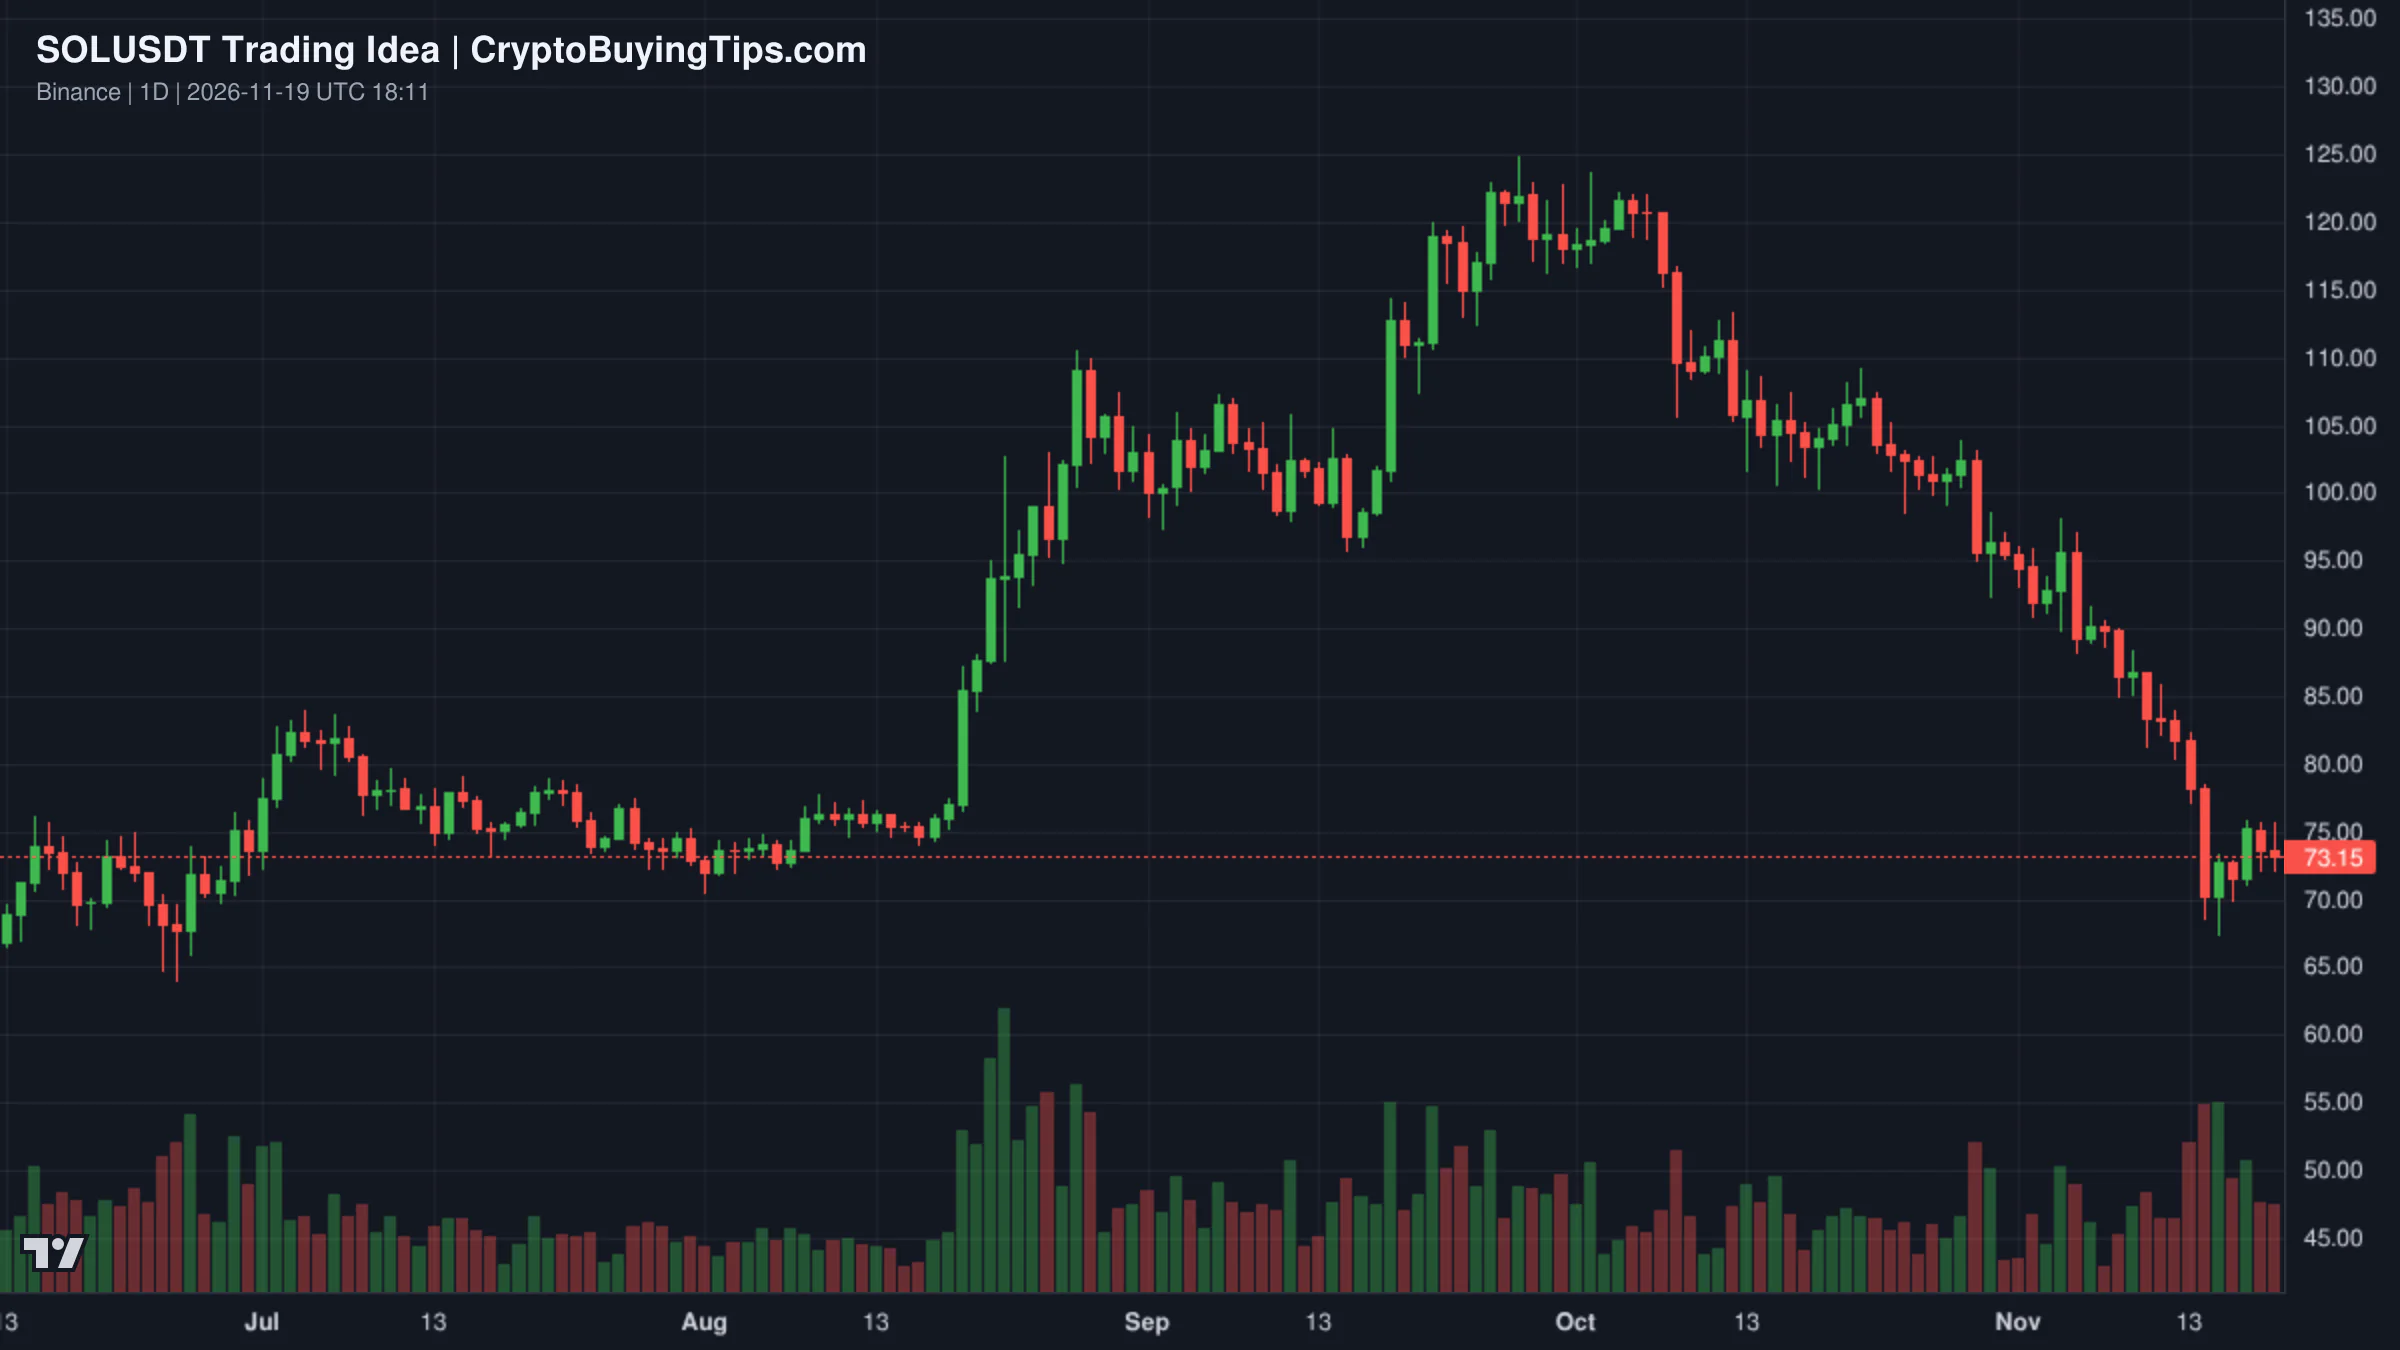
Solana is $71.67, down 4.16%, with a $42.42B market cap, the weakest of the five majors in the CoinMarketCap dashboard. TRON held up best of the seven large caps we track, at $0.3067 and down 1.79%, for $29.16B. Hyperliquid fell hardest, down 6.80% to $63.95, a $16.14B market cap and rank 9. The spread between TRON and Hyperliquid is five percentage points, wide enough to suggest the day had its own stories beyond the macro tape. Hyperliquid is covered below.
News driving today's market
Regulation is moving in a helpful direction on a day when nobody is in a mood to notice. At a Senate Banking Committee hearing, Trump's Democratic SEC nominee Kristin Johnson backed formal notice-and-comment rulemaking for the SEC's September 17 exemption allowing blockchain-based versions of US-listed shares to trade on qualifying platforms. Her Republican counterpart Steven Levine appeared alongside her, and if both are confirmed the commission would have four members, three Republicans and one Democrat. It matters for market structure because tokenization is the most plausible near-term source of new institutional demand, and a formal rule would be more durable than an exemption. But as we previously covered in our SEC safe harbor analysis, regulatory clarity and price rarely arrive on the same day.
The stablecoin story is less comfortable. CoinDesk reports that Sky's USDS shrank 35% as $1.5 billion left its reserves after an illicit-finance report, with a large holder linked to Poloniex withdrawing much of the USDC liquidity backing it. USDS held its $1 peg. That is the relevant fact for traders, because a de-peg would pull liquidity out of exactly the venues where leverage is already stretched. Sky co-founder Rune Christensen says USDS remains overcollateralized with about $10B in backing after more than $2B in outflows and calls the headlines "overblown."
Stablecoin infrastructure is also moving the other way. MoonPay has applied for a national trust bank charter to offer stablecoin issuance and redemption, reserve management and custody under federal oversight, according to The Block and Cointelegraph. Our earlier piece on the OCC bank charter news covers why the banking and securities tracks keep pulling in different directions. For positioning, a regulated on-ramp reduces friction over time, though nobody is buying a trust charter application today.
Hyperliquid got two conflicting regulatory headlines in 24 hours. CFTC Chair Michael Selig said onchain venues like Hyperliquid have two routes into the US retail market, either obtaining the required licenses or working with a registered exchange, and that no special rules apply to them. Meanwhile Hong Kong's securities regulator added the platform to its list of suspicious crypto platforms, saying it has no local license and may have promoted services to investors in the city. One door opens in Washington while another closes in Hong Kong. Finally, IOSCO warned that quantum-resistance upgrades could be particularly challenging for blockchains, flagging bulkier signatures and harder upgrades. That is a slow-burn risk and not a driver of today's tape.
Social intelligence
The macro posts are the ones that explain the price. Cointelegraph reports that JPMorgan expects the Fed to raise rates by 25 basis points at each of its next three meetings, in December, January and March, because of sticky inflation. Pair that with gold's near-9% weekly drop, which Cointelegraph attributes to a hawkish Fed and an AI stock rout, and the picture is a liquidity squeeze across every asset class at once. For crypto traders it matters because rate hikes tighten the funding conditions that leveraged positions depend on, and with derivatives eleven times spot, that is a real exposure.
The flow data from @WuBlockchain is the second thread. Three straight days of outflows from spot Bitcoin ETFs and five from spot Ethereum ETFs mean the marginal institutional buyer has left the room for now. It also explains why dip-buying has been timid.
The remaining posts are lower-stakes. Cointelegraph relays the Sky co-founder's defence of USDS, which is useful as a statement of backing but is the protocol's own account. It also notes that Trump will host a dinner on Sunday for the top 185 $TRUMP holders, reportedly per the FT, while Democrats vow to investigate conflicts of interest. The memecoin is 99% below its peak. As a sentiment indicator it is more useful than most, since the cheapest seat at that table is apparently still a six-figure bet on a coin that has lost 99%.
Trading ideas worth watching
The first idea is a bullish daily-chart view on SOLUSDT from the author MasterAnanda, who argues that Solana is a "great buy below $100" and a stronger accumulation zone below $80, with the current price of $71.67 inside that range. The thesis leans heavily on the four-year cycle and on money supply growth, and the text we have includes no stop or invalidation level. Our read is that this is a conviction argument and not a trade plan. The idea is relevant because Solana is the weakest of the major assets today at -4.16%, and the broader Altcoin Season Index sits at a neutral 49, so there is no rotation to give the setup a tailwind. Anyone acting on a "buy below $80" call needs their own exit, because the post does not supply one.
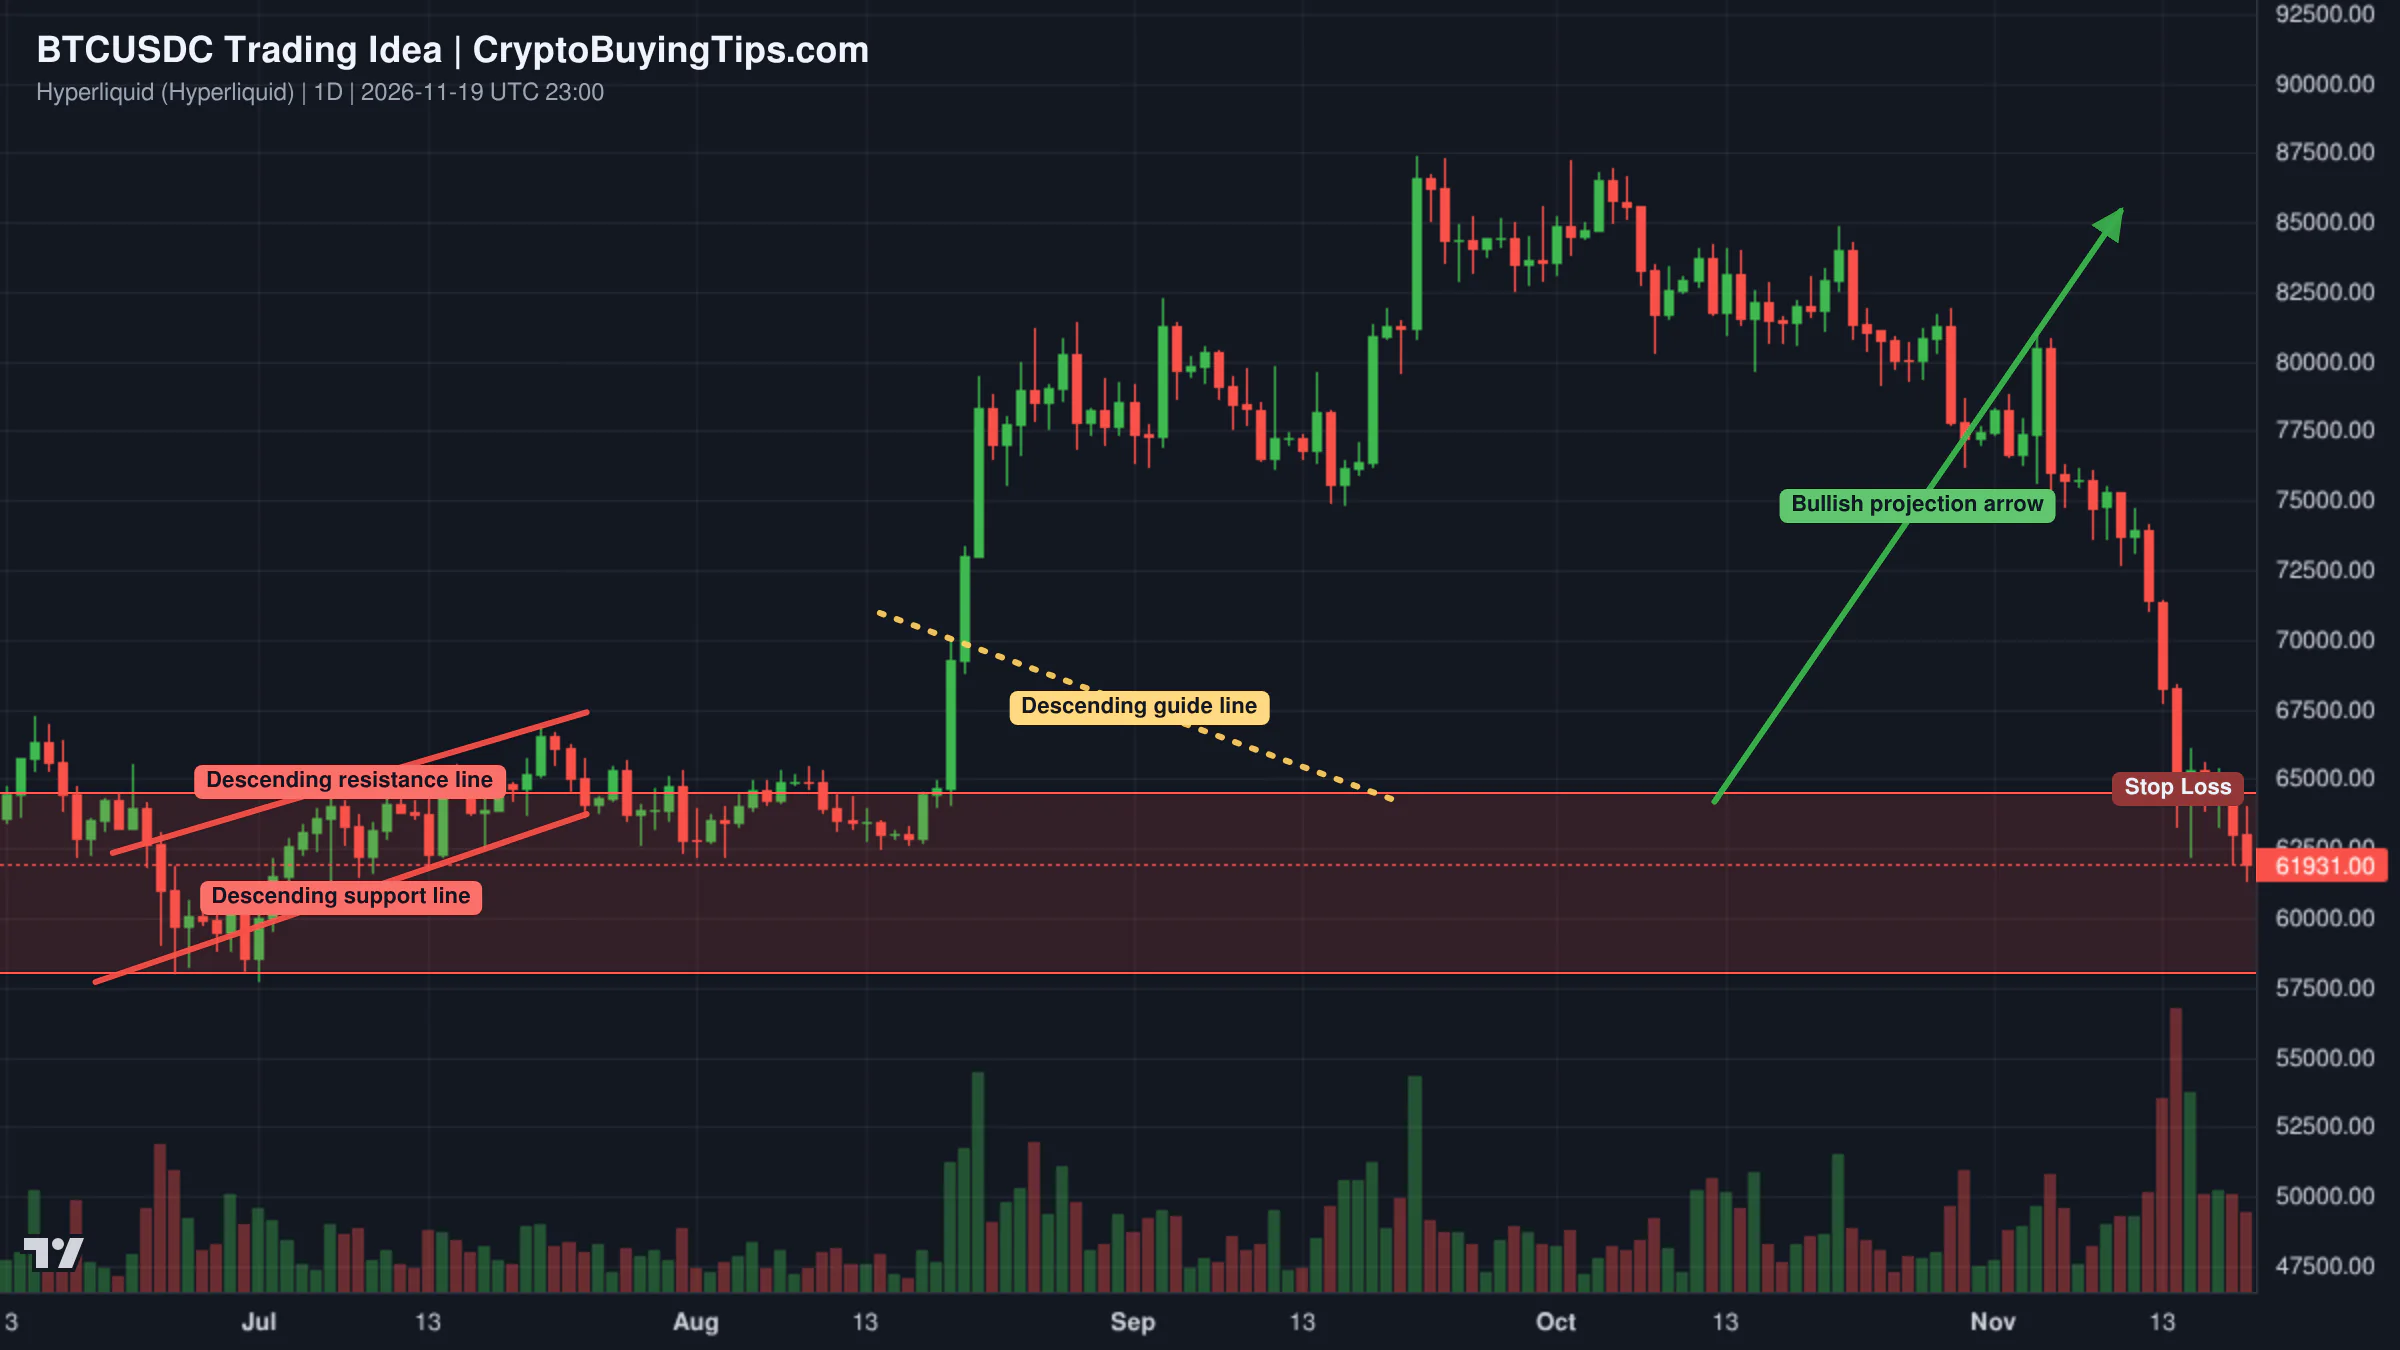
The second is a bullish BTCUSDC idea, also from MasterAnanda, framing $58,000 to $64,500 as an active buy zone. Bitcoin at $61,730.57 sits inside it. The author compares late November 2026 to late November 2022, when Bitcoin bottomed at $15,500, and projects a cycle peak as high as $160,000 by 2029 after the roughly $125,000 high in October 2025. A bear-market year every fourth year is an observation about four data points, and the code does not contain the calendar, whatever the post suggests. The excerpt we have does not state an explicit invalidation level. Our inference is that a daily close below $58,000 would take price out of the zone the author defines. With ETF outflows in their third day, the zone is more likely to be tested than respected.
The third is a bullish XRPUSDT idea from MyCryptoParadise, focused on the $0.93 to $1.00 support zone, where XRP at $0.9522 now sits. The argument is that the breakdown happened on lower volume than the preceding bullish impulse, which would suggest exhaustion. If buyers defend the zone and confirm, the first resistance is $1.67, followed by $2.40. The setup is invalidated by a daily close below roughly $0.85. The caution is that the idea was published on November 19, and since then market volume has risen about 26% on CoinMarketCap's figures. A low-volume breakdown theory is harder to sustain when the broader tape is loud. The levels are clear and the risk is defined, which is more than the other two ideas offer.
Smart Money Signals — Hyperliquid Leaderboard
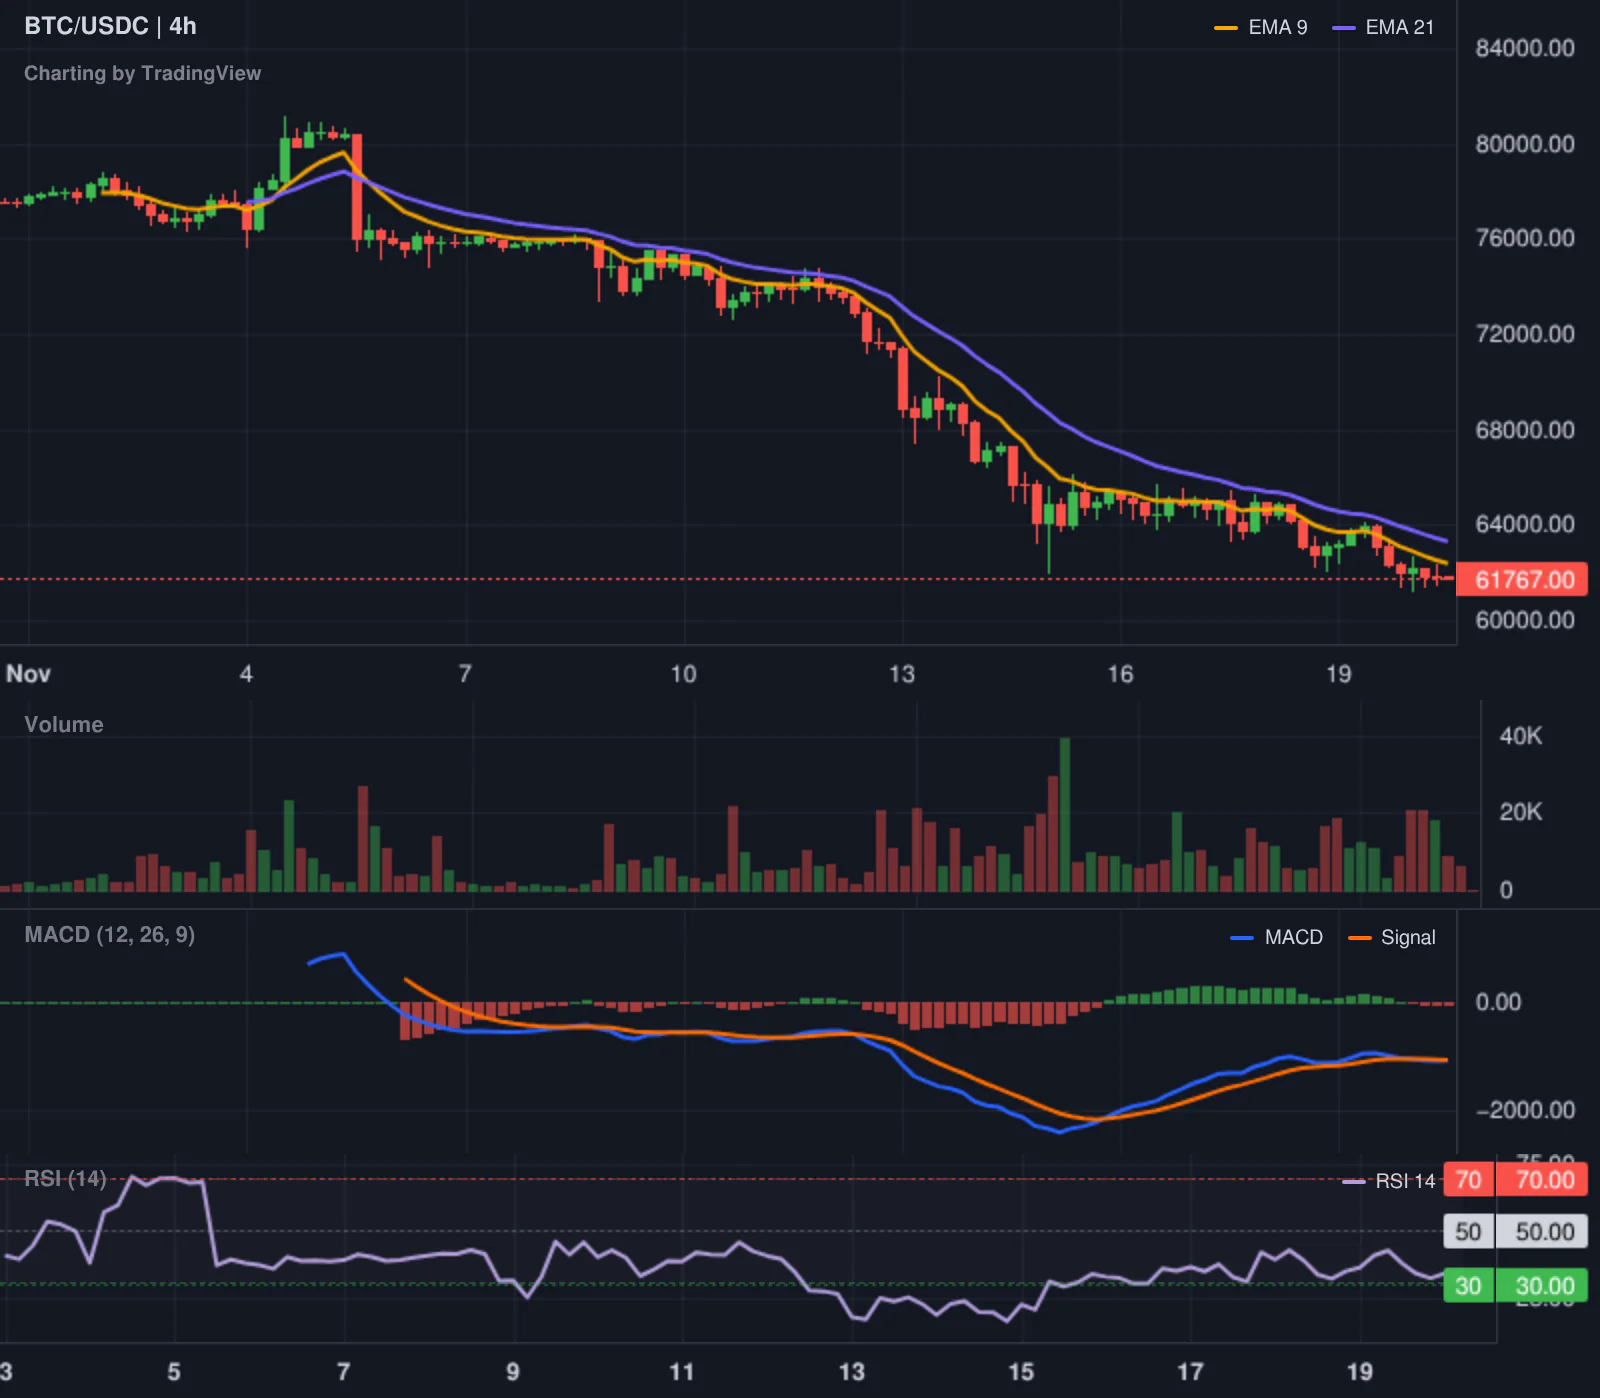
Our Hyperliquid leaderboard tracker flagged a short on BTC/USDC from wallet 0xf1881e..., opened at $62,000 with $124,000 in notional at 10:51 UTC today. The signal carries a confidence score of 75 and lists all-time ROI of 168.7% and all-time PnL of $44.2K, though the signal's own reason text describes the 169% as a 30-day figure, so treat the label with care. Bitcoin is trading at $61,730.57, so the position is marginally in profit. It is also small. $124,000 of notional is a rounding error against $329.21B in perpetual open interest, and one tracked wallet shorting into a three-day slide is a data point, not a consensus. Funding and liquidation data were unavailable today, so we can't tell whether the crowd is on the same side.
Altcoin Spotlight
Hyperliquid (HYPE) is the one altcoin where the news and the price action line up. It fell 6.80% to $63.95, the worst of the seven large caps we track, while its $16.14B market cap still ranks it ninth. The CFTC's guidance gives onchain perpetual venues a stated path to US retail through licensing or a registered partner, which is a clarification and not a free pass. Hong Kong's warning points the other way, and the market appears to have weighted the second more heavily today. Our tracker's short signal on Bitcoin is also a Hyperliquid trade, so the venue's relevance does not depend on its token. What is missing is data: no funding rates, no HYPE-specific open interest. The drop is clear, and the cause is inference.
What to watch next
The first thing to watch is whether the ETF outflow streak breaks. Three days in Bitcoin and five in Ethereum are enough to explain most of today's weakness, and a flat or positive print would be the earliest sign that forced selling is ebbing. The second is the Fed. JPMorgan's forecast of three consecutive 25 basis point hikes starting in December, if it shows up in pricing, would keep pressure on every risk asset including gold, which has already lost nearly 9% this week.
On the charts, the levels in play are the $58,000 to $64,500 band for Bitcoin and the $0.93 to $1.00 zone for XRP, with a daily close below $0.85 the stated invalidation for the XRP bulls. The derivatives book is the wildcard. At roughly 11 times spot volume and $329.21B in perpetual open interest, it will decide how disorderly any further move becomes, and funding and liquidation data would help considerably when they return. Sky's USDS reserves, the confirmation path for the SEC nominees, and Hyperliquid's response to Hong Kong are slower stories, but each could produce the next headline. Extreme fear at 10 can persist for a long time. The market has not yet provided a reason to say it is over.
Some links in this article may be affiliate links. We may earn a commission at no extra cost to you — this never influences our analysis or coverage.

Sigrid Voss
Crypto analyst and writer covering market trends, trading strategies, and blockchain technology.
More Articles

Sky's USDS shrank 35% and still held $1. The reserve design is the story
A stablecoin losing a third of its supply in a single day usually signals a crisis, but Sky USDS managed to maintain its…
Crypto Market Overview | Extreme fear meets a flat tape as derivatives volume towers over spot | November 19, 2026
The Fear & Greed Index hits extreme fear at 12, yet the crypto market remains flat as derivatives volume towers over…

XRP is calm at $0.9771 in extreme fear. These are the levels that decide whether it lasts
XRP is currently shrugging off a market in extreme fear. We see $0.94 as the critical support level that determines if…
Crypto Market Overview | Extreme fear and heavy derivatives leverage as spot volume declines and Bitcoin tracks risk assets | November 18, 2026
Bitcoin trades near $64,190 amid extreme fear as spot volume declines. Derivatives volume is up 9.03%, showing heavy…