
Crypto Market Overview | fear dominates as derivatives volume surges amid regulatory headwinds | June 18, 2026
Crypto Market Overview | fear dominates as derivatives volume surges amid regulatory headwinds | June 18, 2026
Market overview
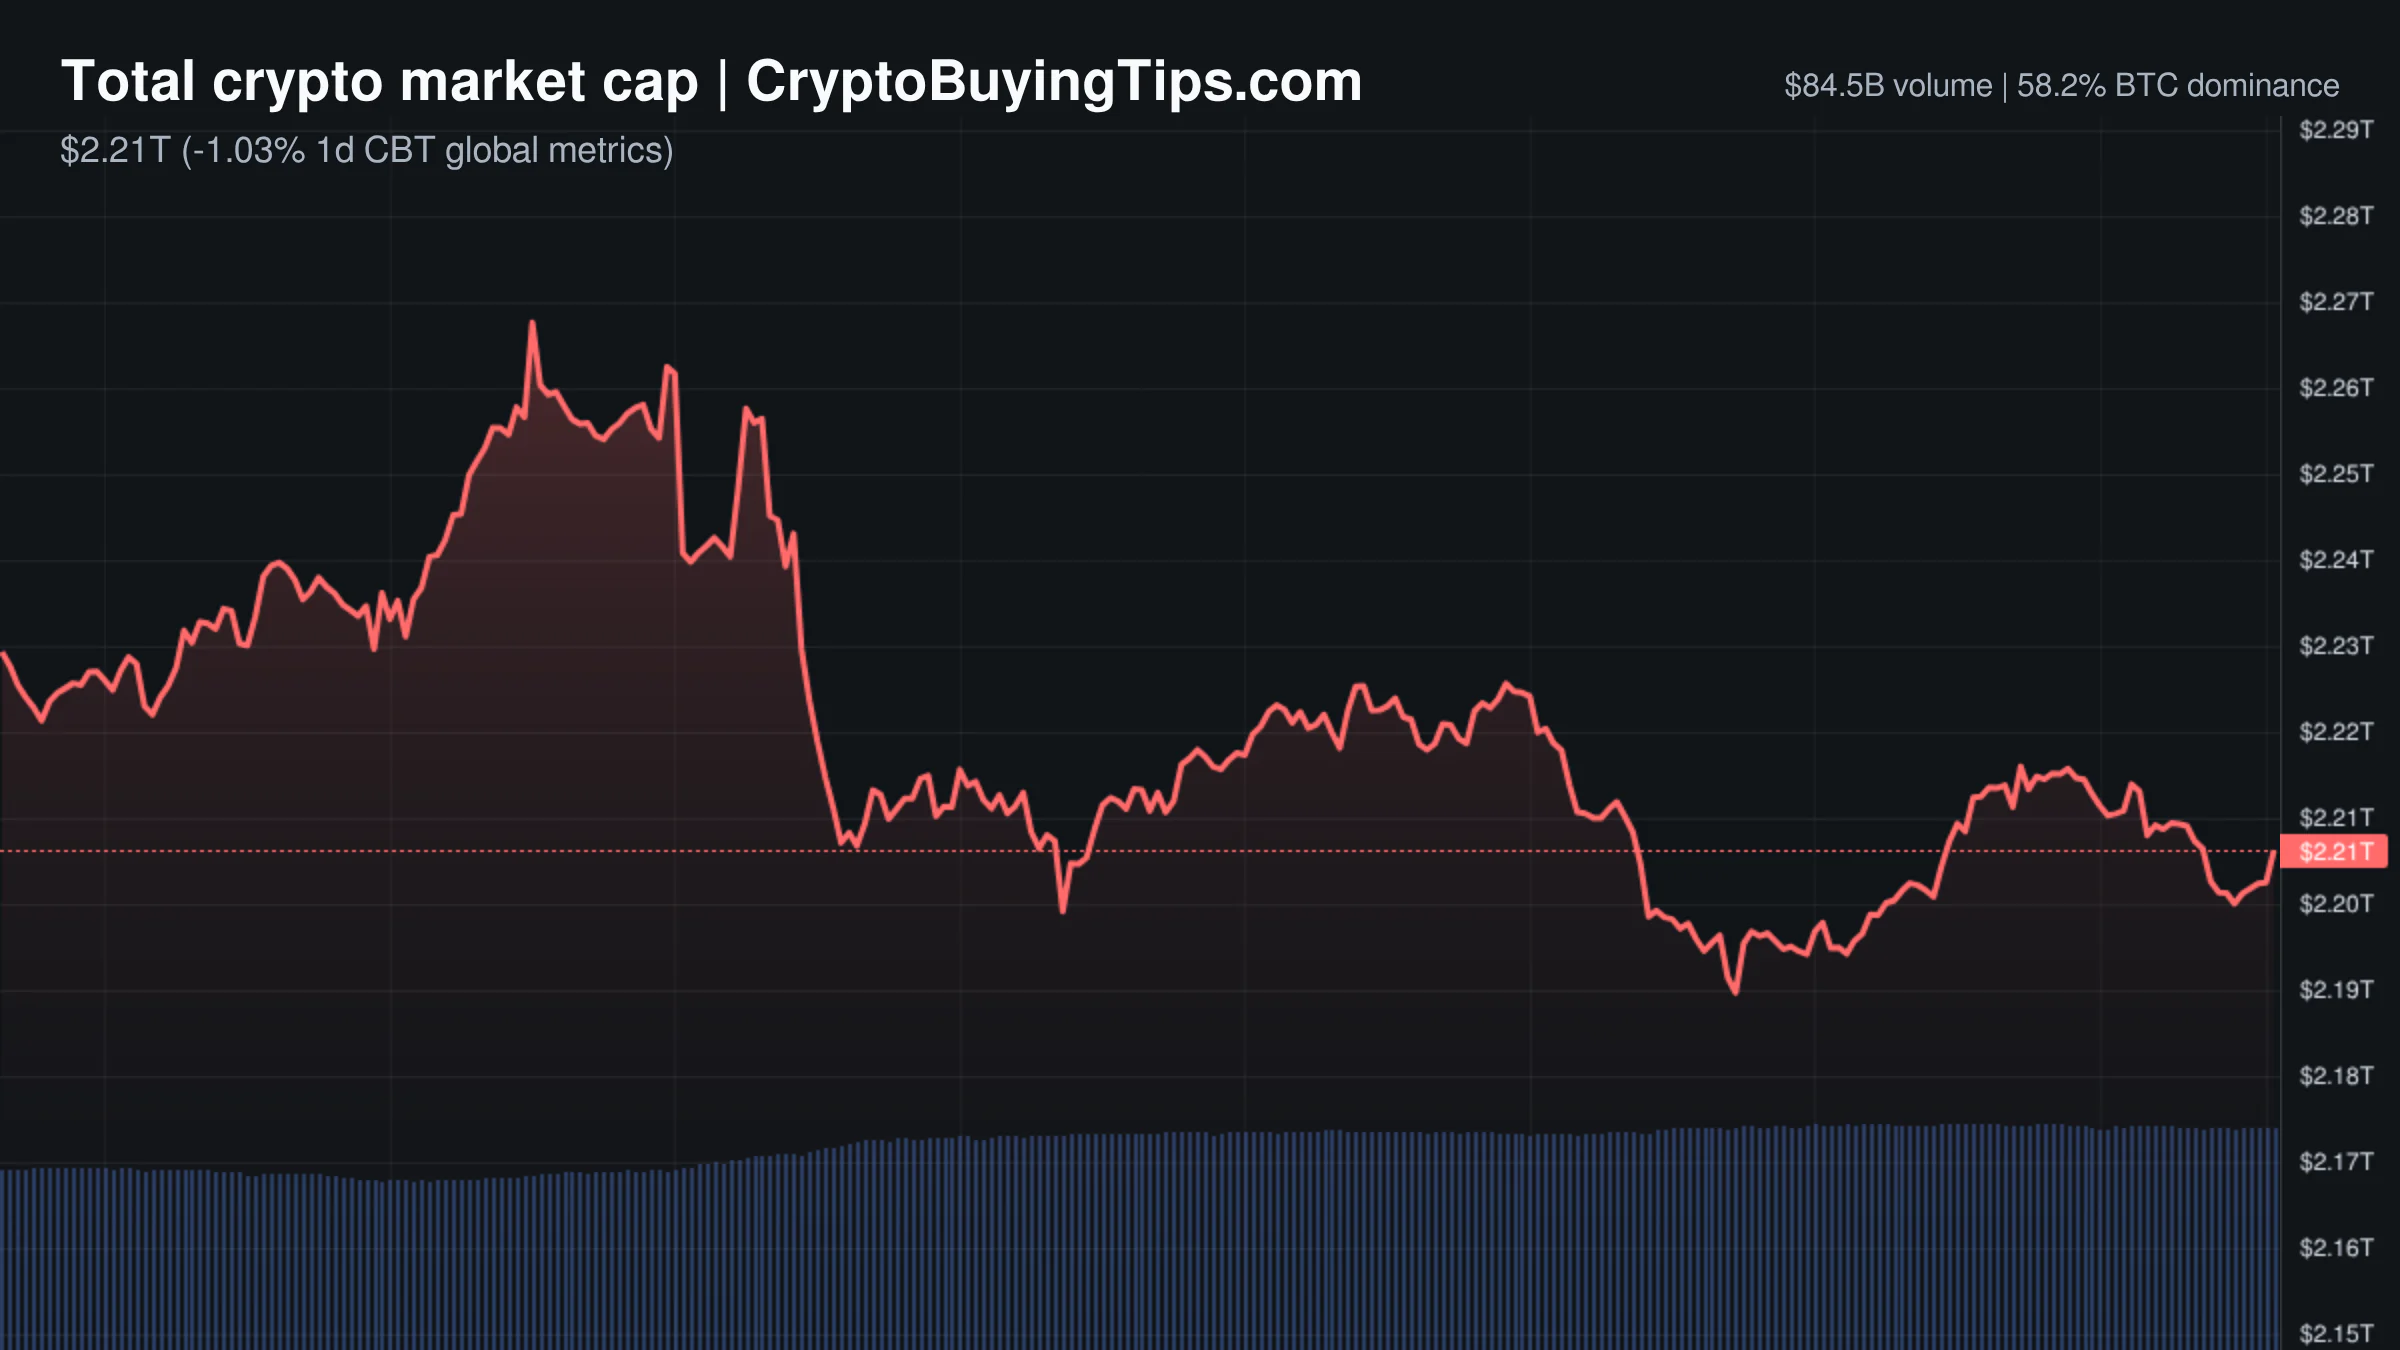
The crypto market is currently defined by a stark disconnect between price action and activity. While the total market cap has drifted lower to $2.29T, 24h volume has surged to $87.8B. This is not the kind of volume that suggests a healthy organic rally. Instead, we are seeing a massive derivatives dominance, with perpetuals and futures volume at roughly $872B, completely dwarfing the $84B in spot trading.
Sentiment is bleak. The Fear and Greed Index has plummeted to 21, placing the market firmly in the "Fear" zone. This level of pessimism often acts as a contrarian signal, but the immediate data is less comforting. We are seeing a volume and price divergence where the market cap is declining while volume spikes, which usually points to aggressive selling or a violent repositioning of leveraged bets.
Dominance metrics show Bitcoin maintaining a strong grip at 56.05%, while Ethereum sits at 9.19%. Stablecoin dominance (USDT and USDC) is at 11.40%. When stablecoin dominance rises during a price drop, it suggests capital is moving to the sidelines rather than rotating into other assets. The macro backdrop provides little relief, with the S&P 500 and NASDAQ both trading down over 1%, confirming a broader risk-off mood across traditional finance.
Bitcoin and Ethereum
Bitcoin is currently trading at $64,109.93, down 1.01% over the last 24 hours. The asset is struggling to find a firm floor as it retests broken resistance levels that have recently turned into support. While some analysts argue the current correction is a necessary process of build-up before a move toward $100,000, the immediate reality is a market that feels heavy.
Ethereum is in a more precarious position, priced at $1,749.52 and down 1.14%. The most telling metric here is the network state. Gas fees are extremely low, ranging between 0.11 and 0.28 Gwei. This indicates a significant drop in on-chain demand and congestion. It is difficult to build a bullish case for ETH when the network is this quiet.
The divergence in sentiment is also appearing in exchange data. Recent reports from Binance show user holdings of BTC and ETH have actually risen, with BTC holdings up 4.26% and ETH up 10.17% since May. However, this accumulation is not translating into price strength, suggesting that holders are simply weathering the storm rather than aggressively buying the dip.
Top crypto prices
The broader market is feeling the weight of the current regime. BNB has fallen 1.93% to $589.88, and XRP is down 2.41% at $1.16. Solana has slipped 1.61% to $71.11, despite some fundamentally positive news regarding institutional credit ratings.
A rare bright spot is TRON, which managed a modest gain of 0.45% to trade at $0.3209. Hyperliquid is also holding relatively steady compared to the majors, down only 0.70% at $71.71.
News driving today's market
The news cycle is a mixed bag of institutional validation and regulatory friction. On the positive side, Moody’s is expanding its credit ratings system to Solana, allowing tokenized bond issuers to embed ratings directly on-chain. This is a significant step for the Real World Asset (RWA) narrative. We previously covered how tokenized stocks for investors could accelerate institutional adoption, and Moody's entry provides the necessary credit infrastructure to make that a reality.
However, the "everything app" hype is meeting a reality check. While firms like BlackRock continue to push tokenization, we previously noted that the tokenizing stocks trap often involves centralized receipts rather than true decentralization.
Regulatory pressure is mounting in the US. Illinois has signed a 0.2% crypto transaction tax, which critics call one of the most punitive laws in the country. Simultaneously, Kentucky has sued prediction markets like Polymarket and Kalshi. These moves signal a shift toward state-level aggression when federal clarity remains elusive.
Perhaps the most understated but systemic risk is coming from France. The cybersecurity agency ANSSI will stop certifying security products that lack quantum-resistant encryption starting in 2027. While this is a long-term horizon, it forces the industry to acknowledge that the cryptography securing Bitcoin and Ethereum has an expiration date.
Social intelligence
On-chain data reveals some institutional discomfort. A whale recently deposited over 43,000 ETH into Binance, incurring a loss of over $11 million in the process. When whales move large sums to exchanges during a downturn, it usually suggests a desire for liquidity or a hedge against further drops.
There is also a notable divergence in how different participants are pricing the market. Data suggests that Binance funding rates are running significantly below the three-exchange median. This indicates that institutional "smart money" is pricing the market bearishly, while retail traders are continuing to buy the dip. This is a classic setup for a "bull trap" where retail optimism is absorbed by institutional selling.
Trading ideas worth watching
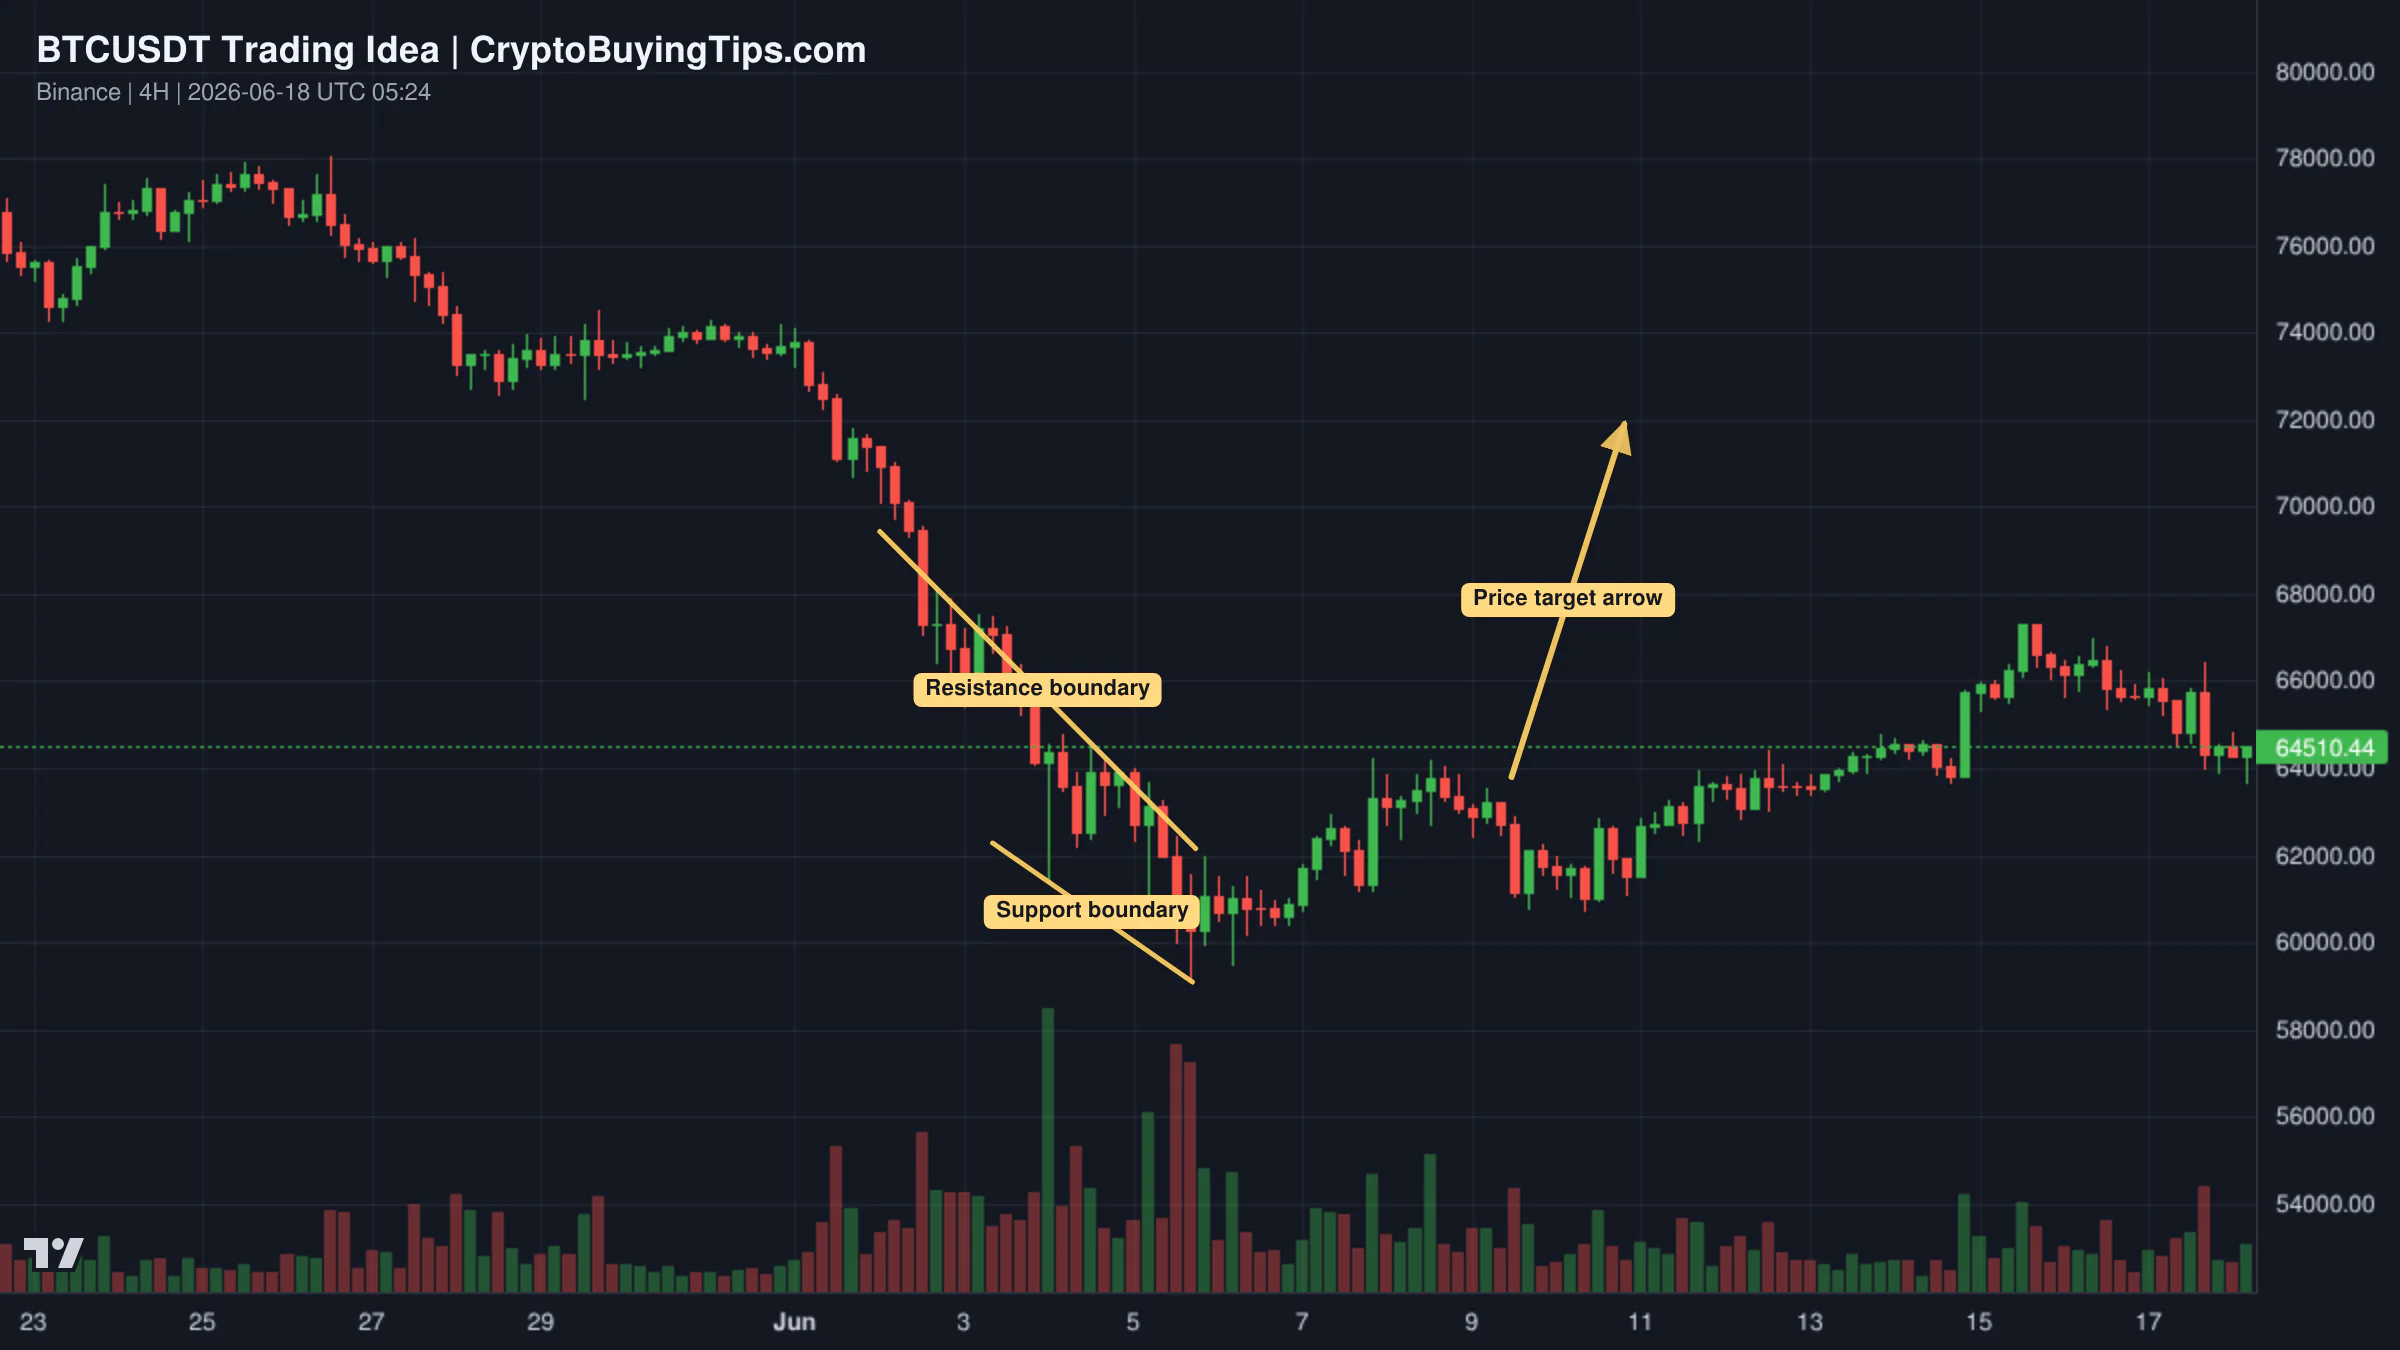
For Bitcoin, there is a bullish setup based on the retest of broken resistance. The price has fallen back to the $64,000 zone, which now needs to act as support. If buyers step in here, targets are set at $65,800 and $68,000. The risk is time. If BTC lingers in this zone for too long without a bounce, the bullish structure fails.
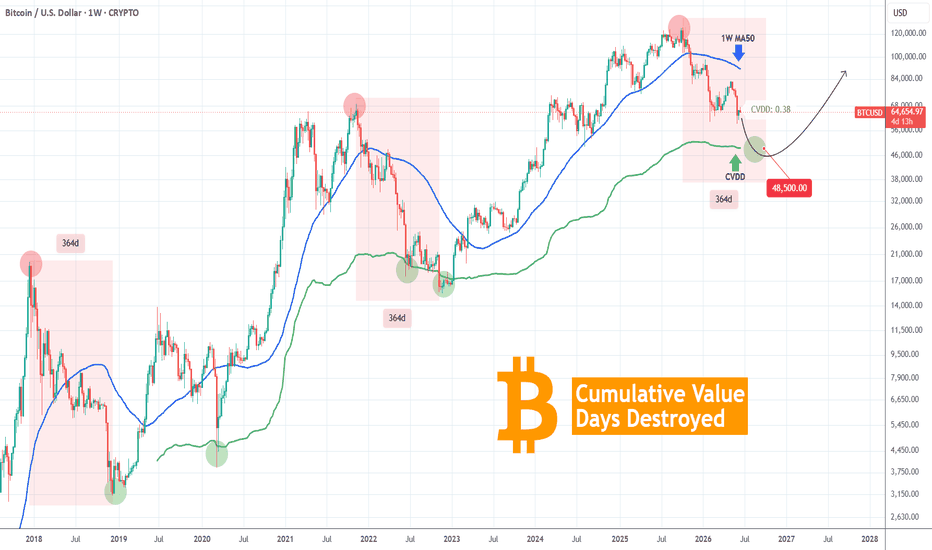
A more long-term view utilizes the Cumulative Value Days Destroyed (CVDD) indicator. This model suggests that if the current bear cycle follows previous one-year patterns, a bottom could be priced around October 5, 2026, with a minimum target of $48,500. It is a grim projection, but it provides a mathematical floor for those not blinded by the $100k narratives.
Smart Money Signals — Hyperliquid Leaderboard
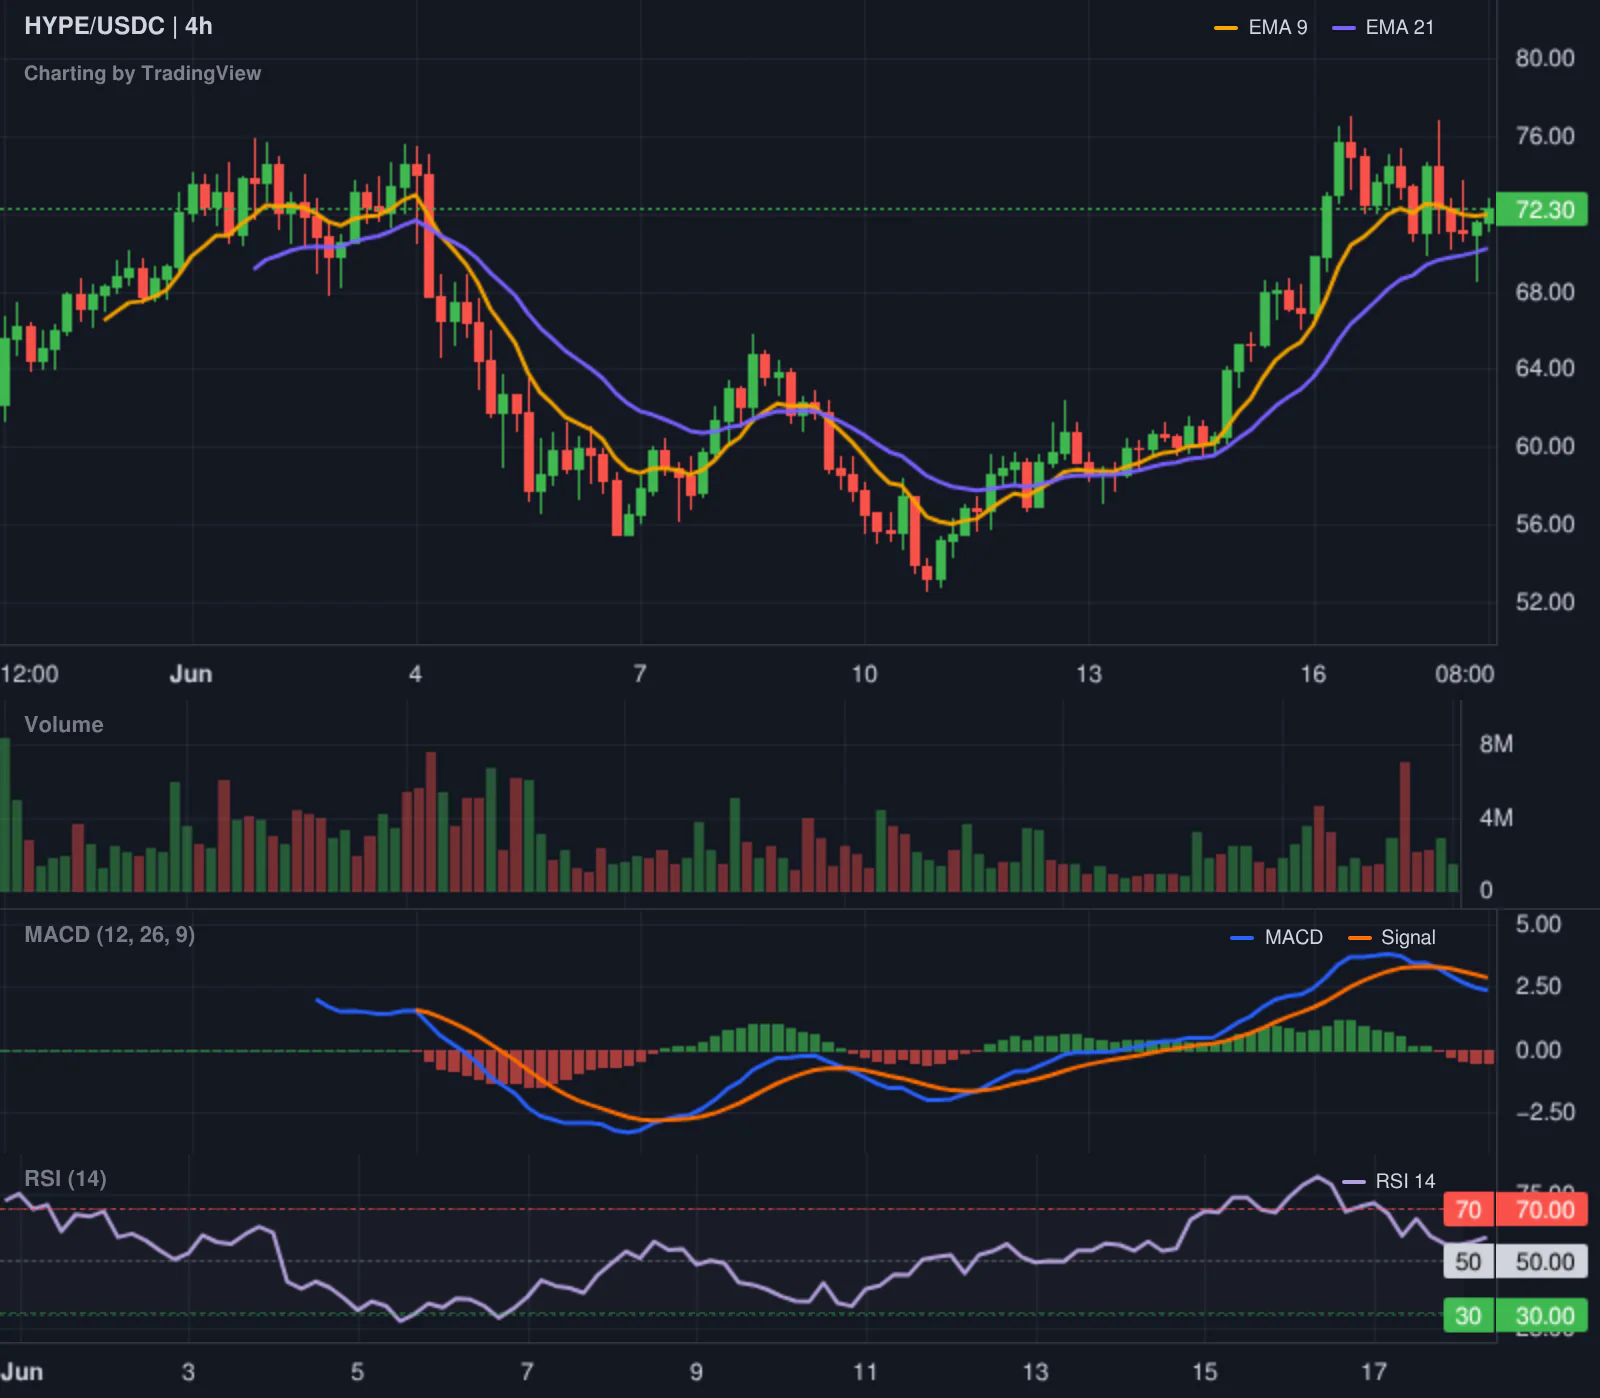
Our tracking of the Hyperliquid leaderboard shows a high-confidence long position in HYPE. Trader 0xffe4e3, who boasts an all-time PnL of $1.06M and a 230.7% ROI, opened a long at $59.182 with a notional value of approximately $53,900. Given the trader's track record and the relatively stable price action of HYPE compared to the majors, this suggests a conviction play on the protocol's underlying growth rather than a momentum trade.
What to watch next
The immediate focus is on the $64,000 level for Bitcoin. If this support fails, the market may accelerate toward the "Extreme Fear" levels that often precede a genuine bottom. We also need to monitor the stablecoin dominance; if it continues to climb, it confirms that traders are not just rotating, but exiting.
Keep an eye on the US state-level regulatory news. The Illinois tax is a potential blueprint for other states looking to plug budget holes. Finally, watch the ETH gas fees. Until we see a spike in on-chain activity, Ethereum remains a ghost town, regardless of what the price charts suggest.
Some links in this article may be affiliate links. We may earn a commission at no extra cost to you — this never influences our analysis or coverage.
Sigrid Voss
Crypto analyst and writer covering market trends, trading strategies, and blockchain technology.
More Articles
Crypto Market Overview | broad liquidity withdrawal amid extreme fear and regulatory pressure | June 19, 2026
Liquidity withdraws amid extreme fear; see how regulatory pressure affects crypto market overview metrics like BTC…

Morgan Stanley is filing for SOL ETFs while the market is in extreme fear
Another day, another signal that money is moving despite the panic. Morgan Stanley's ETF filings for SOL and ETH suggest…
Crypto Market Overview | high fear and volume collapse amid regulatory clashes | June 17, 2026
The crypto market shows high fear and low volume amid regulatory clashes; see our overview on current price action and…

BlackRock and Coinbase are tokenizing stocks, but the everything app trade is a trap
The narrative suggests tokenized stocks mean true financial revolution; our read is they mostly mean centralized…