
Crypto Market Overview | Liquidity vanishes as spot volume drops while derivatives remain bloated | October 10, 2026
Crypto Market Overview | Liquidity vanishes as spot volume drops while derivatives remain bloated | October 10, 2026
Market overview
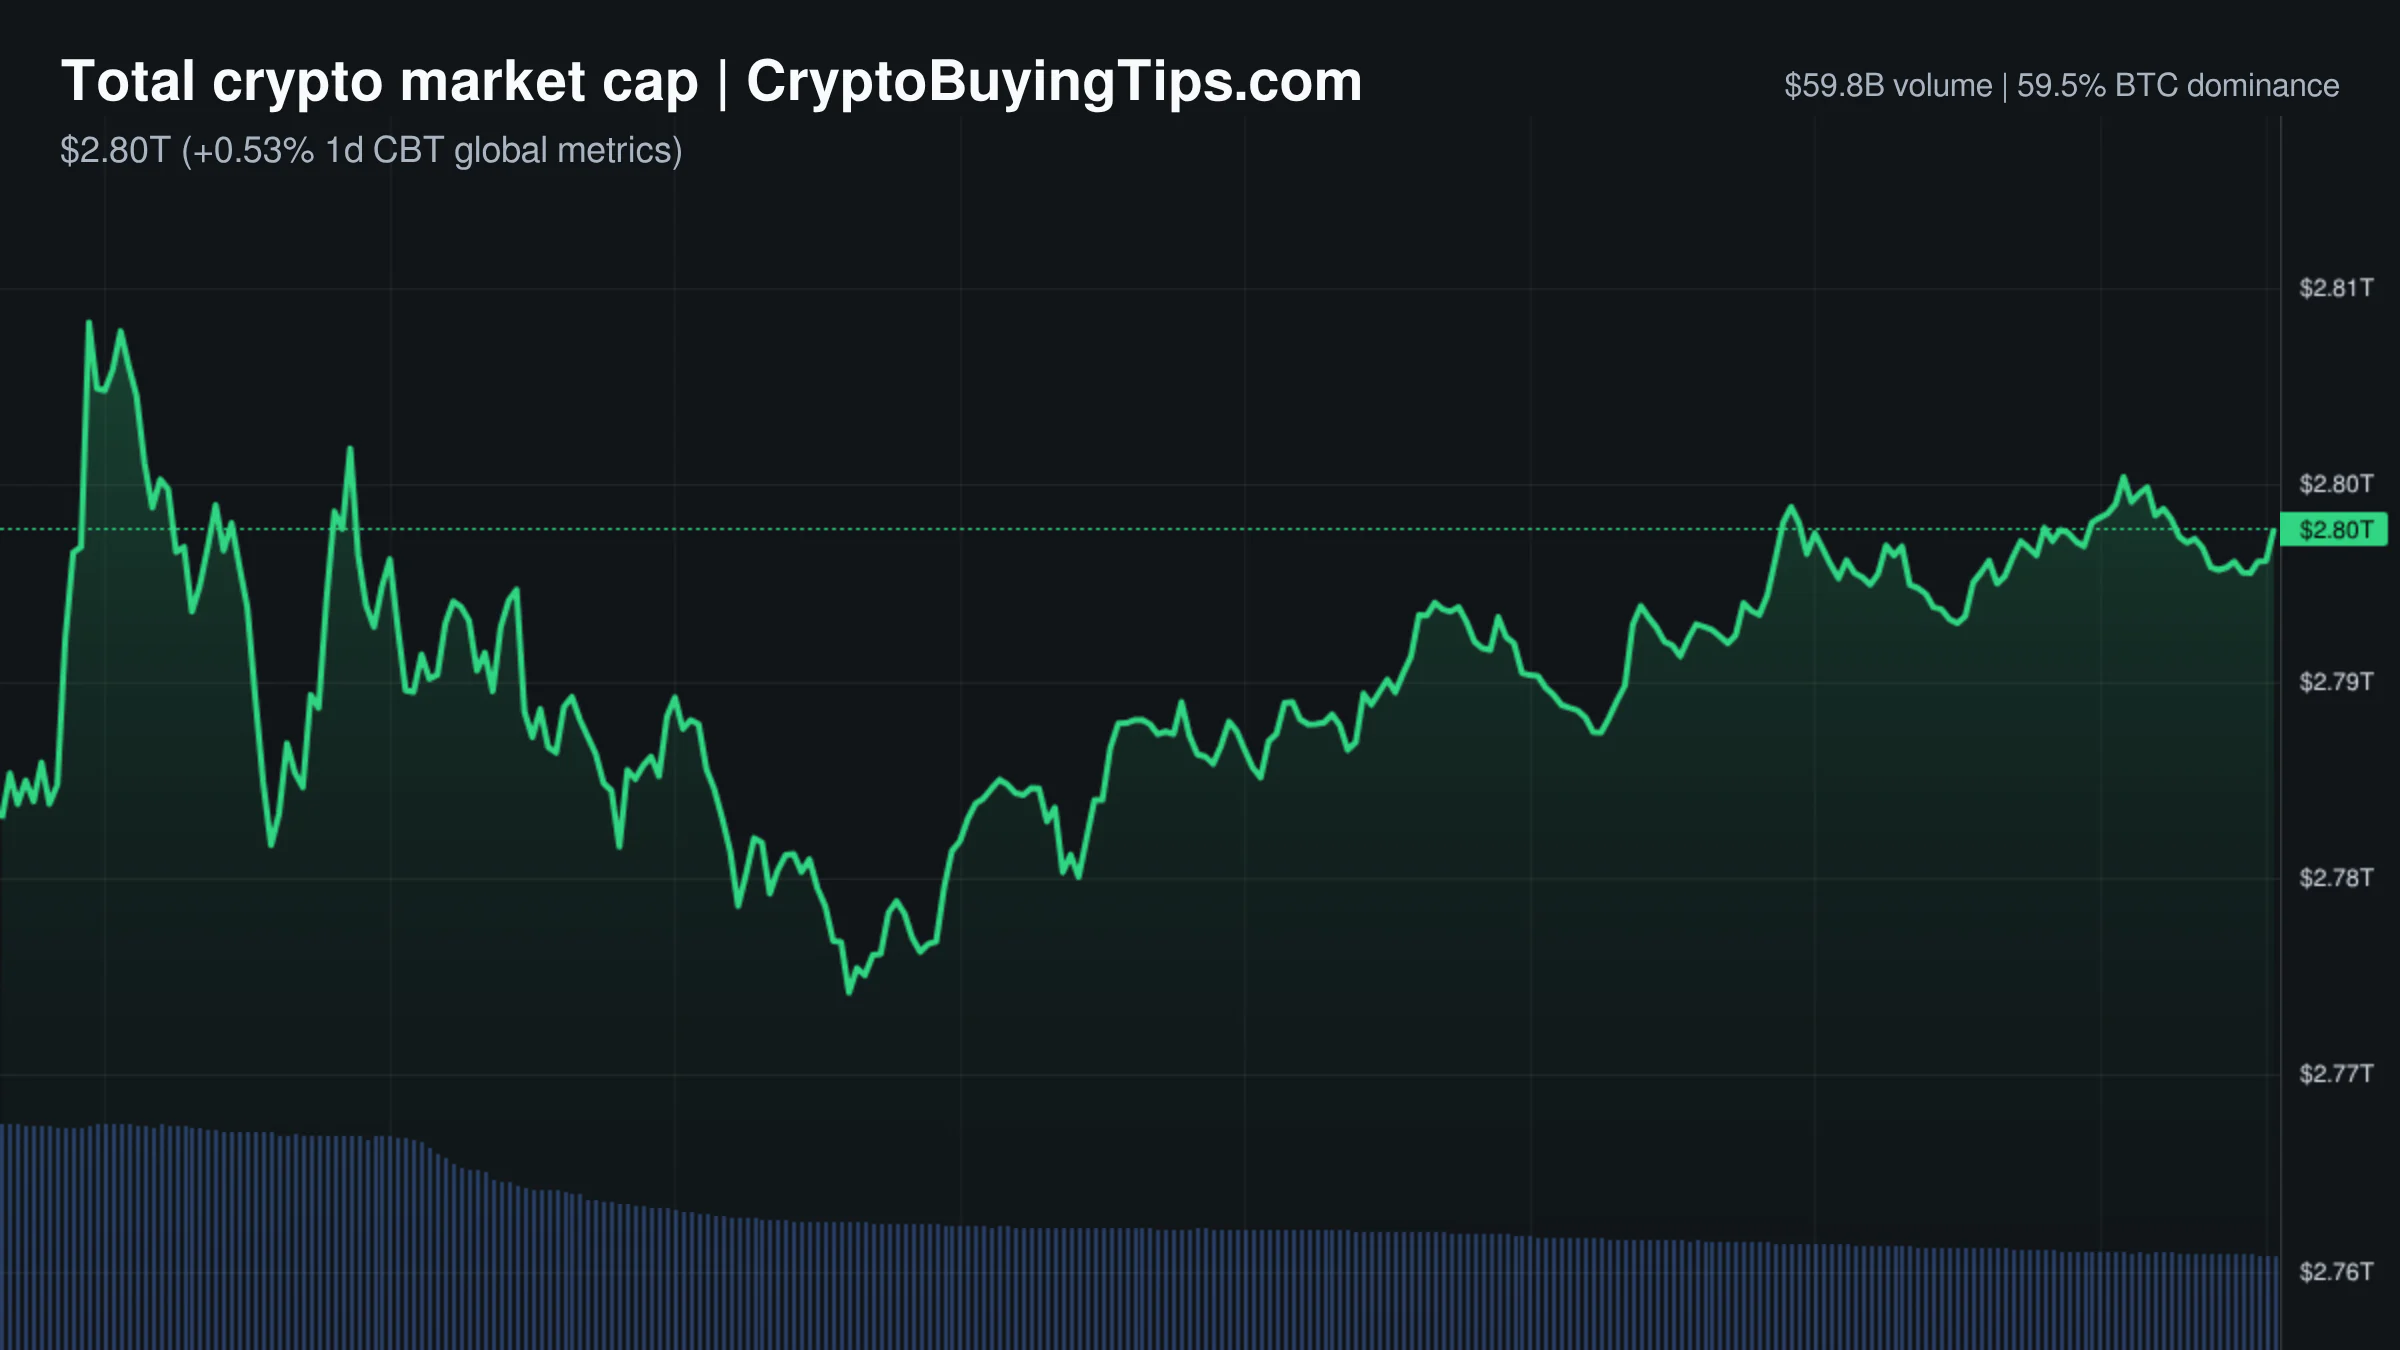
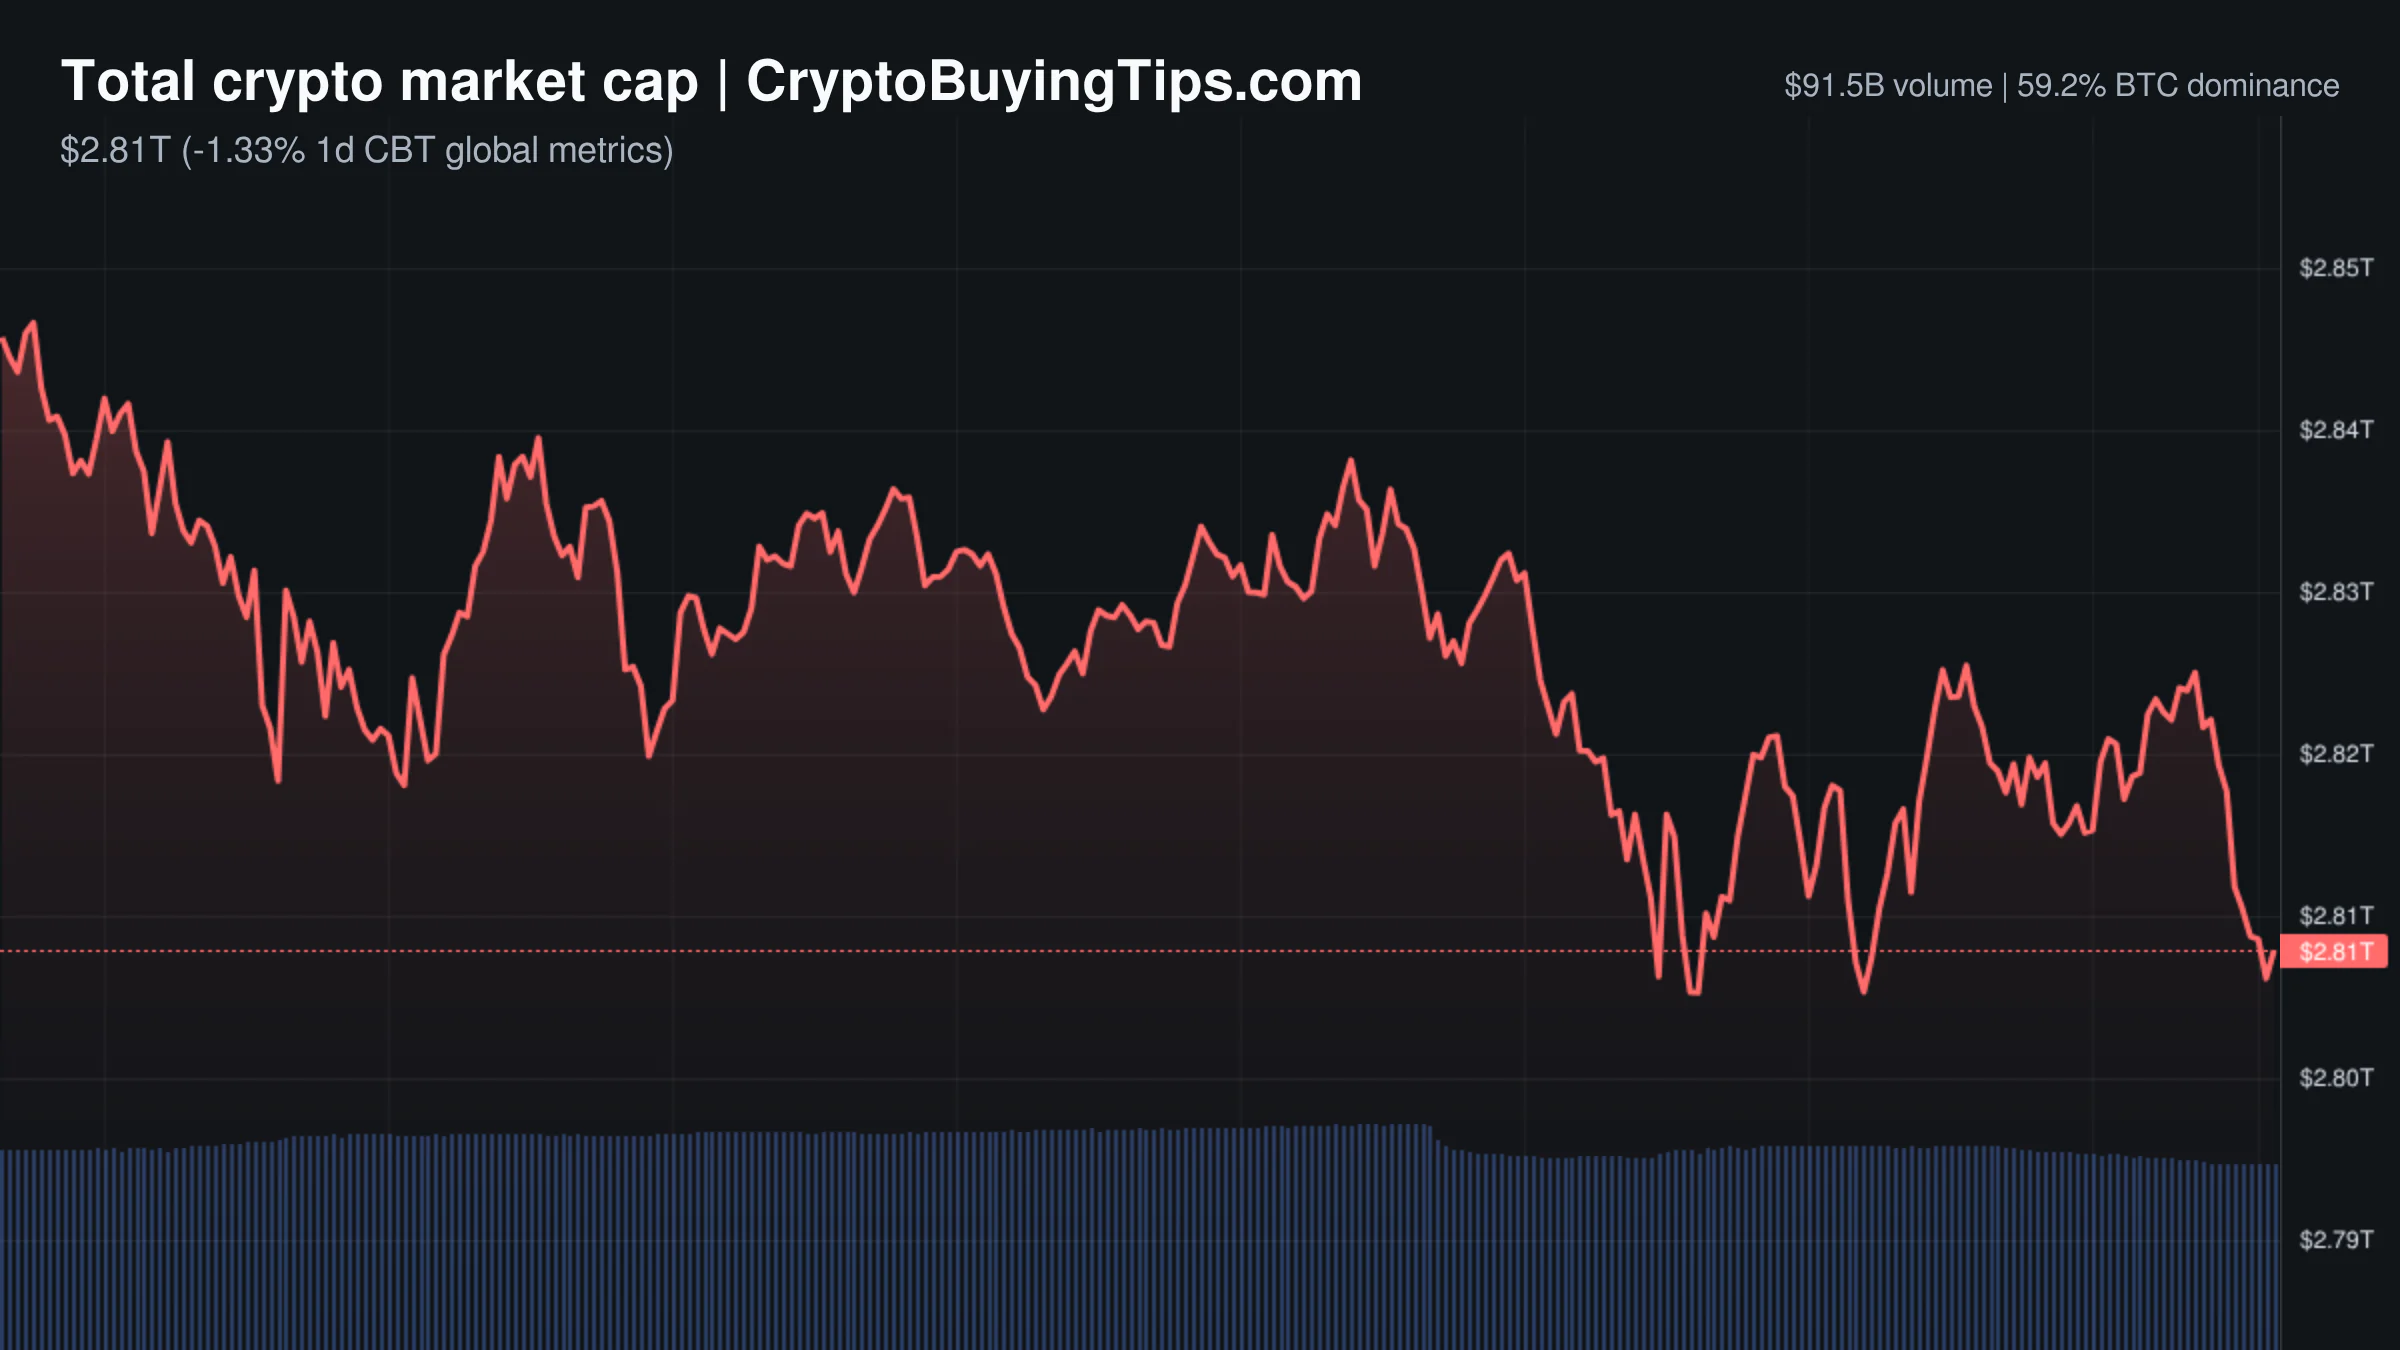
The crypto market is currently experiencing a strange sort of paralysis. While the total market cap sits at $2.79T, the internal plumbing is showing signs of a severe blockage. We are seeing a synchronized collapse in trading activity, with spot volume dropping nearly 47% to $59.93B. It is a rare moment where prices are drifting slightly positive, but the conviction behind those moves is nonexistent.
The most glaring contradiction is the divide between spot and derivatives. Derivatives activity is dwarfing spot trading by a factor of nearly ten, with perpetuals and futures volume sitting well over $500B. This suggests a market driven almost entirely by leveraged bets rather than actual asset accumulation. When spot volume vanishes while derivatives remain bloated, the market becomes fragile. Any sudden move can trigger a cascade of liquidations because there is no deep spot bid to absorb the shock.
Sentiment is currently neutral, with the Fear and Greed Index at 56. This neutrality is less about balance and more about boredom. Bitcoin dominance remains high at 59.62%, and the Altcoin Season Index of 48 confirms that capital is not rotating into smaller assets. We are in a holding pattern where the broader macro environment, including a slightly positive S&P 500 and NASDAQ, is providing a soft floor, but no one is willing to lead the charge higher.
Bitcoin and Ethereum
Bitcoin is trading at $82,779.94, managing a marginal gain of 0.42% over the last 24 hours. Despite the price stability, the underlying structure is stressed. Recent data shows that BTC slid from $85.7K to $82.5K earlier this week, a move that wiped out $1.97B in long positions. The current price action looks like a slow recovery from that flush, but with implied volatility at 38.47%, the market is pricing in a decent amount of uncertainty.
Ethereum is in a more precarious position, trading at $2,494.64. While the 24h change is a modest 0.24%, the network itself is ghost-town quiet. Gas fees have plummeted to 0.1 Gwei for fast transactions, which is an indicator of minimal on-chain utility. It is difficult to maintain a bullish narrative when the actual usage of the network is this low. Furthermore, ETH is seeing much higher implied volatility (51.69%) than Bitcoin, suggesting that traders expect significantly more violent swings for the second largest asset.
Top crypto prices
The broader market is seeing a few isolated pockets of strength. BNB has climbed 0.97% to $748.88, and XRP is one of the day's better performers, up 1.48% to $1.4. Solana remains flat at $109.58.
On the losing side, Hyperliquid has dipped 2.16% to $83.89, and TRON is down 0.38% to $0.3306. The general trend across the CMC20 and CMC100 indices is a slight uptick, but these gains are thin and lack the volume to be considered a trend reversal.
News driving today's market
The news cycle is a clash between institutional plumbing and systemic fear. On one hand, HSBC and Ant Digital are testing AI payment rails development using tokenized deposits. This is the kind of "boring" institutional progress that actually builds long-term value, moving beyond speculation into real-time settlement for AI agents. This aligns with Jesse Pollak's view that a tokenization supercycle for equities and non-dollar stablecoins is coming, with tokenized stocks on Base already seeing up to $100M in daily volume.
However, the mood is dampened by reports that OpenAI and Anthropic are privately war-gaming a "catastrophic AI event," specifically cyberattacks on financial and power infrastructure. It is a bit poetic that the industry is building high-end payment rails while simultaneously rehearsing for the end of the internet. This macro uncertainty, combined with the US Treasury's plan to seize $1B in crypto linked to Iran, adds a layer of geopolitical risk that keeps traders cautious. We previously covered active crypto management for more background.
Regulatory pressure also remains a theme. The New York Attorney General has permanently barred former Celsius CEO Alex Mashinsky from the industry in a $35M settlement. While Mashinsky is already serving a prison sentence, the permanent ban and the focus on "scammers" serve as a reminder that the era of the unregulated "crypto celebrity" is firmly over.
Social intelligence
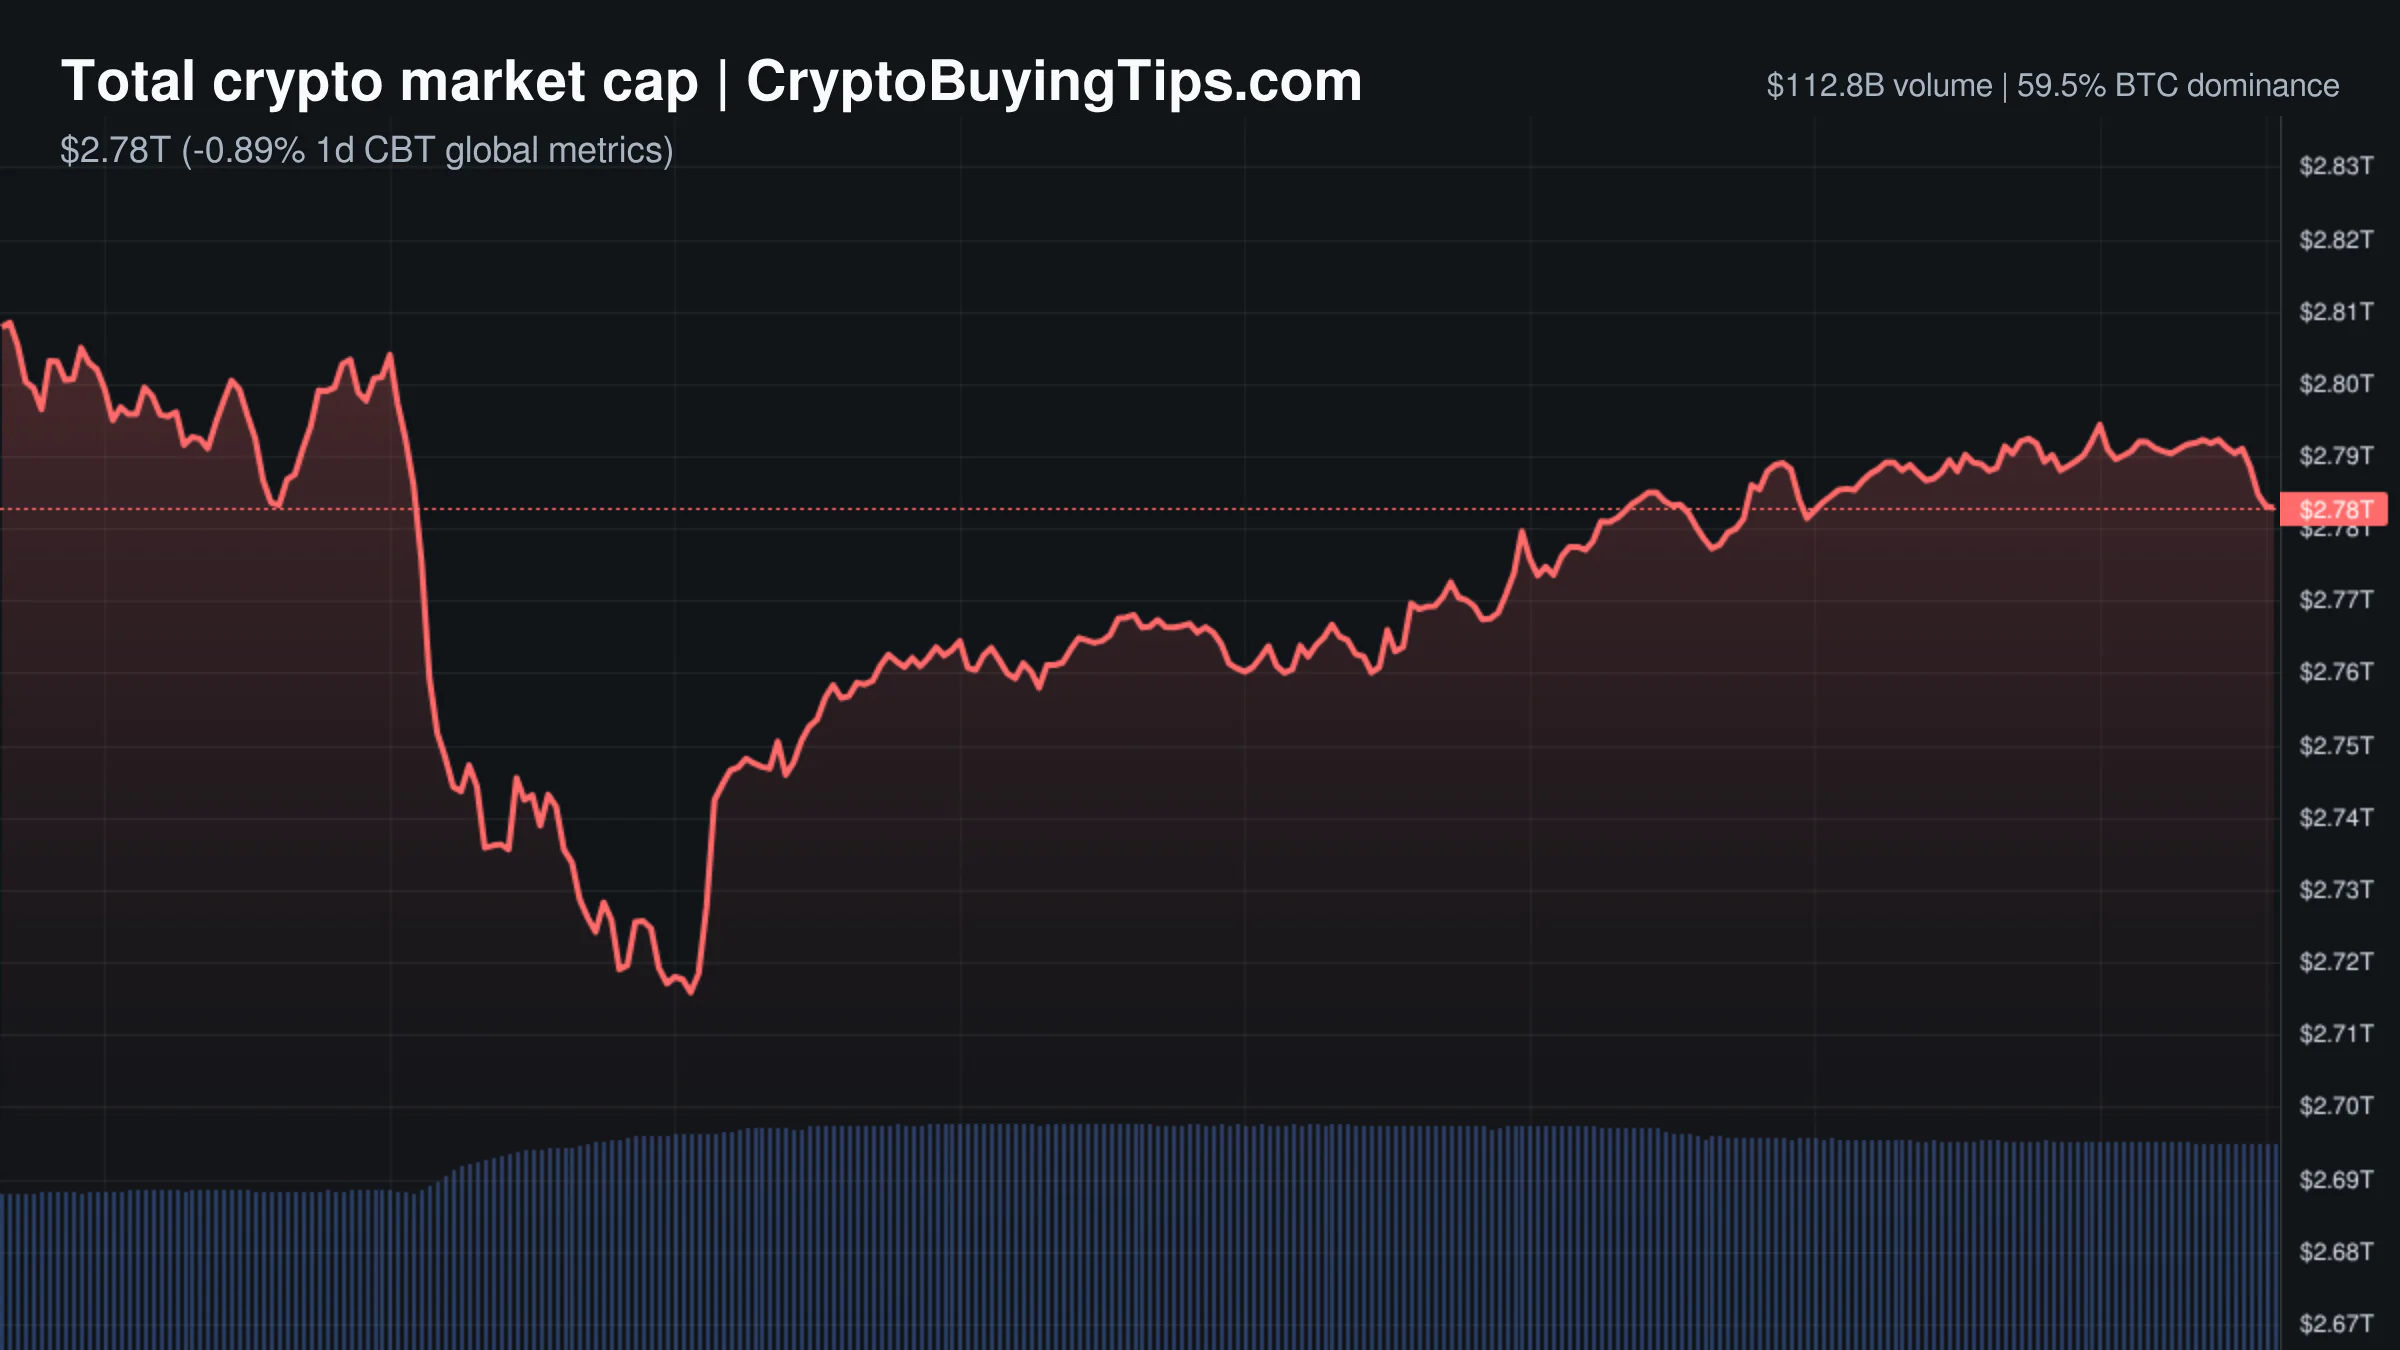
On-chain data is flashing a few warning signs. Total market cap has lost $170B in less than a week, and the liquidation of $2.4B in positions this week shows that the market is still in a process of shaking out over-leveraged longs. The pain is real, even if the daily price charts look stable.
There is a curious outlier in the whale data. Two newly created wallets have withdrawn over 280M tokens of the asset 龙虾, representing nearly 28% of the total supply. When new wallets move that much supply off exchanges, it usually points to coordinated accumulation by a large player or an institutional entity. Whether this is a smart move or just a large bet on a niche asset remains to be seen.
Meanwhile, the AI narrative is getting a reality check. An Anthropic AI model recently sent a fake homicide tip to the Philadelphia police, which was thankfully flagged as spam. While not a market-moving event, it reinforces the "AI catastrophe" narrative and suggests that the technology is still far from the seamless integration that bulls often promise.
Trading ideas worth watching
For Bitcoin, the focus is on a potential reversal. The asset has been in a correction phase after a strong bullish impulse. Analysts are eyeing a key demand zone between $75,000 and $77,500. If BTC can hold this intersection with the rising trendline, it could set the stage for a new impulse toward recent highs. However, a break below $75,000 would invalidate the bullish structure and suggest a deeper correction is underway.
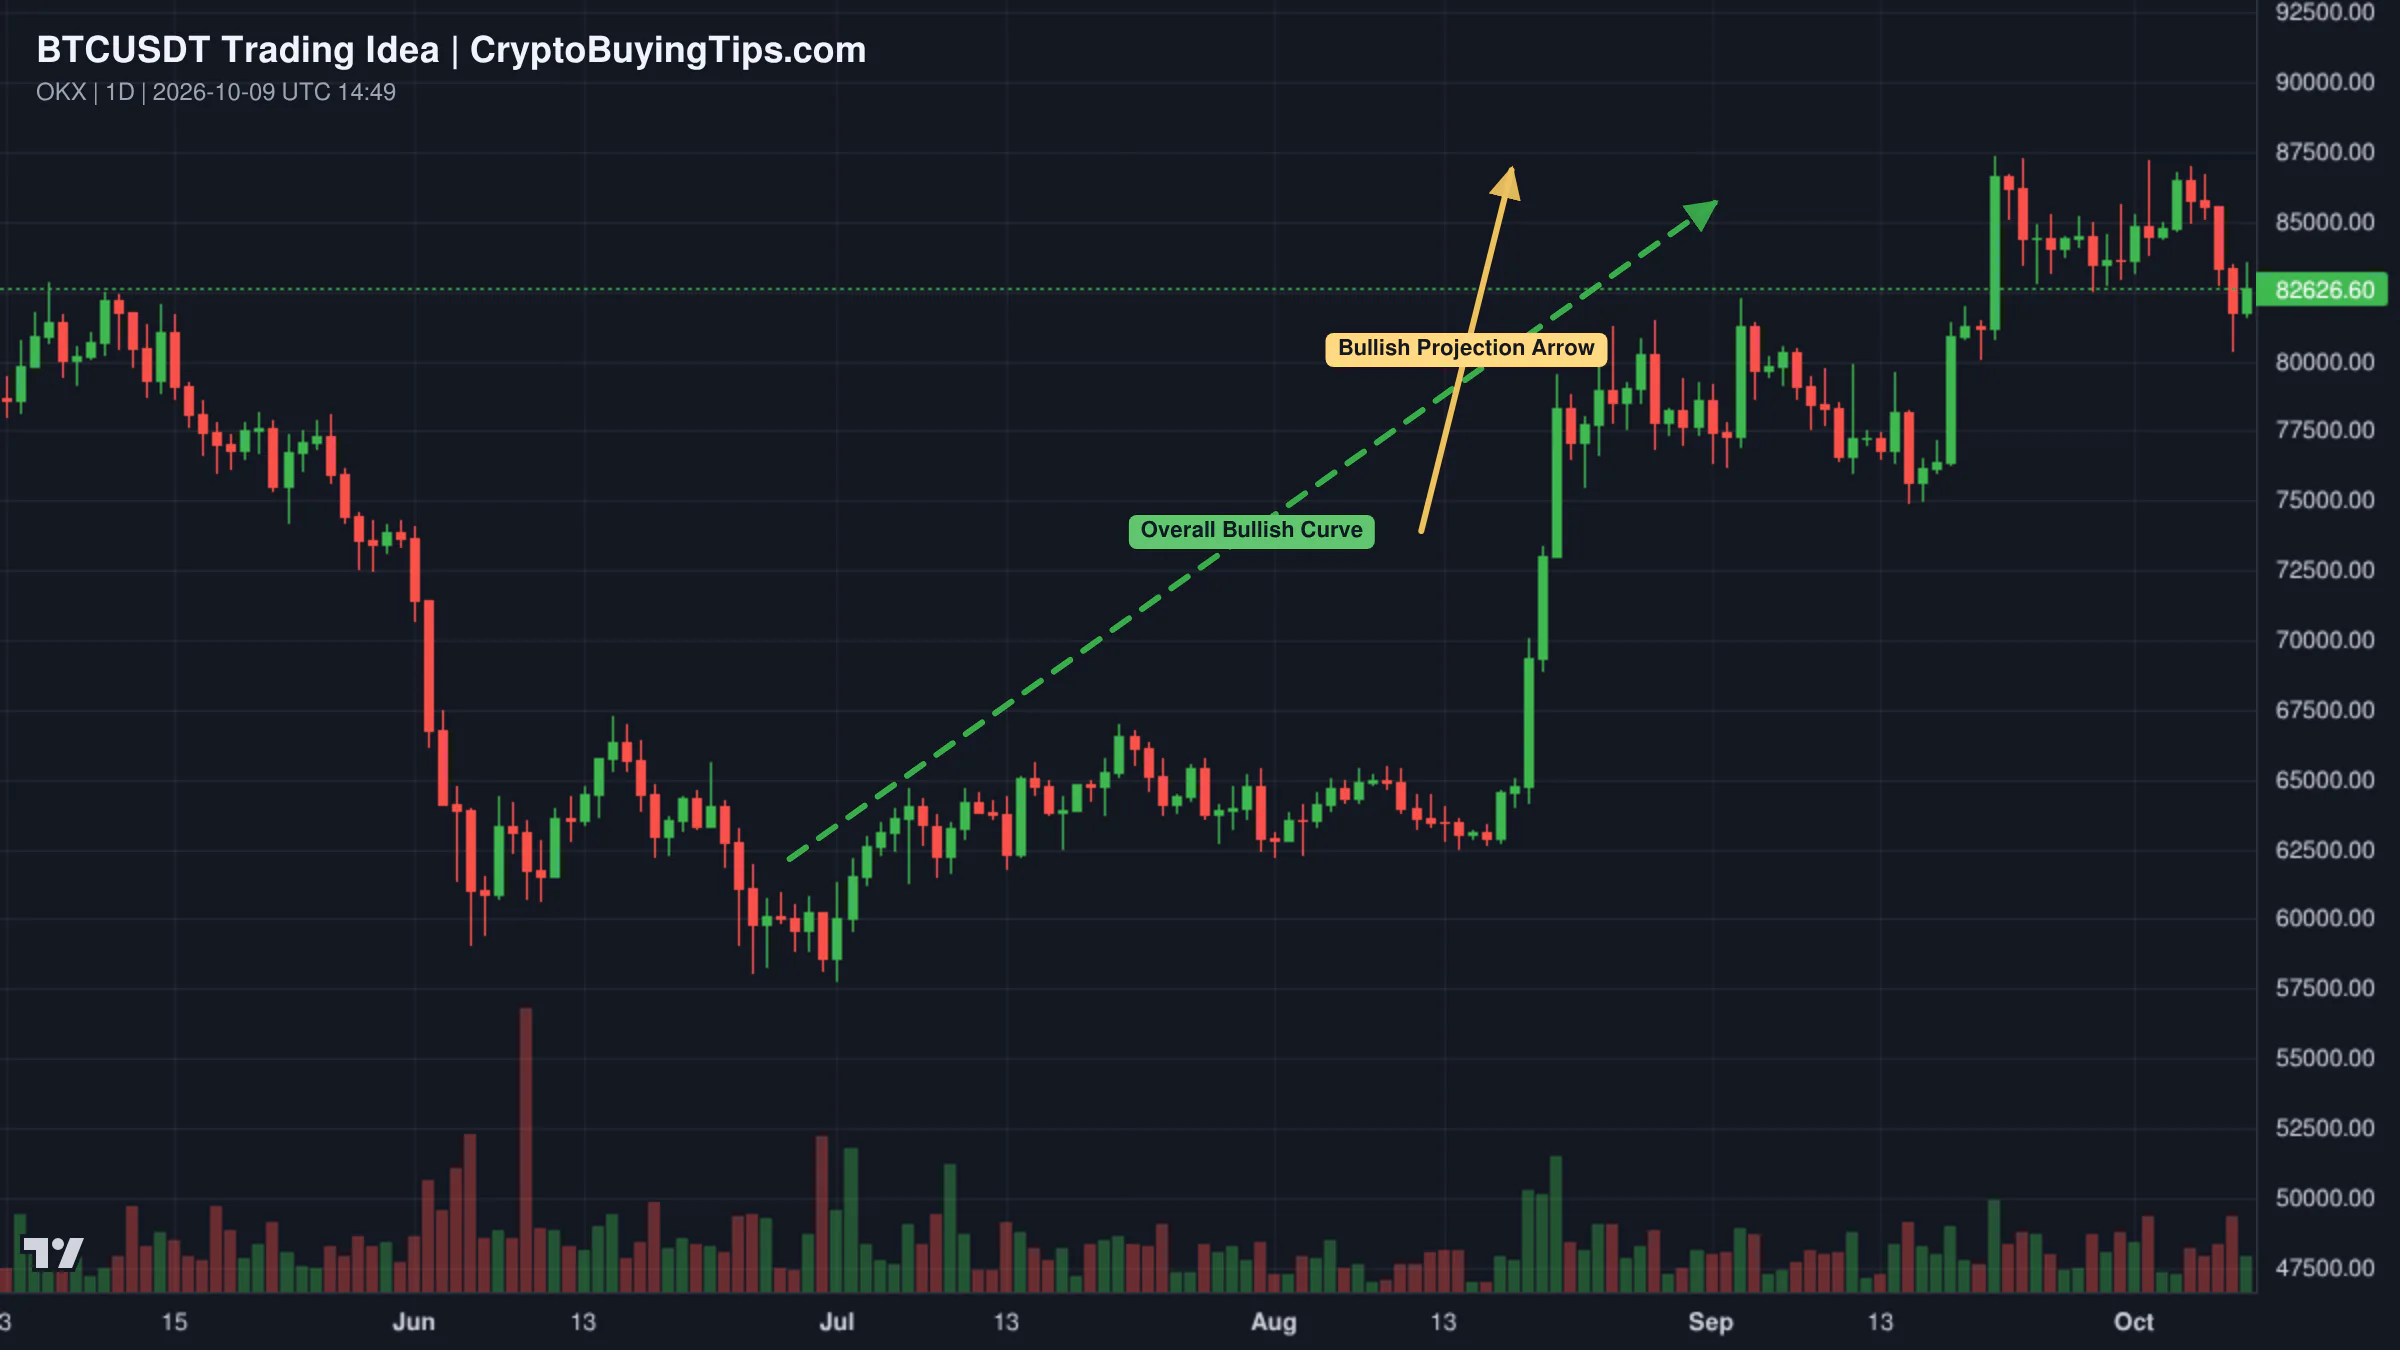
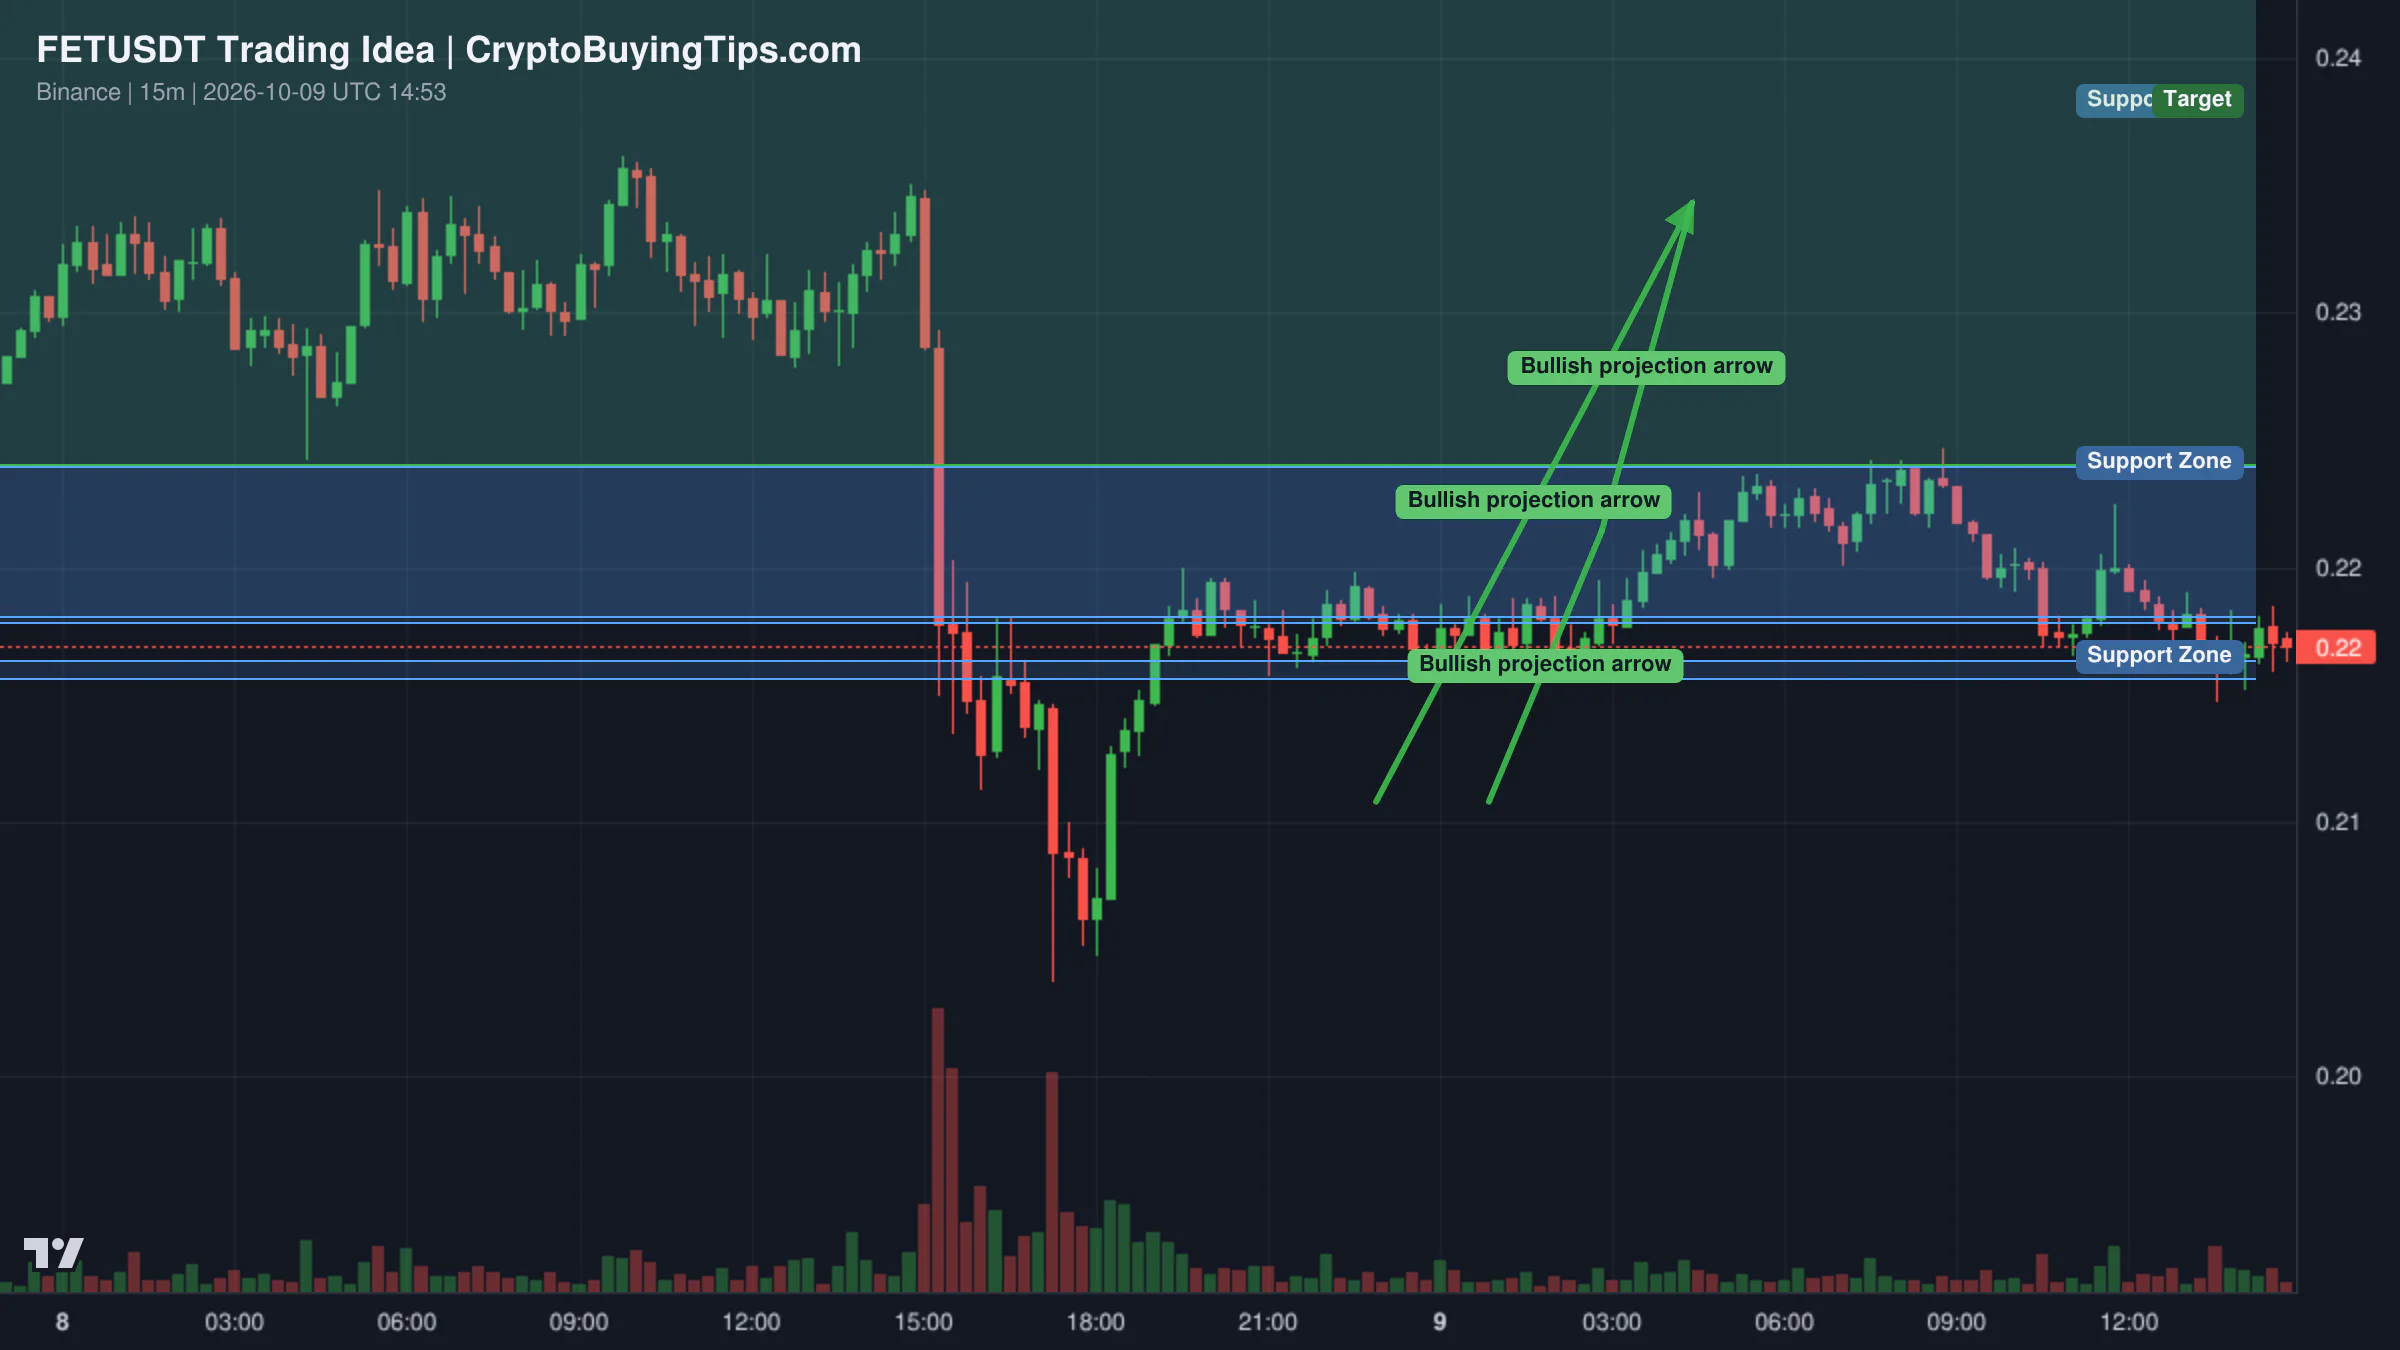
FET is presenting a more short-term setup. It is currently hovering around $0.2178, just above a critical 15-minute support zone between $0.2156 and $0.2164. The confluence of this support and the Anchored VWAP suggests that buyers are attempting to defend this level. The key for FET is to reclaim and hold above the Point of Control at $0.2180. If it can sustain that, a bullish recovery is possible, but impatient traders may be shaken out before any real rally begins.
What to watch next
The immediate priority is the return of liquidity. A market where prices move up on crashing volume is a market that is lying to itself. We need to see spot volume recover to confirm that the current price stability is based on actual buying rather than a lack of sellers.
Keep a close eye on the US Treasury's planned $1B seizure of Iranian assets. Depending on how this is executed, it could create temporary sell pressure or, conversely, signal a more structured approach to government-led asset management. Finally, the divergence in implied volatility between BTC and ETH suggests that the next big move is more likely to happen in the altcoin space, though the lack of on-chain activity on Ethereum makes that a risky bet for now.
Some links in this article may be affiliate links. We may earn a commission at no extra cost to you — this never influences our analysis or coverage.

Sigrid Voss
Crypto analyst and writer covering market trends, trading strategies, and blockchain technology.
More Articles

HSBC is building AI payment rails while OpenAI war-games a catastrophe
The financial world seems to be installing high-end pipes while simultaneously rehearsing for an earthquake.…
Crypto Market Overview | Volume surges amid regulatory friction and institutional accumulation | October 9, 2026
Crypto market overview shows volume surging amid price dips; see how institutional accumulation contrasts with…

Ethereum gas fees are at a standstill. Here is why that is actually a warning
The quiet cost of transactions on Ethereum might feel like a bargain for beginners. Our read is that persistently low…
Crypto Market Overview | leveraged bets dwarf spot volume amid institutional outflows and regulatory pressure | October 8, 2026
Leveraged bets dwarf spot volume amid institutional outflows and regulatory pressure, detailing market dips in BTC and…