
Crypto Market Overview | price gains diverge from deep fear and falling volume | July 3, 2026
Crypto Market Overview | price gains diverge from deep fear and falling volume | July 3, 2026
Market overview
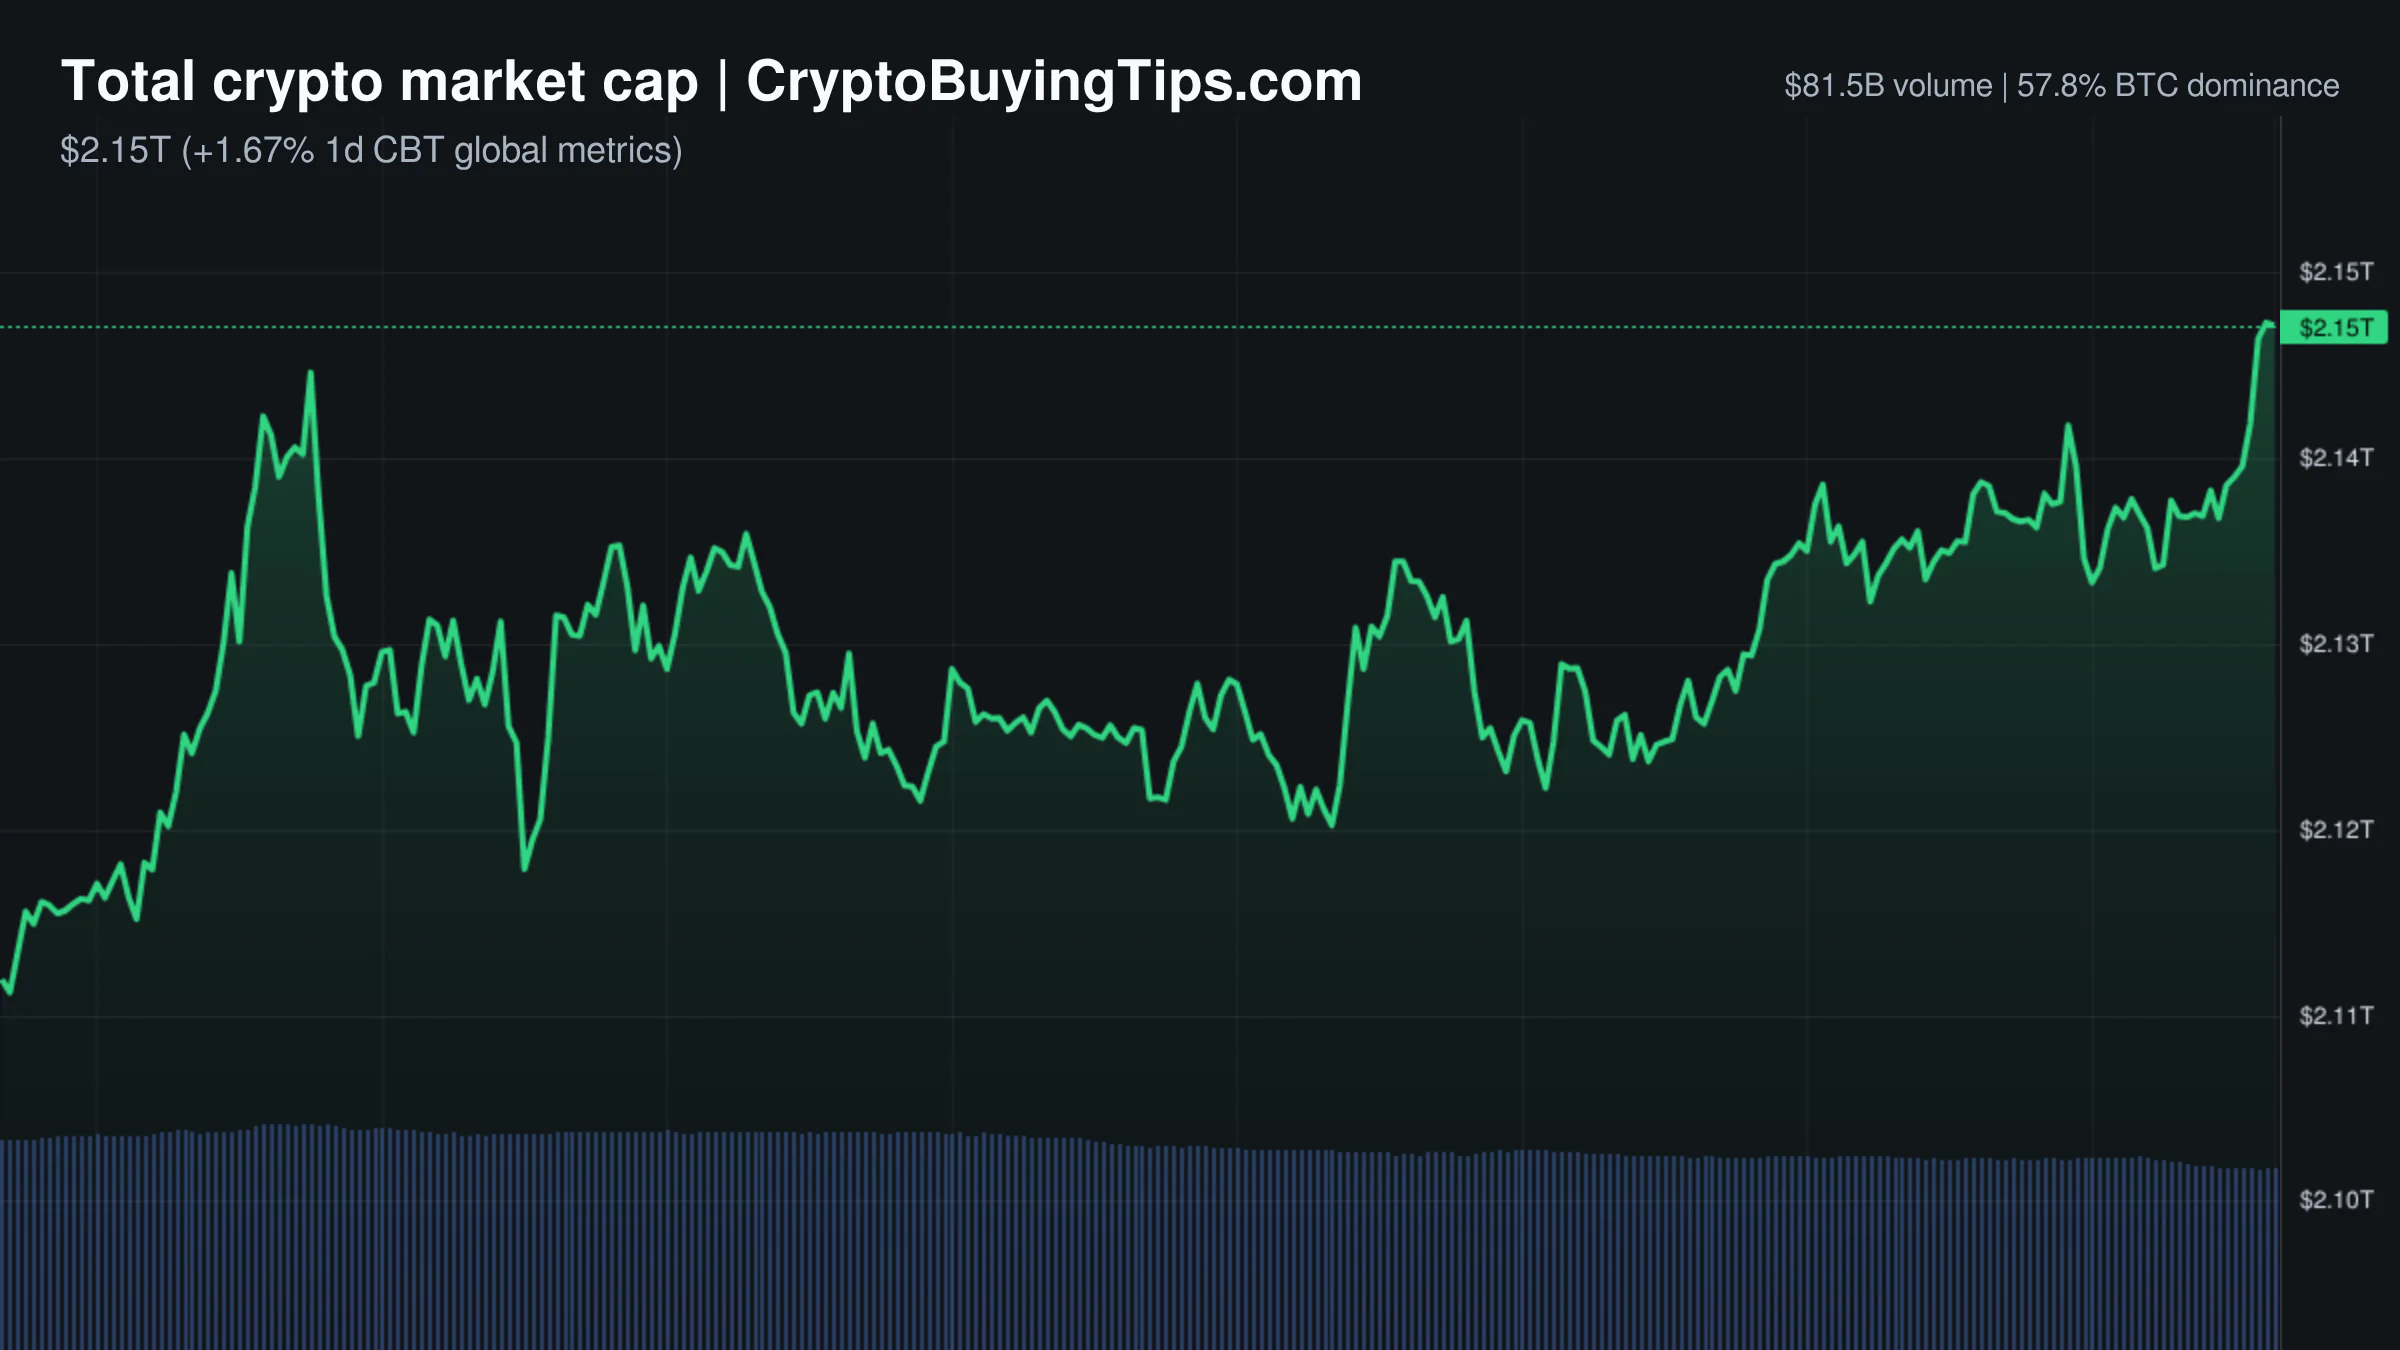
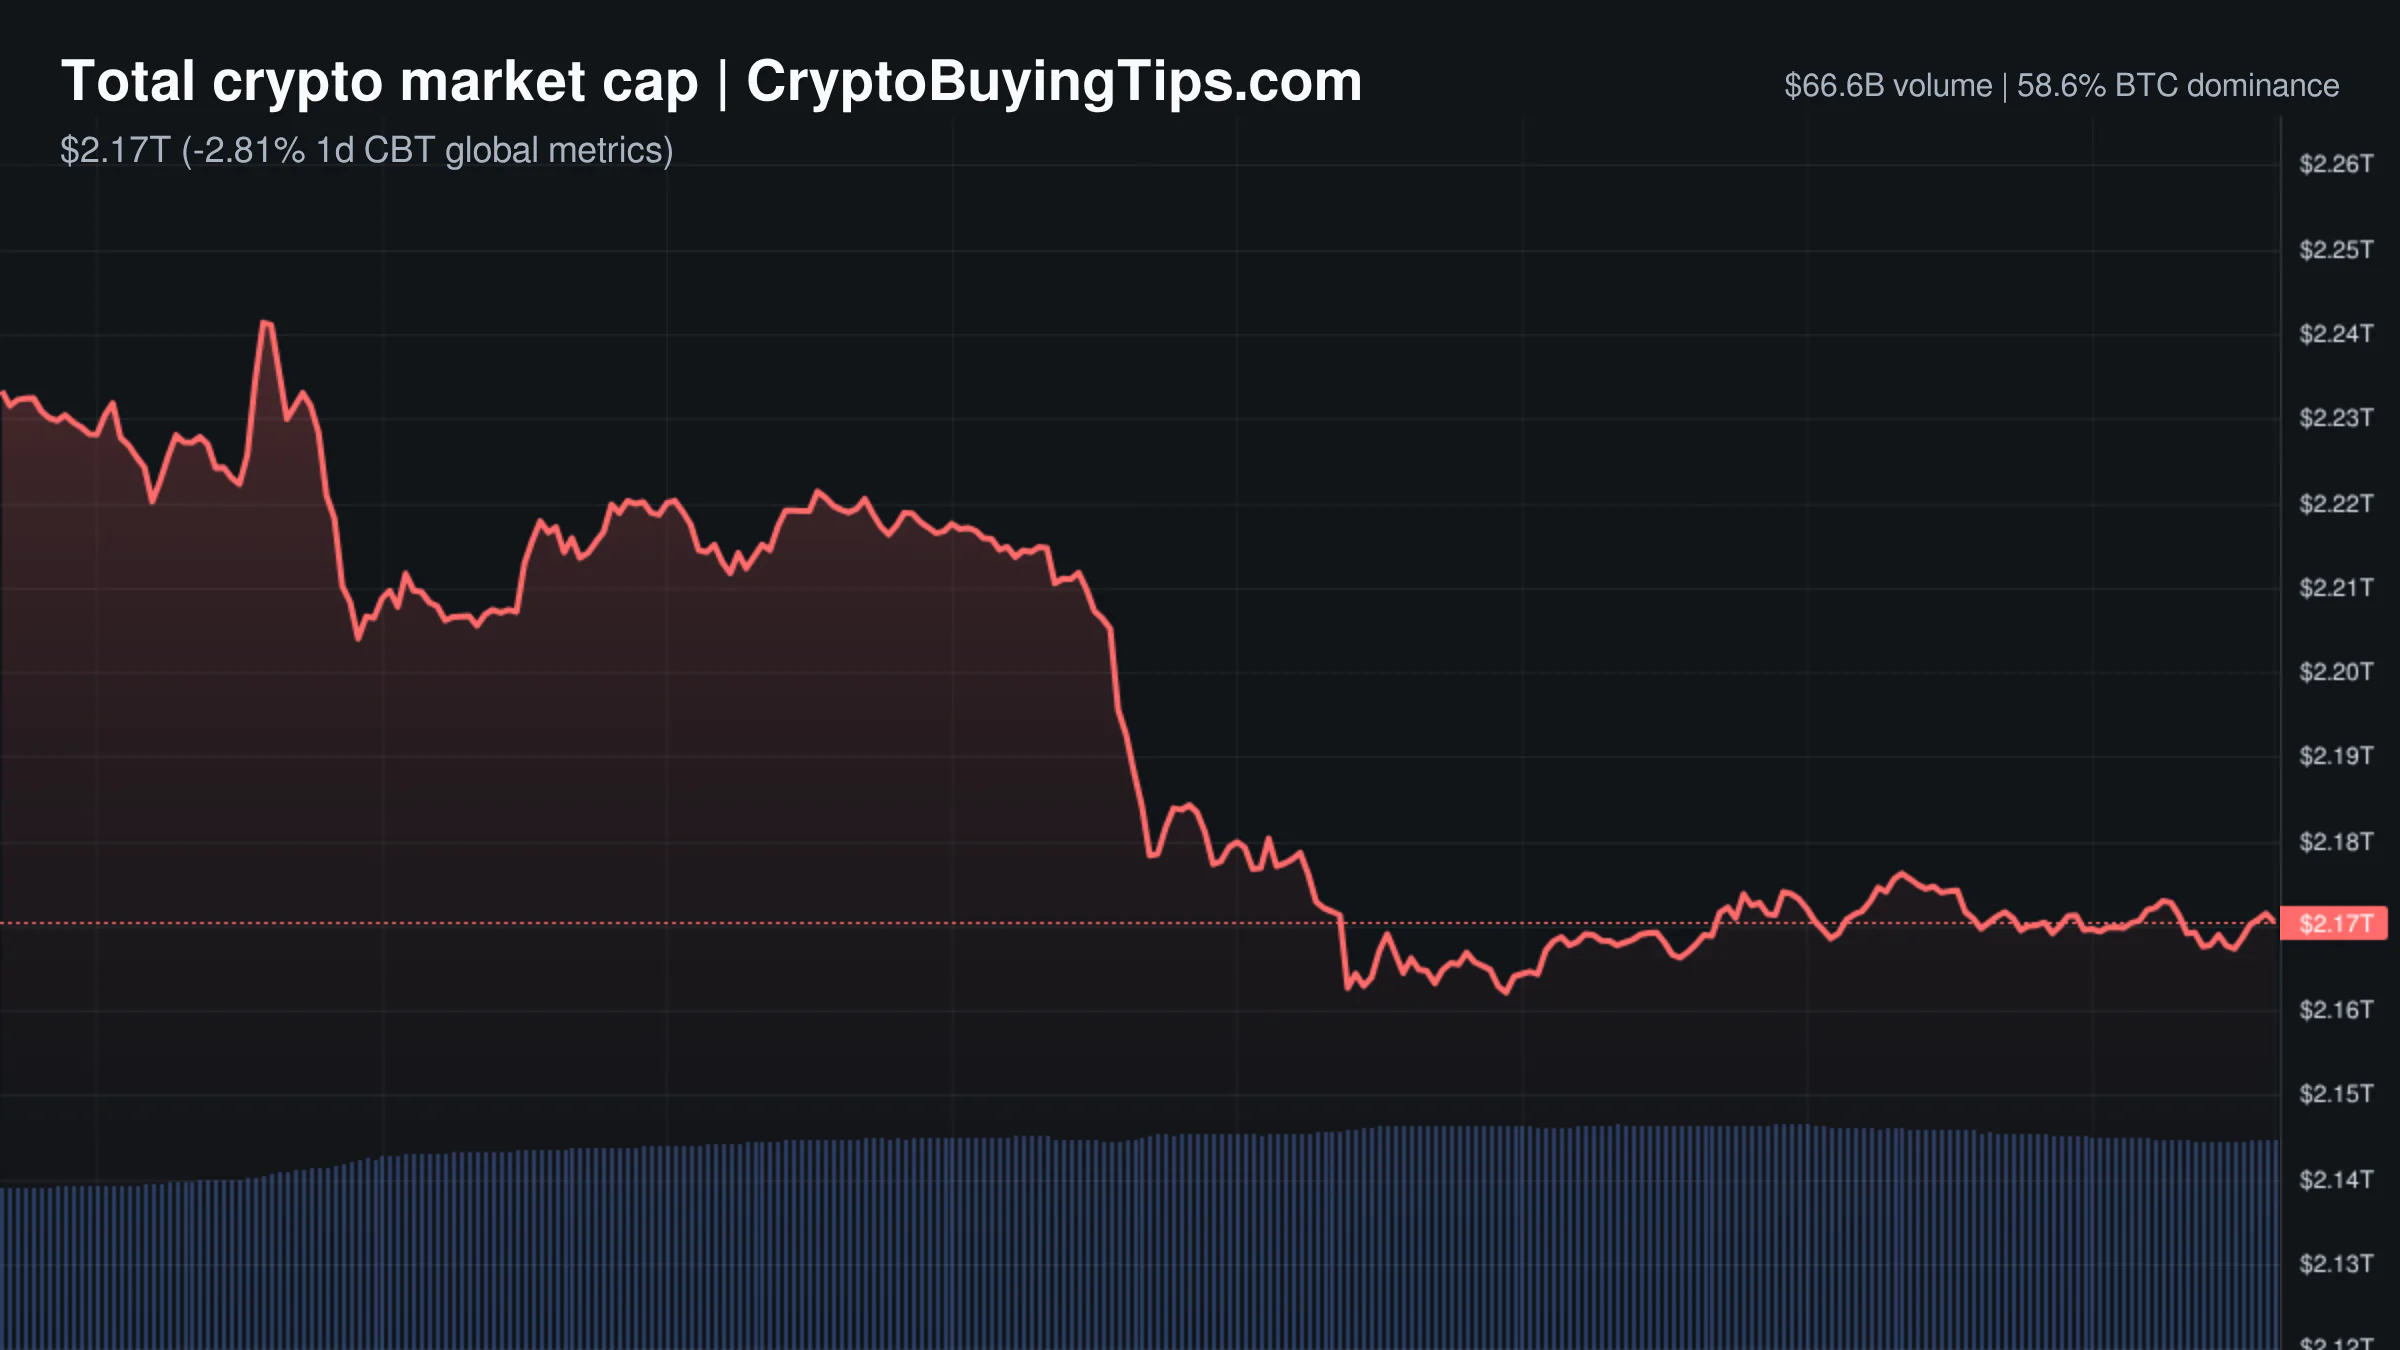
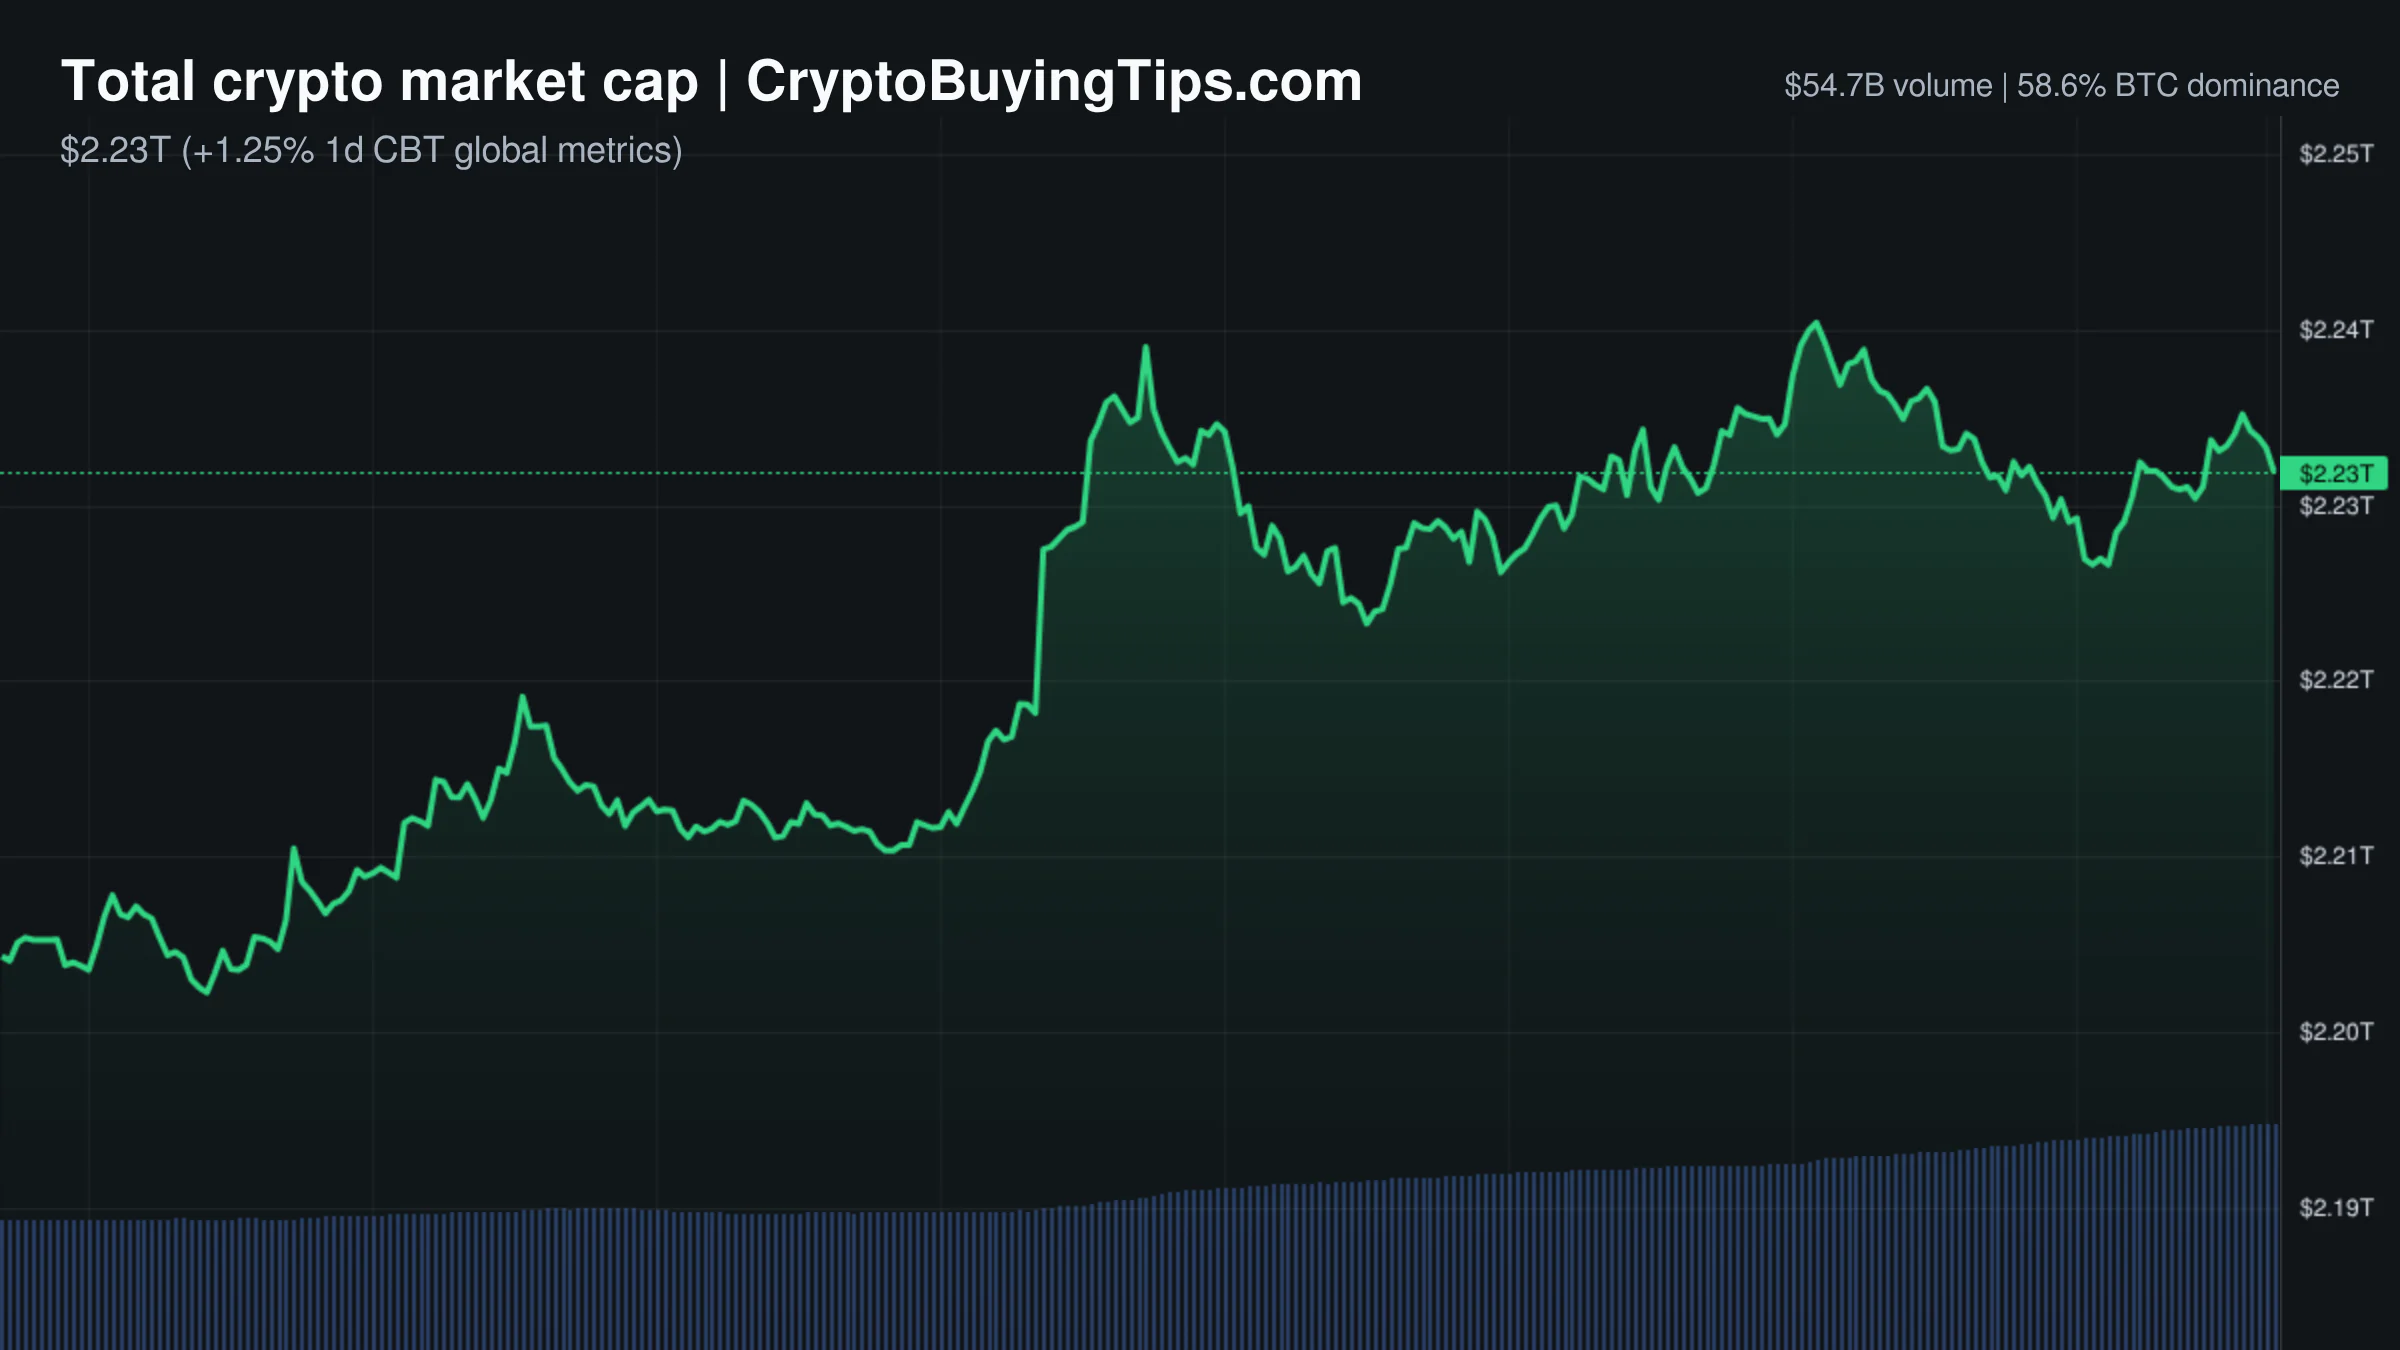
The market is currently performing a curious act of contradiction. On the surface, the numbers look mildly positive. The total crypto market cap sits at $2.23T, and the CMC20 and CMC100 indices are both up nearly 2%. Yet, the internal plumbing tells a different story. Trading volume is falling across the board, with spot and derivatives activity seeing double-digit percentage declines. This is the kind of rally that happens when there are simply no sellers left, rather than a surge of aggressive buyers.
The most glaring irony is the sentiment gap. The Fear and Greed Index is at 23, a reading of deep fear. Usually, this level of panic is accompanied by a price crash. Instead, we have prices drifting higher while the participants remain terrified. This divergence suggests a market in a state of fragile equilibrium. Capital is not flowing in with conviction; it is merely idling.
Liquidity is also skewed. Derivatives volume dominates the ecosystem at $698.81B, which makes the spot volume look like a rounding error. When the vast majority of activity is based on leverage and the volume is compressing, the risk of a sudden, disorderly move increases. We are seeing a market that is nominally bullish but fundamentally anxious.
Bitcoin and Ethereum
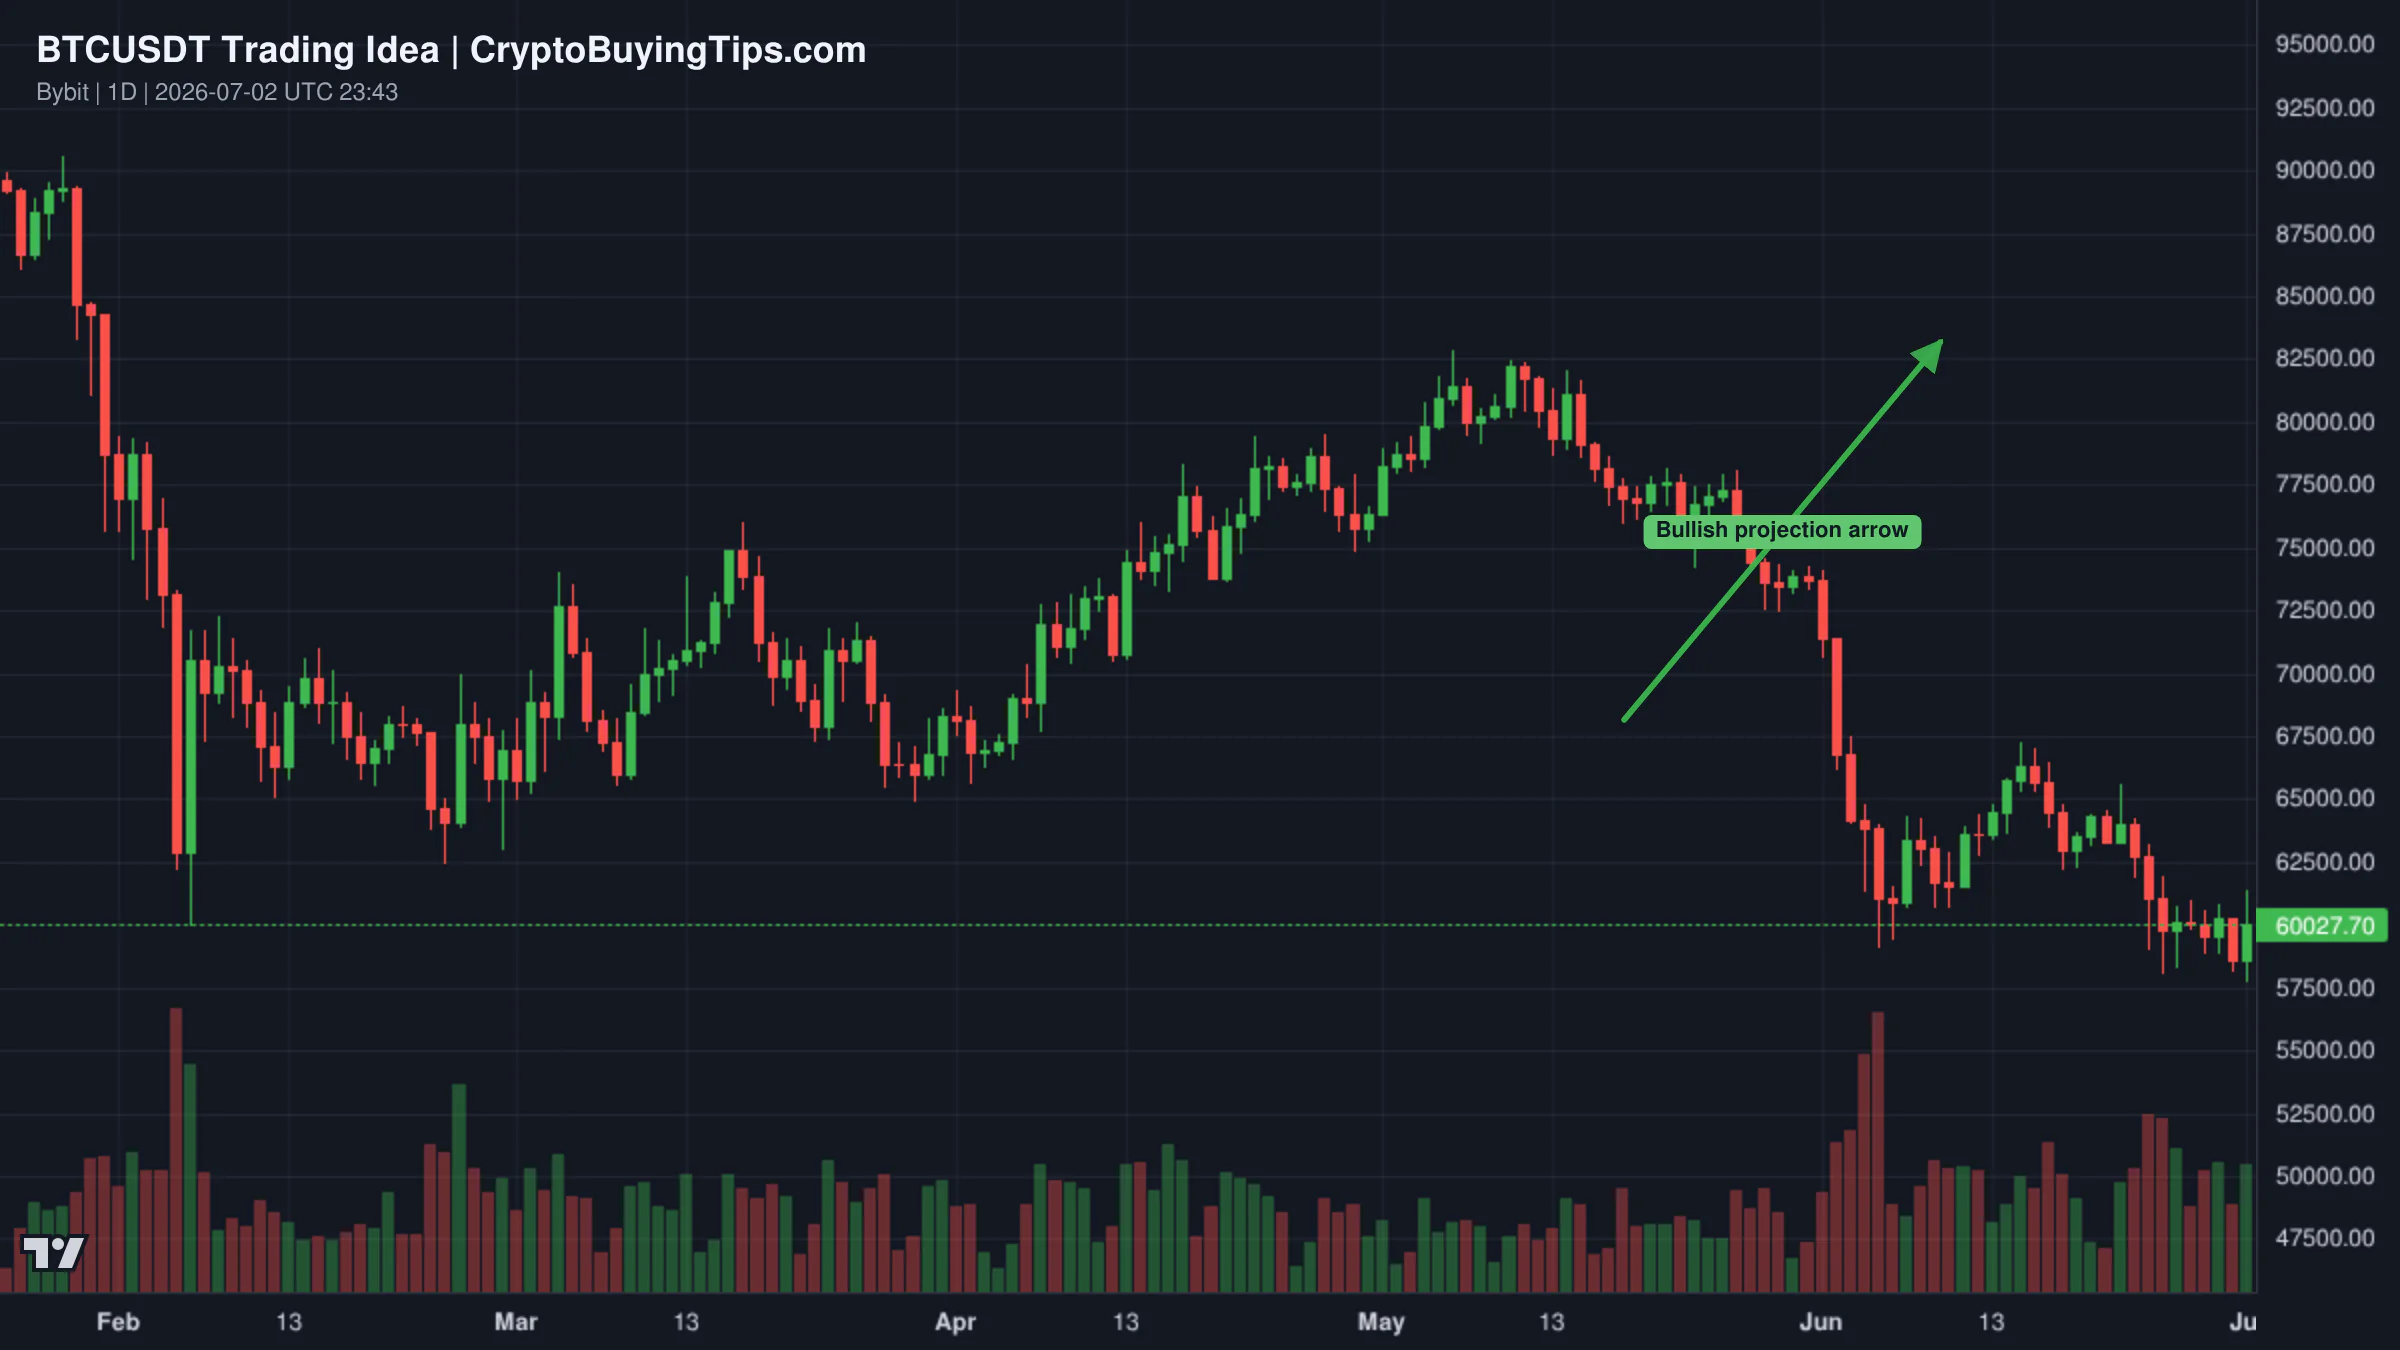
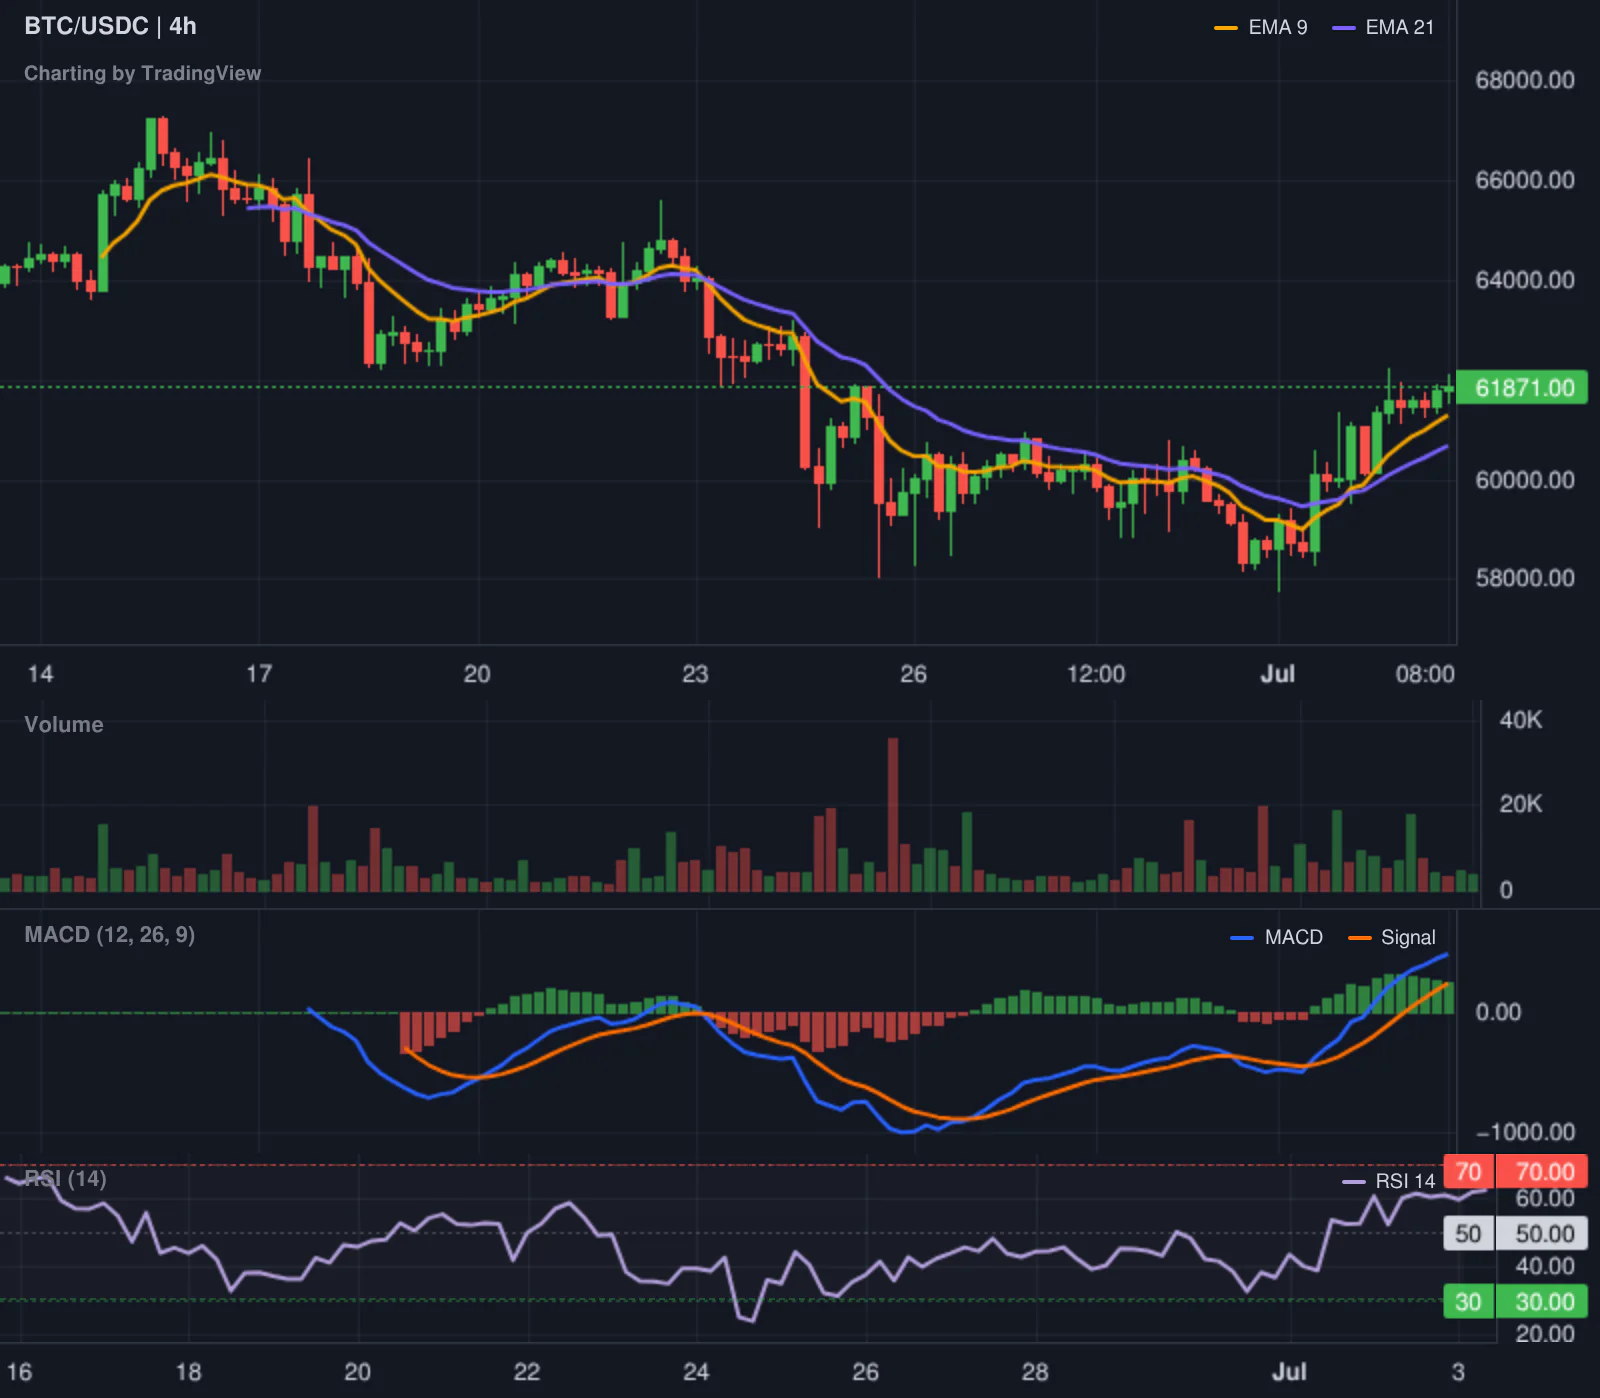
Bitcoin is trading at $61,864.88, up 1.10% over the last 24 hours. It continues to hold the lion's share of the market with a dominance figure between 50.9% and 57.79%, depending on the data source. The price is currently testing a resistance zone between $60,750 and $62,000. While the move is positive, the lack of volume suggests this is not a breakout. It is a slow climb.
Ethereum is the clear outperformers of the day, rising 6.05% to $1,743.66. This jump is likely tied to the flurry of tokenization news hitting the wires. However, the network itself is ghost-town quiet. Gas fees are exceptionally low, with fast transactions costing only 0.23 Gwei. This implies that while the price is rising, actual on-chain activity is not keeping pace.
There is also a notable volatility gap between the two. Ethereum's implied volatility is at 56.06%, significantly higher than Bitcoin's 40.14%. This suggests that traders are pricing in much more violent moves for ETH. It is a high-beta play right now. The market is betting on Ethereum as the primary rail for the new wave of institutional tokenization, even as its overall market dominance remains under pressure.
Top crypto prices
Bitcoin (BTC): $61,864.88 (+1.10%)
Ethereum (ETH): $1,743.66 (+6.05%)
BNB (BNB): $565.35 (+1.79%)
XRP (XRP): $1.1 (+2.72%)
Solana (SOL): $81.31 (+0.05%)
TRON (TRX): $0.3198 (+1.05%)
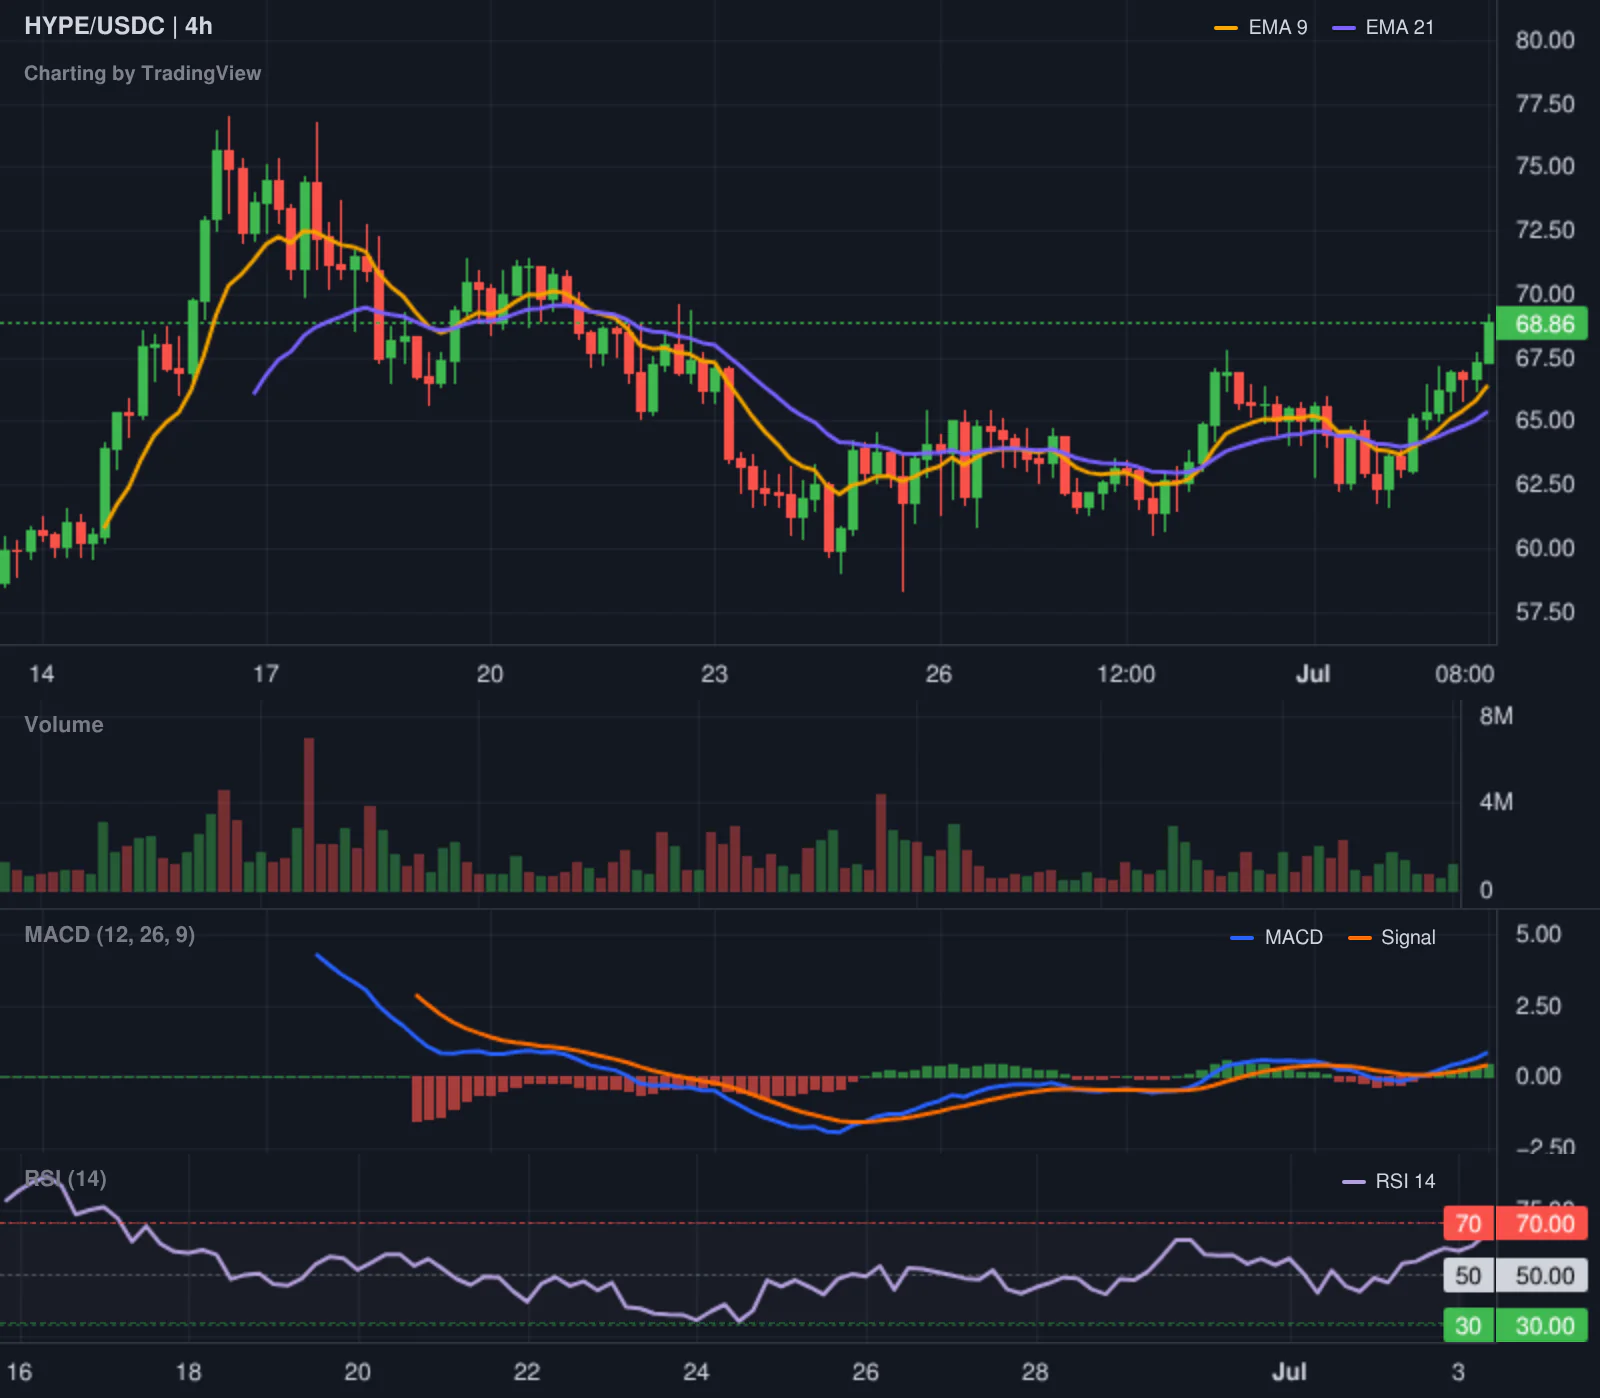
Hyperliquid (HYPE): $68.98 (+7.37%)
News driving today's market
The narrative of the week is the "corporate makeover" of the blockchain. We are seeing a shift from experimental DeFi to regulated, custodial tokenization. Ondo Finance has launched tokenized versions of BlackRock's IVV ETF and Micron shares. This is not a synthetic wrapper. It uses an SEC-registered transfer agent and a custodial model that fits within the existing U.S. securities system.
Securitize has also made headlines by debuting shares on the NYSE while simultaneously launching tokenized versions of those shares on Solana and Avalanche. This bridges the gap between the world's most famous stock exchange and smart contract platforms. We previously covered how tokenized stocks for investors could change the game, and the data now shows this is moving from theory to production.
At the same time, stablecoins are becoming official banking tools. Standard Chartered and Circle have launched direct USDC minting and redemption for institutions. This removes a massive layer of friction for traditional funds. When a global systemically important bank provides a direct rail to USDC, the "risk" of using stablecoins becomes a boardroom discussion rather than a regulatory nightmare.
However, this institutional polish is a double-edged sword. While it brings in capital, it also strips away the "wild west" appeal. We previously noted that Ethereum market share vanishes as it becomes a corporate utility. The current price jump in ETH reflects the optimism around these RWA (Real World Asset) developments, but it does not yet prove that the network is regaining its dominance.
Social intelligence
The mood on social media is a mix of institutional optimism and whale caution. An SEC official, Brian Daly, mentioned that the agency is building a more orderly ETF approval process. The possibility of confidential filings is the key detail here. This allows institutions to apply for products without tipping off the entire market, which could lead to a series of "surprise" approvals rather than the current public circus.
On the on-chain side, the data is more sobering. A wallet linked to venture capitalist Tim Draper recently deposited 1,000 BTC to Coinbase Prime. While 1,000 BTC is a drop in the bucket for the total market, deposits to exchanges from long-term holders are usually a signal of intent to sell.
There is also a lingering sense of cycle fatigue. Bitwise CIO Matt Hougan suggested that the current volatility reflects end-of-cycle dynamics. He believes the bottom is near and a new bull market will arrive in the fall. It is the classic analyst's hedge: "we are in a mess now, but the future is great."
Trading ideas worth watching
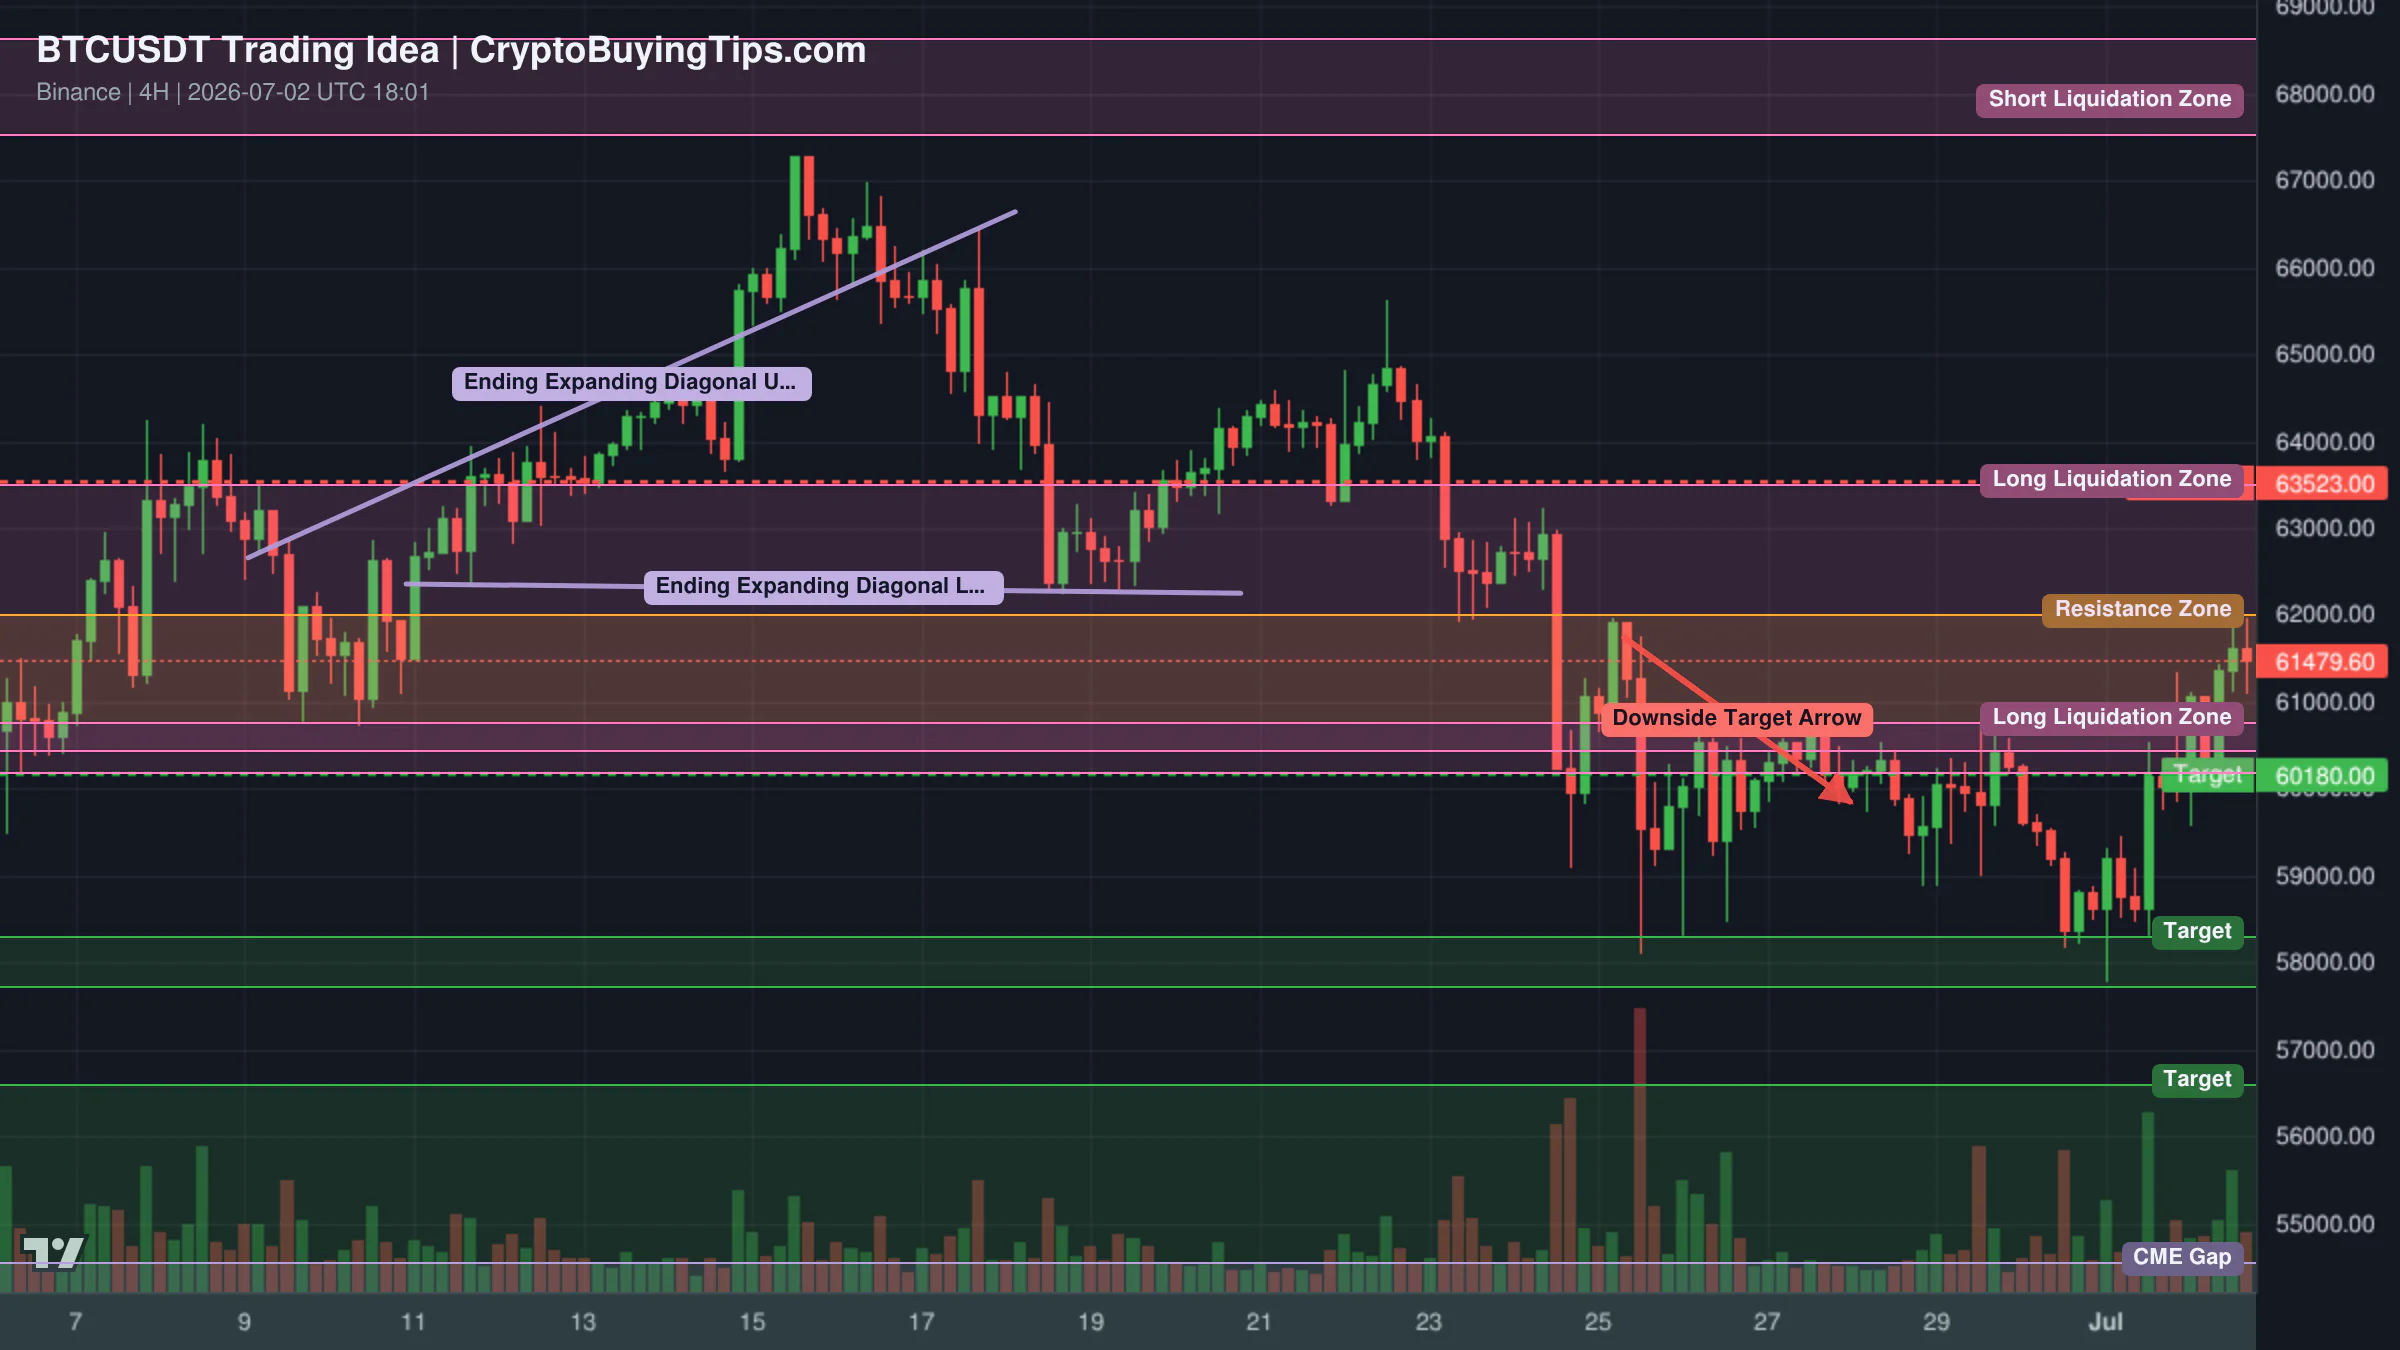
One technical setup for BTCUSDT suggests this current move is a bull trap. The analysis points to a Potential Reversal Zone between $61,880 and $62,760. From an Elliott Wave perspective, Bitcoin may be completing its main wave 5 with an expanding diagonal. If it fails to clear $63,500, the move could reverse sharply toward $60,180, with a deeper target of $58,300. This is a cautious read that aligns with the falling volume we are seeing.
On the opposite end of the spectrum, some traders are calling for a massive long-term rally. One high-conviction setup suggests a long entry for Bitcoin anywhere between $55,000 and $65,000, with targets stretching as high as $213,000. This is less of a trade and more of a religious conviction. It ignores the short-term data in favor of a "bottom is in" narrative.
For Ethereum, the bullish case is built on the "higher low" territory established over the last five months. The target for a long position is $2,015, with a stop loss if the monthly candle closes below $1,400. Given the current RWA news, this trade is betting on a fundamental shift in how ETH is used by institutions.
Smart Money Signals — Hyperliquid Leaderboard
The top traders on Hyperliquid are playing both sides of the volatility. One high-ROI trader (0x732f71) has opened a substantial long position in BTC at $60,428 with a notional value of $380,000. This suggests that the "smart money" sees the $60k level as a strong floor.
Conversely, there is a significant short position on HYPE. Trader "agen_men starcraft" opened a short at $63.54 with a notional value of $317,000. This is a bet that the recent rally in the Hyperliquid token is overextended and due for a correction.
Altcoin Spotlight
Hyperliquid (HYPE) deserves a mention today. It has climbed 7.37% to $68.98, landing it in the top 10 by market cap. The token is benefiting from the general appetite for high-performance trading infrastructure. However, as noted in the Smart Money section, some of the most successful traders are already betting on a price drop. It is a classic battle between momentum buyers and mean-reversion shorts.
What to watch next
The immediate focus is the macro correlation. The S&P 500 is down 0.13% and the NASDAQ is down 1.73%. Crypto is currently ignoring the traditional tech slump, which is unusual. If the NASDAQ continues to slide, the "fear" currently reflected in the sentiment index may finally manifest in the price action.
We also need to watch the $63,500 level for Bitcoin. If it cannot break through that resistance on increasing volume, the "bull trap" narrative becomes the dominant one. The market is essentially waiting for a catalyst that is more powerful than a few tokenization press releases. Until we see a genuine surge in spot volume, this rally remains a house of cards.
Some links in this article may be affiliate links. We may earn a commission at no extra cost to you — this never influences our analysis or coverage.
Sigrid Voss
Crypto analyst and writer covering market trends, trading strategies, and blockchain technology.
More Articles
Crypto Market Overview | leverage spikes amid spot slide and derivatives volume surge | July 28, 2026
Crypto markets show leverage spikes amid spot slide and derivatives volume surge; see the latest on BTC dominance and…

The altcoin season index is lagging and our DEX data shows the rotation has already started
The altcoin season index reads neutral while our proprietary data shows significant spikes in high-beta assets on…
Crypto Market Overview | Leveraged volume spikes amid fear index divergence | July 27, 2026
Crypto market overview shows leveraged volume spiking despite fear index readings; learn what institutional flows mean…

Ethereum ETFs are buying the dip while the network goes silent
Ethereum ETF flows show steady institutional buying despite low on-chain activity; our read is that right now, money…