
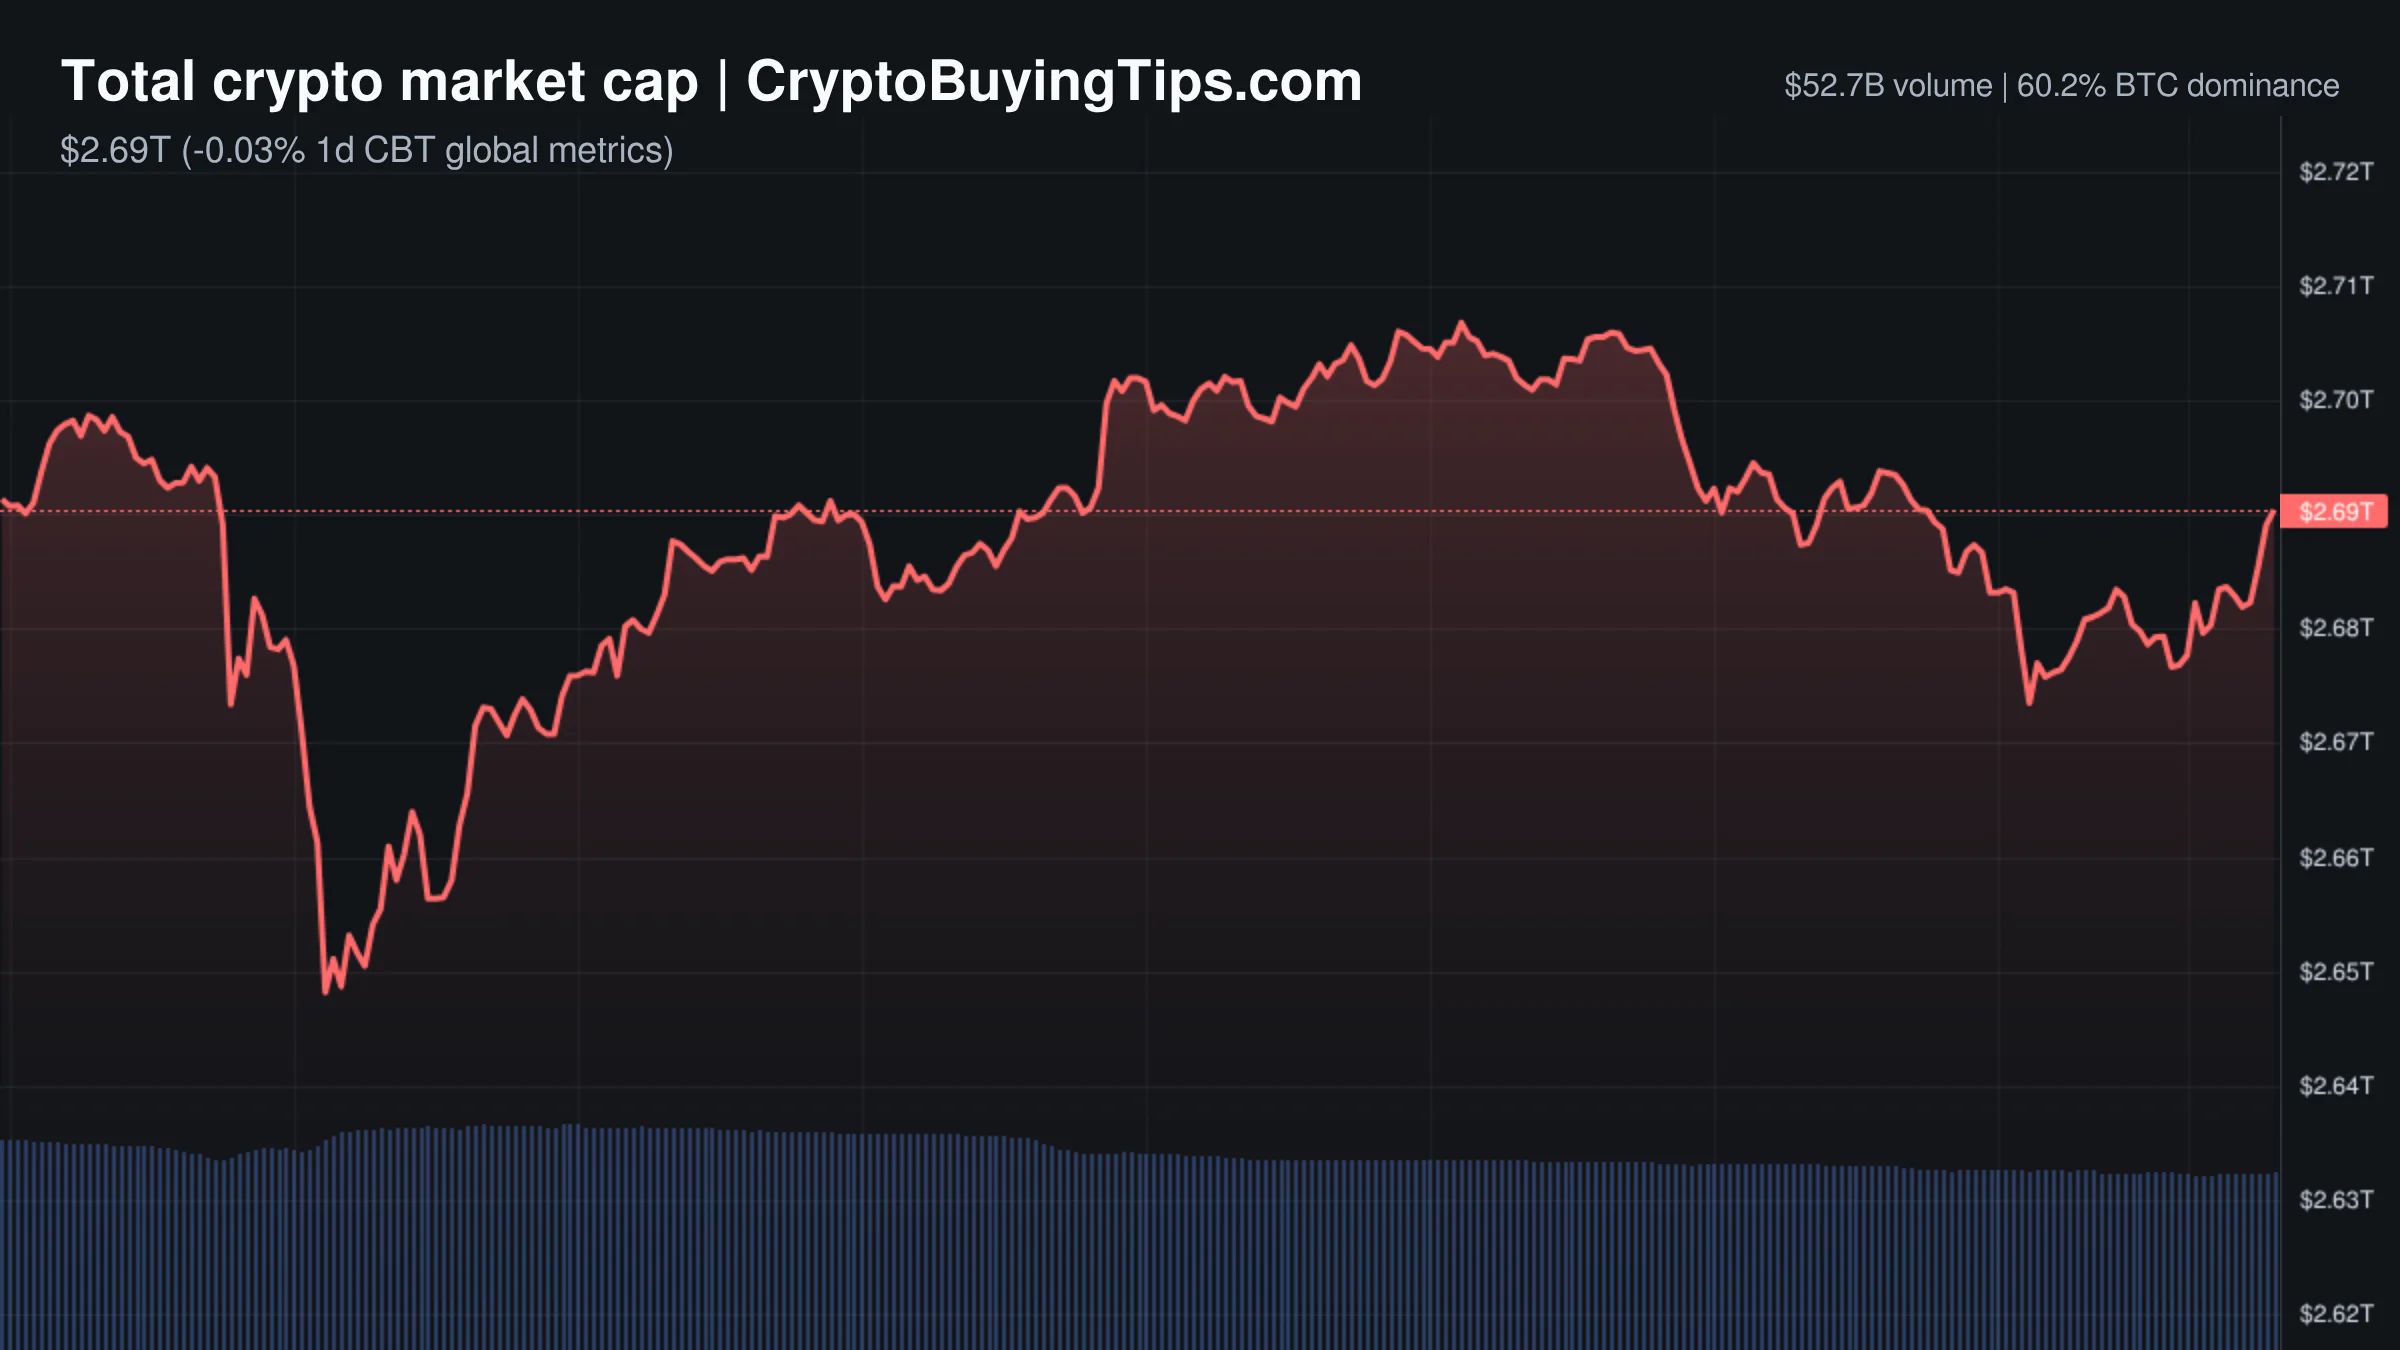
Crypto Market Overview | volume collapses as bitcoin holds $80k amid mixed institutional signals | October 25, 2026
Crypto Market Overview | volume collapses as bitcoin holds $80k amid mixed institutional signals | October 25, 2026
Market overview
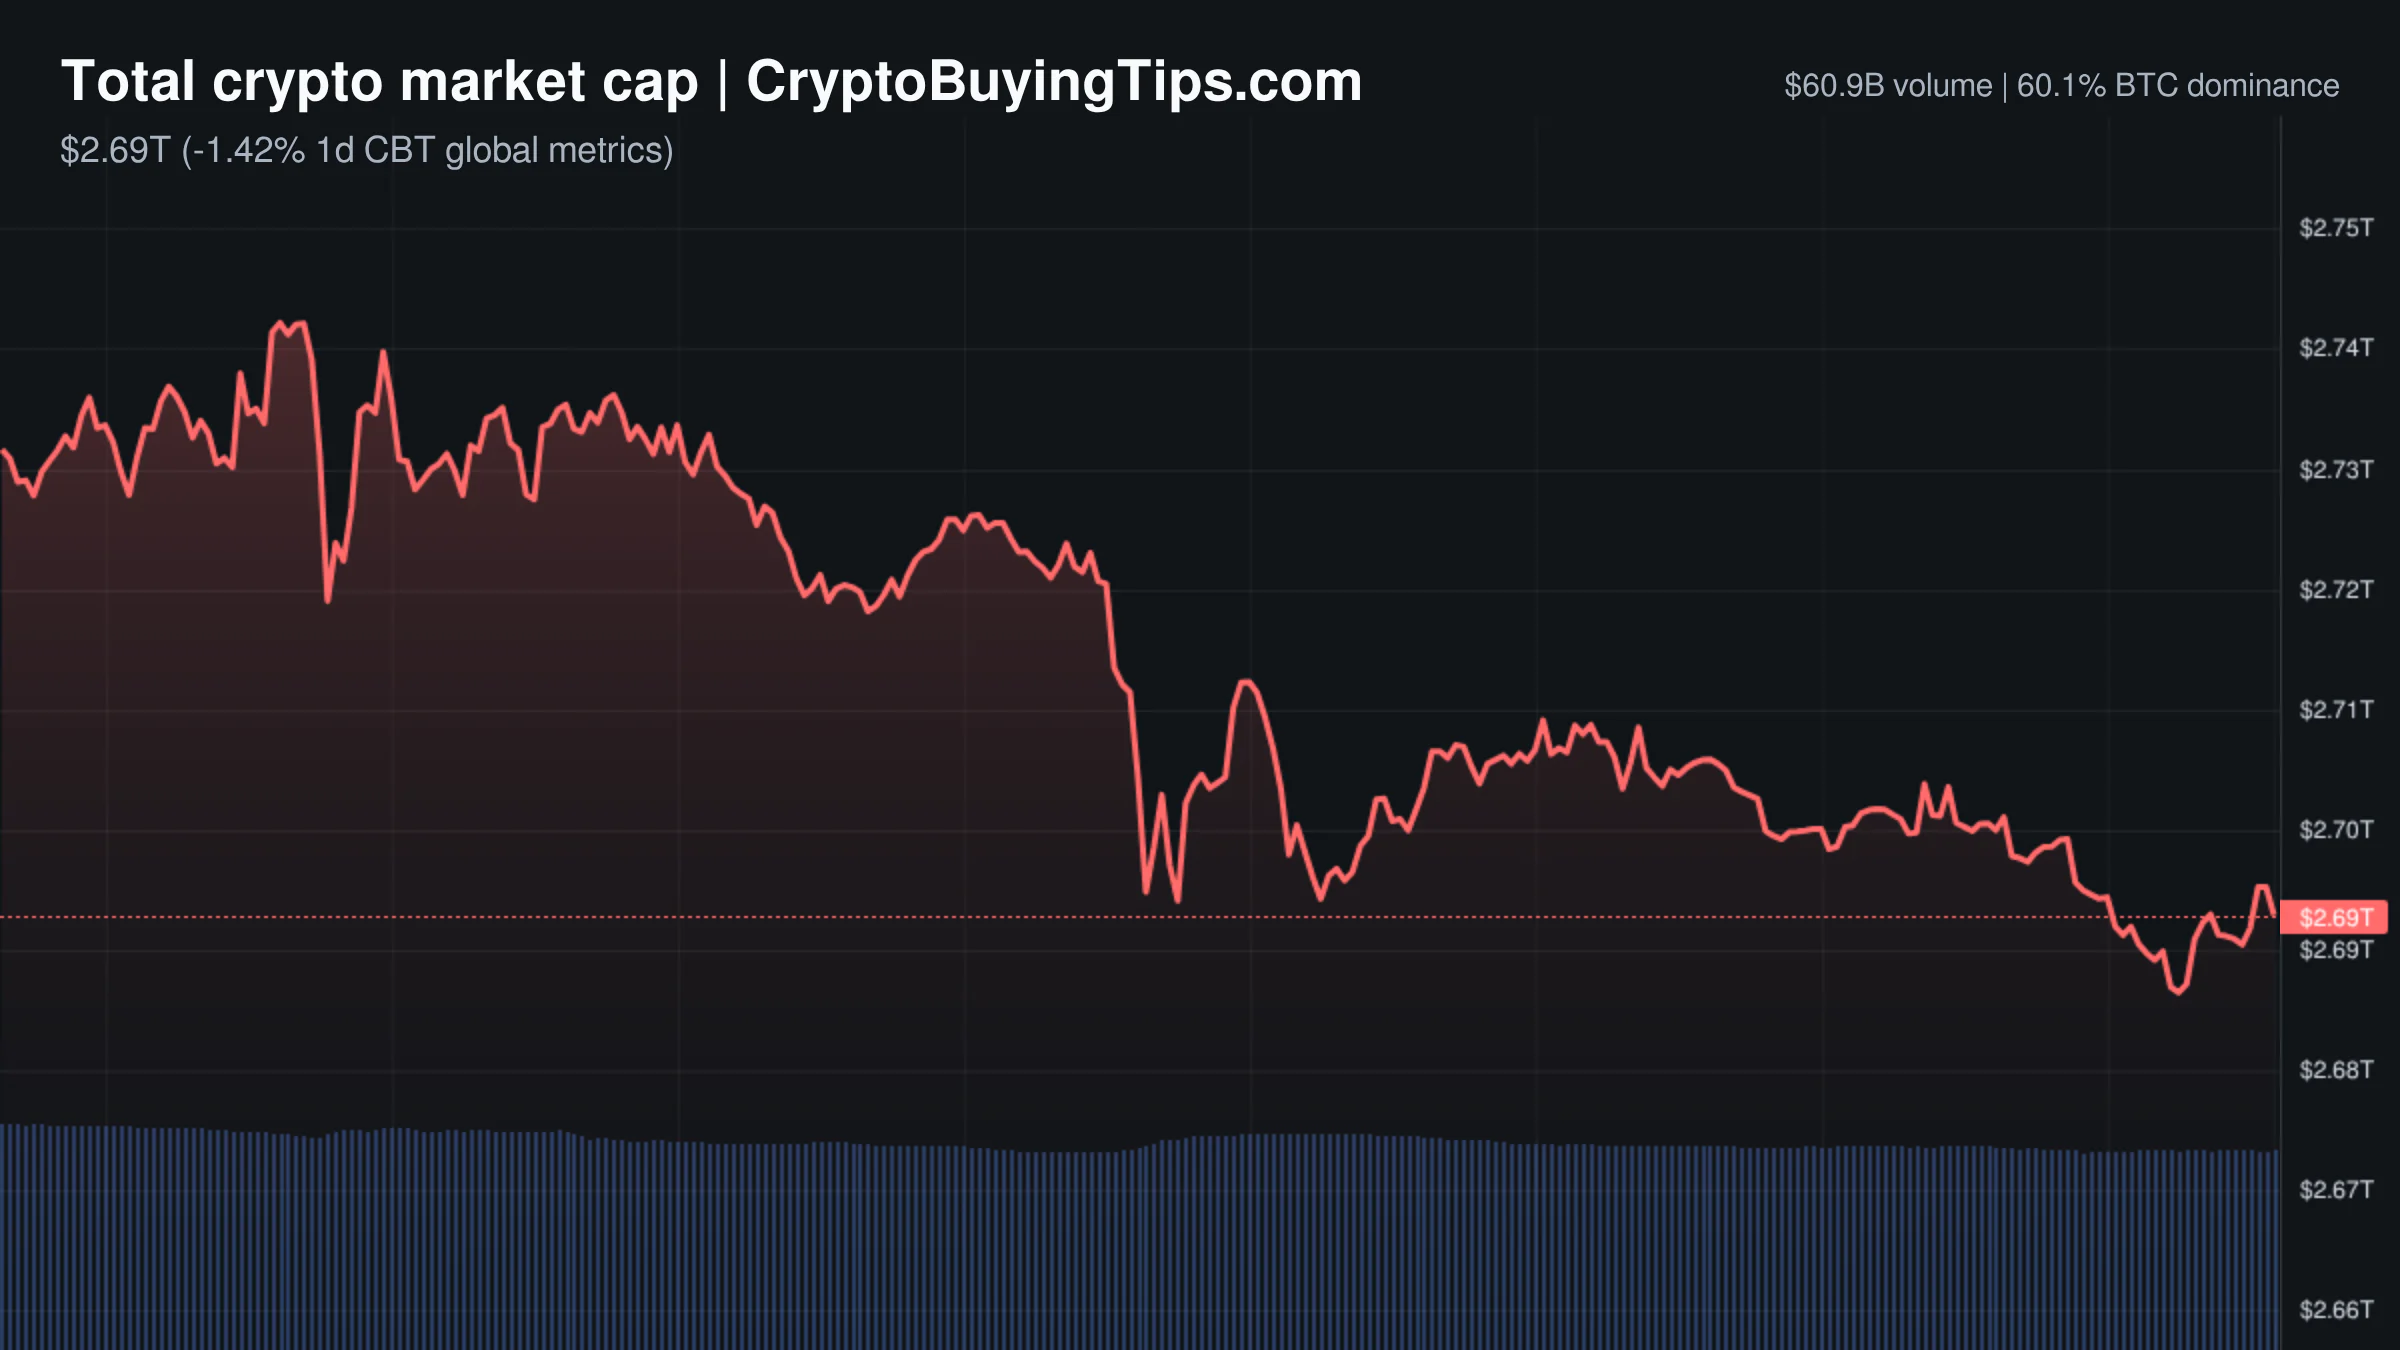
The market is currently in a state of profound hesitation. While the total crypto market cap sits at $2.69T, a 3.66% drop over the last 24 hours, the most telling metric is the collapse in volume. Spot volume has fallen by over 12% to $52.63B, and stablecoin volume has seen a similar double-digit retreat. When the money stops moving, it usually means the market is exhausted or terrified of the next candle. In this case, it is a bit of both.
The contrast between spot and derivatives is stark. Derivatives volume at $525B is roughly ten times larger than spot volume. This is a market driven by leveraged bets rather than asset accumulation. It is the financial equivalent of a casino where the gamblers are still betting heavily, but no one is actually buying the building.
Bitcoin dominance remains steady at 60.09%, while the CMC100 index is slightly negative. This confirms that capital is huddling in Bitcoin for safety while altcoins struggle to find a bid. With the Fear and Greed Index sitting at a neutral 45 and the Altcoin Season Index at 37, there is no clear directional catalyst. We are seeing a broad sideways drift with a bearish tilt, as the market weighs geopolitical shocks against institutional accumulation.
Bitcoin and Ethereum
Bitcoin is currently trading at $80,517.15. The asset briefly slipped below the $80,000 mark, a move that triggered $404 million in long liquidations in just four hours. This dip was largely driven by geopolitical instability, specifically reports of U.S. evacuations from the Middle East. However, the recovery back above $80k suggests that the dip was a liquidity grab rather than a trend reversal.
The institutional picture is mixed. Spot Bitcoin ETFs saw net outflows of $773 million over Thursday and Friday. This suggests that the institutional bid is wavering. On the other hand, entities like Strategy and Strive have financed the purchase of nearly 136,000 BTC, creating a funding channel that operates outside the ETF system. This tension between ETF selling and direct corporate buying is keeping the price pinned.
Ethereum is faring worse, trading at $2,339.67, down nearly 1% over the last day. The most alarming data point is the network activity. Gas fees are currently between 0.04 and 0.06 Gwei. These are exceptionally low levels that indicate a near-total lack of on-chain congestion. It is difficult to call a rally when the network is this quiet. ETH dominance is holding at 10.61%, but it lacks the relative strength seen in Bitcoin.
Top crypto prices
Beyond the two giants, the market is a patchwork of small gains and stagnation. BNB is one of the few leaders, trading at $742.45, up 1.56%. XRP has also seen a modest gain of 1.43%, bringing its price to $1.29. These moves appear isolated and lack a broader market narrative.
Solana is trading at $101.1, down 0.18%, while TRON sits at $0.3288, down 0.36%. Hyperliquid has managed a 1.04% gain to reach $76.3. The fact that HYPE is now a top 10 asset by market cap is a nod to the continued appetite for high-performance trading infrastructure, even when the rest of the market is asleep.
News driving today's market
The most significant institutional development comes from Hong Kong. HSBC has launched RedCoin, a licensed Hong Kong dollar stablecoin, integrating it into the PayMe app for 3.3 million users. This is a genuine shift in how stablecoins are deployed. Instead of living on exchanges for trading, these tokens are entering daily payment rails for lunch and shopping. We previously covered how Hong Kong licensed stablecoins, and this HSBC move is the first major evidence of that framework in action.
On the geopolitical front, Israeli Prime Minister Benjamin Netanyahu has floated the use of blockchain and cryptocurrency as a "national strategic tool" to circumvent potential international financial sanctions. This is a rare instance of a head of state explicitly discussing crypto as a tool for economic defense. While the move is politically charged, it highlights the growing view of decentralized assets as a hedge against state-level financial warfare. We previously covered stablecoin dominance in crypto for more background.
Conversely, the U.S. regulatory environment remains a drag. The failure of the Senate to advance the Clarity Act is causing concern. Apex Group CEO Peter Hughes suggests that this regulatory vacuum is pushing digital asset business toward Asia and the Middle East. This jurisdictional arbitrage is a risk for U.S.-based assets, as capital naturally flows toward certainty.
We also see continued resistance to tokenization from the corporate world. Companies like McDonalds, Microsoft, and Google have objected to being listed on tokenized securities venues. This is not necessarily a rejection of the technology, but rather a caution regarding the current SEC innovation exemptions. It suggests that the "tokenization of everything" narrative is hitting a wall of corporate legal departments.
Finally, the macro pressure from the Middle East continues to weigh on sentiment. The brief slide of Bitcoin below $80k was a direct result of evacuation news. This reminds us that while we talk about "digital gold," BTC still trades like a high-beta risk asset during geopolitical crises. When the world feels unstable, the first instinct for many is still to sell.
Social intelligence
The social feed is currently a mix of technical warnings and the usual analyst contradictions. Peter Schiff continues his tradition of being confidently wrong, claiming Bitcoin is "finally breaking down" toward $75k, even as the price sits comfortably above $80k. It is a comforting reminder that some voices are permanently tuned to the wrong frequency.
More useful is the analysis from CryptoQuant's Axel Adler. He noted that BTC closed at a 30-day low after bouncing off its 365-day moving average. Adler suggests that these tight, sideways ranges usually end with a sharp, violent move. Given the current volume collapse, the market is essentially a coiled spring.
We are also seeing strange patterns on the Robinhood Chain. Data suggests that nearly 60% of stock token trading there happens when Wall Street is closed, with $532 million traded on weekends over a single month. This points to a retail-driven, speculative flow that is completely decoupled from traditional market hours. It is a glimpse into a 24/7 financial system that doesn't care about the opening bell in New York.
Trading ideas worth watching
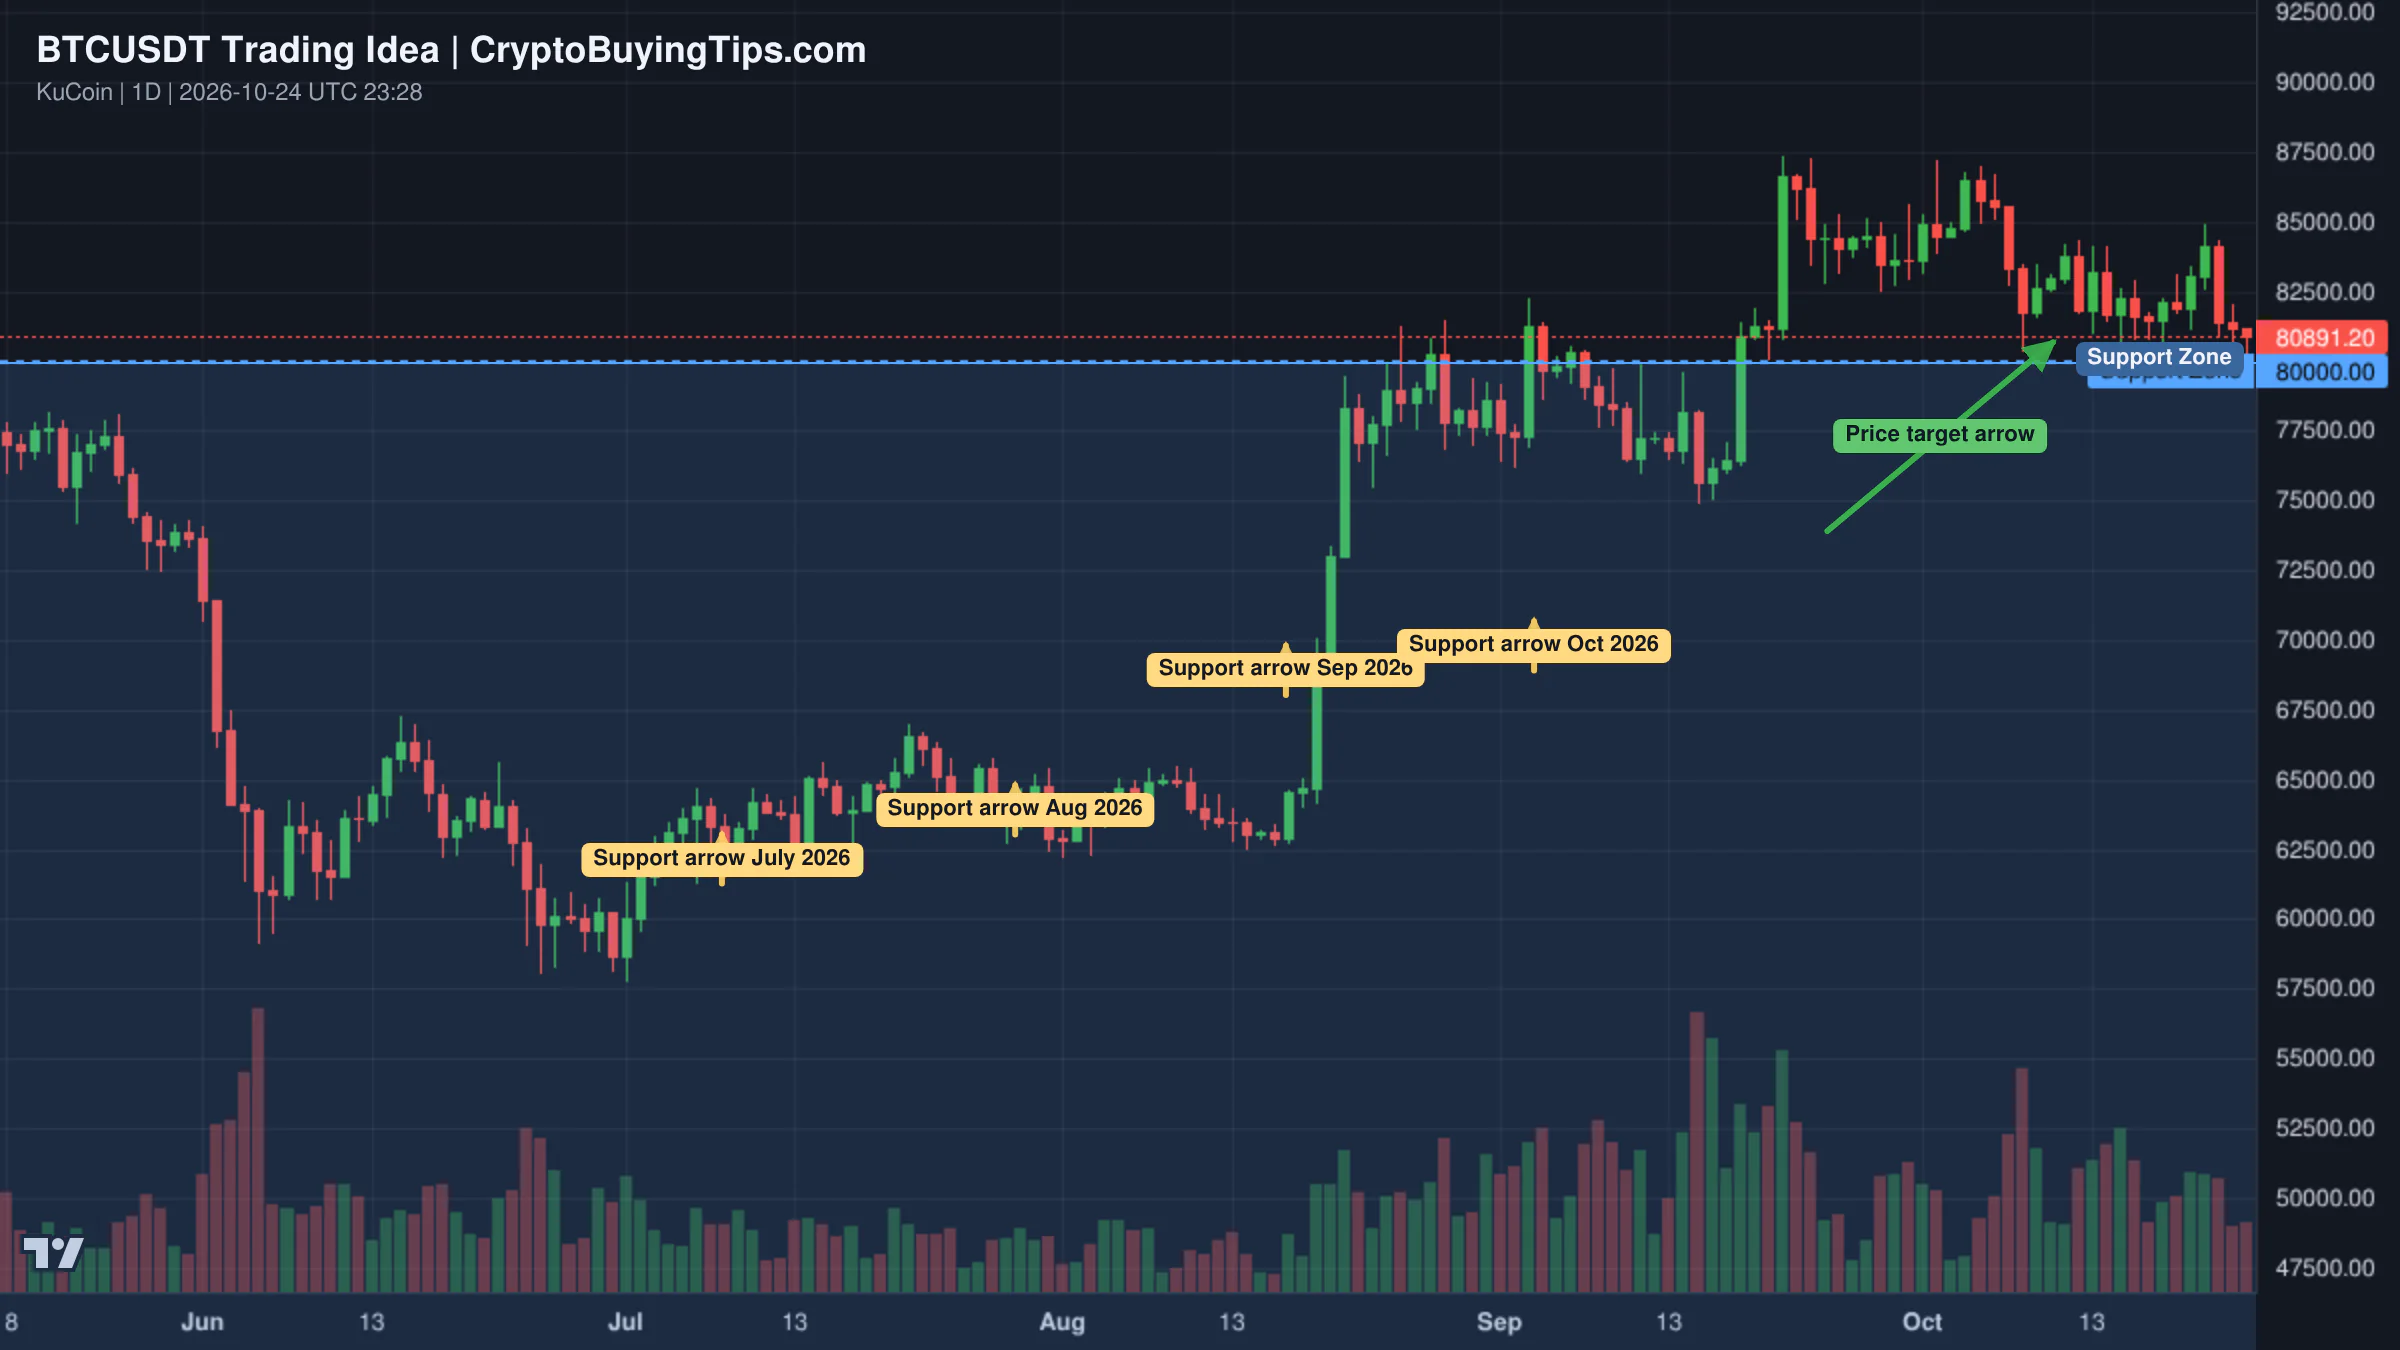
For Bitcoin, the focus is entirely on the $80,000 level. The asset has challenged this support multiple times and held. There is additional interest in the EMA377, a long-term moving average sitting around $79,000. The current sideways action right below resistance is often a precursor to a breakout, but the lack of volume makes this a risky bet. As long as BTC stays above $80k, the bias remains bullish, but a decisive close below $79k would invalidate the setup.
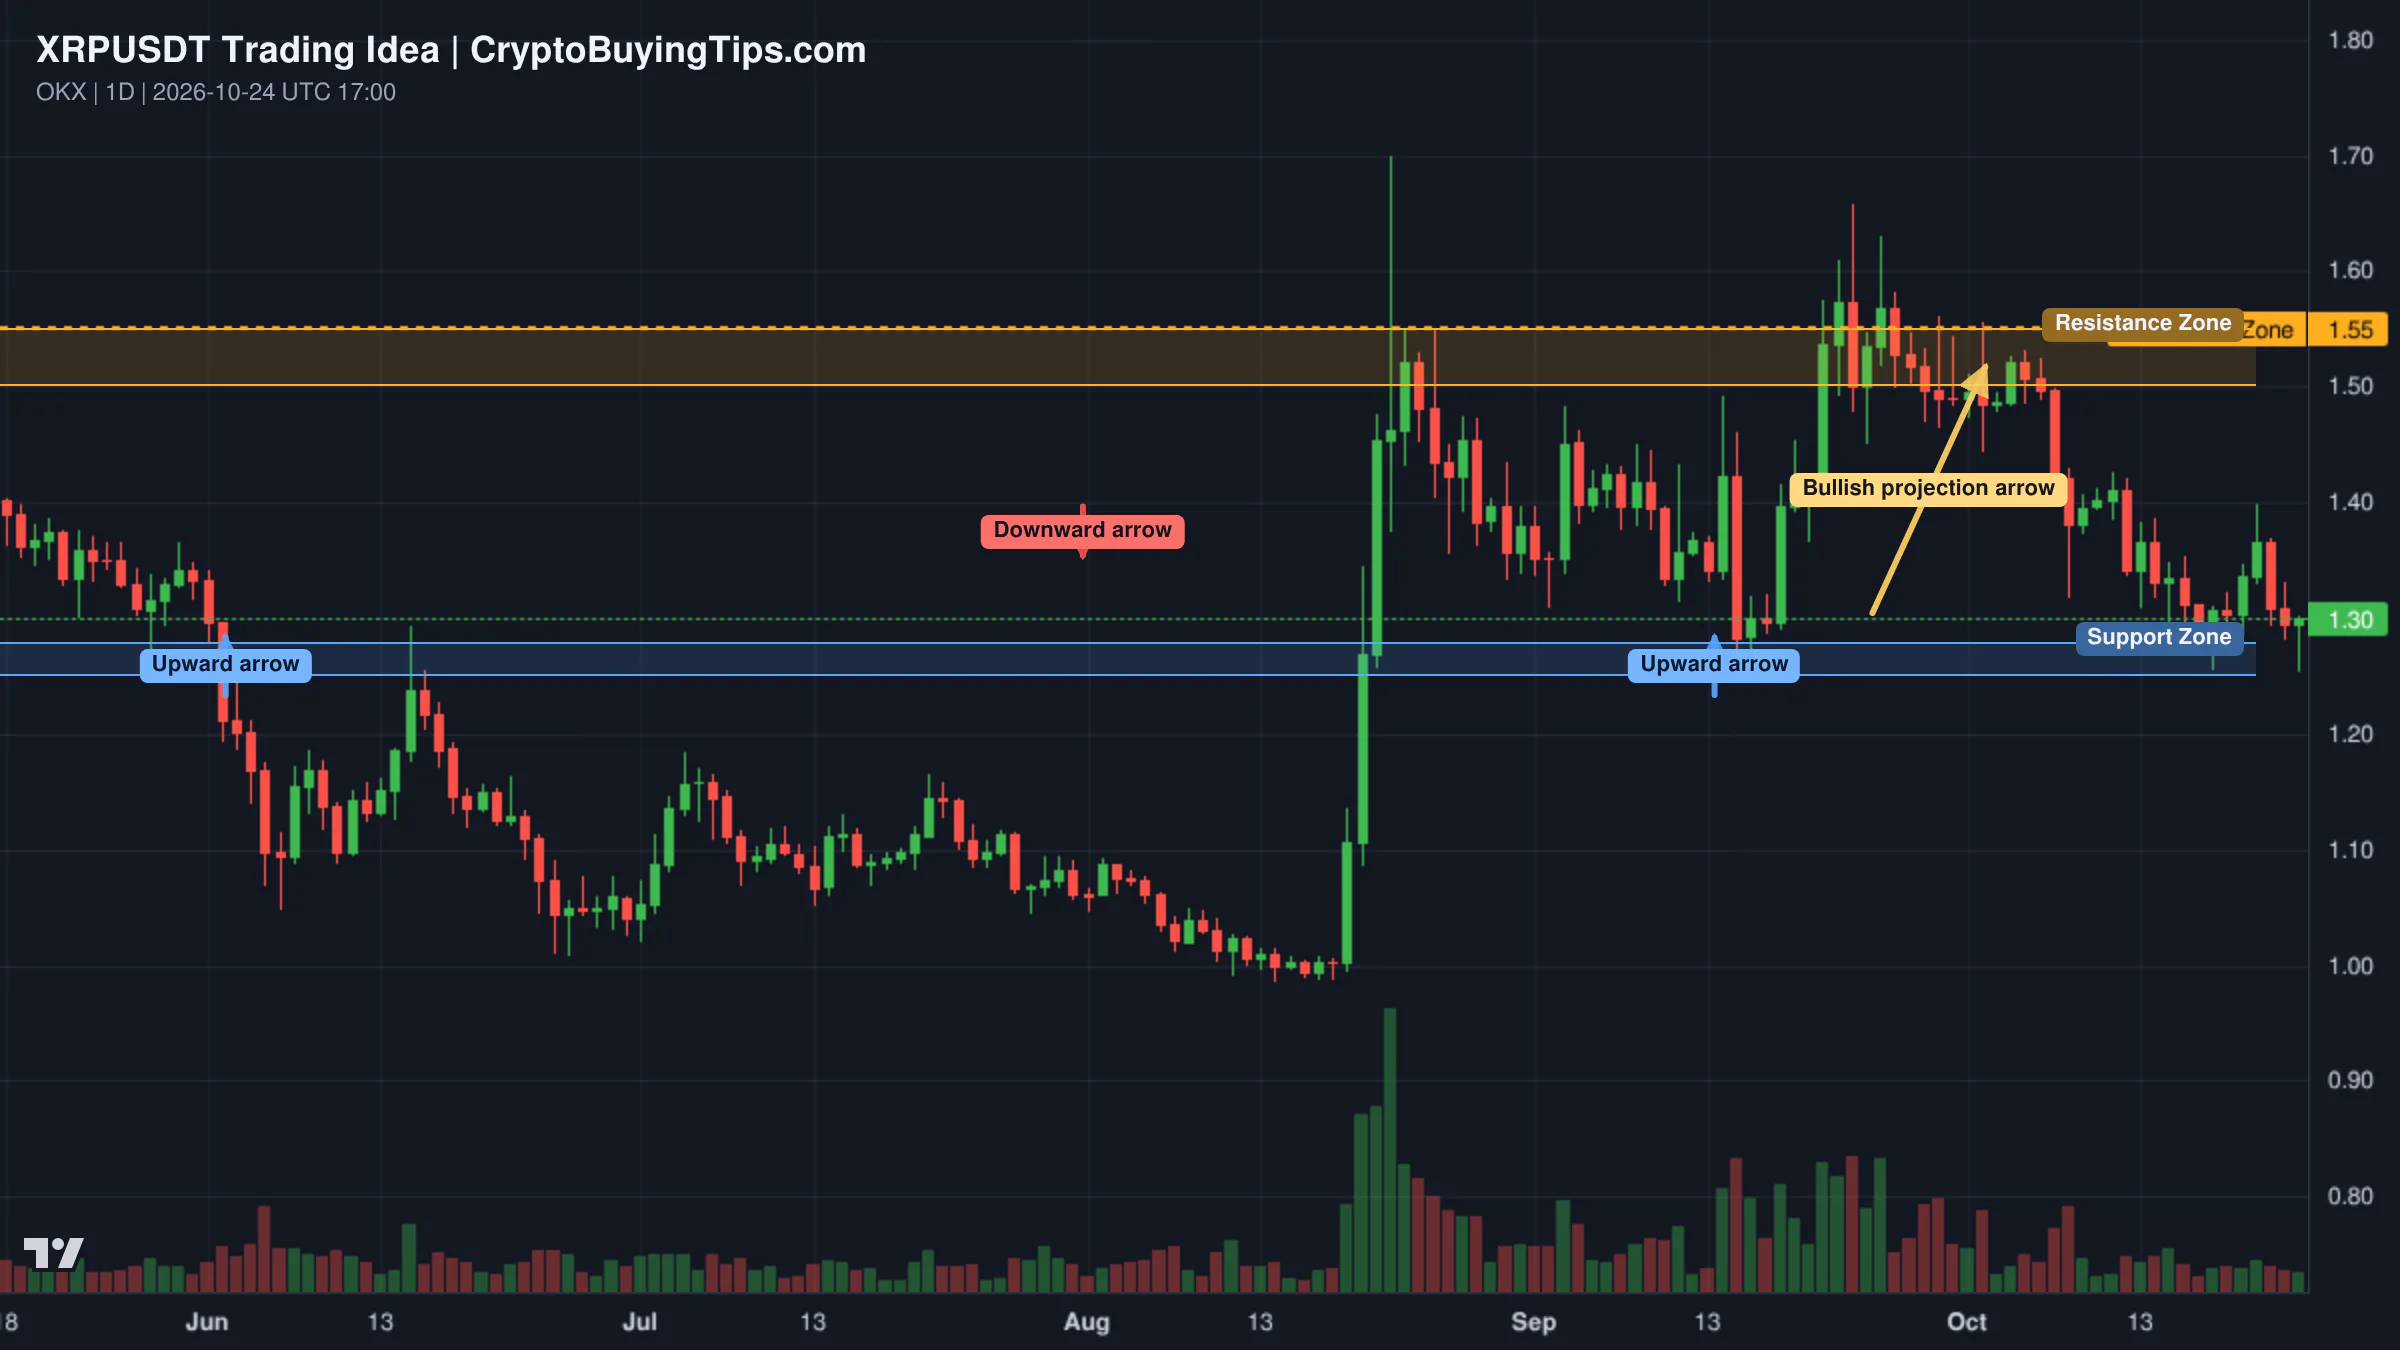
XRP is currently retesting a major weekly support zone between $1.25 and $1.28. This area has historically triggered strong bullish reactions. The asset has corrected from the $1.55 resistance, and the question now is whether buyers can defend this zone. A confirmed bullish rejection here could open a path back toward $1.50. However, a breakdown below $1.25 would shift the focus to much lower support levels.
Ethereum is testing a support range between $2,300 and $2,333. This zone aligns with the 0.382 Fibonacci retracement and several key moving averages, including the EMA144 and EMA233. The SMA200 is further down at $2,150. The asset has been sideways for over two months, which is a long time in this market cycle. While the current zone is holding, we expect a resolution to this structure after October 28th. A move above these averages would signal a bullish resumption.
Smart Money Signals — Hyperliquid Leaderboard
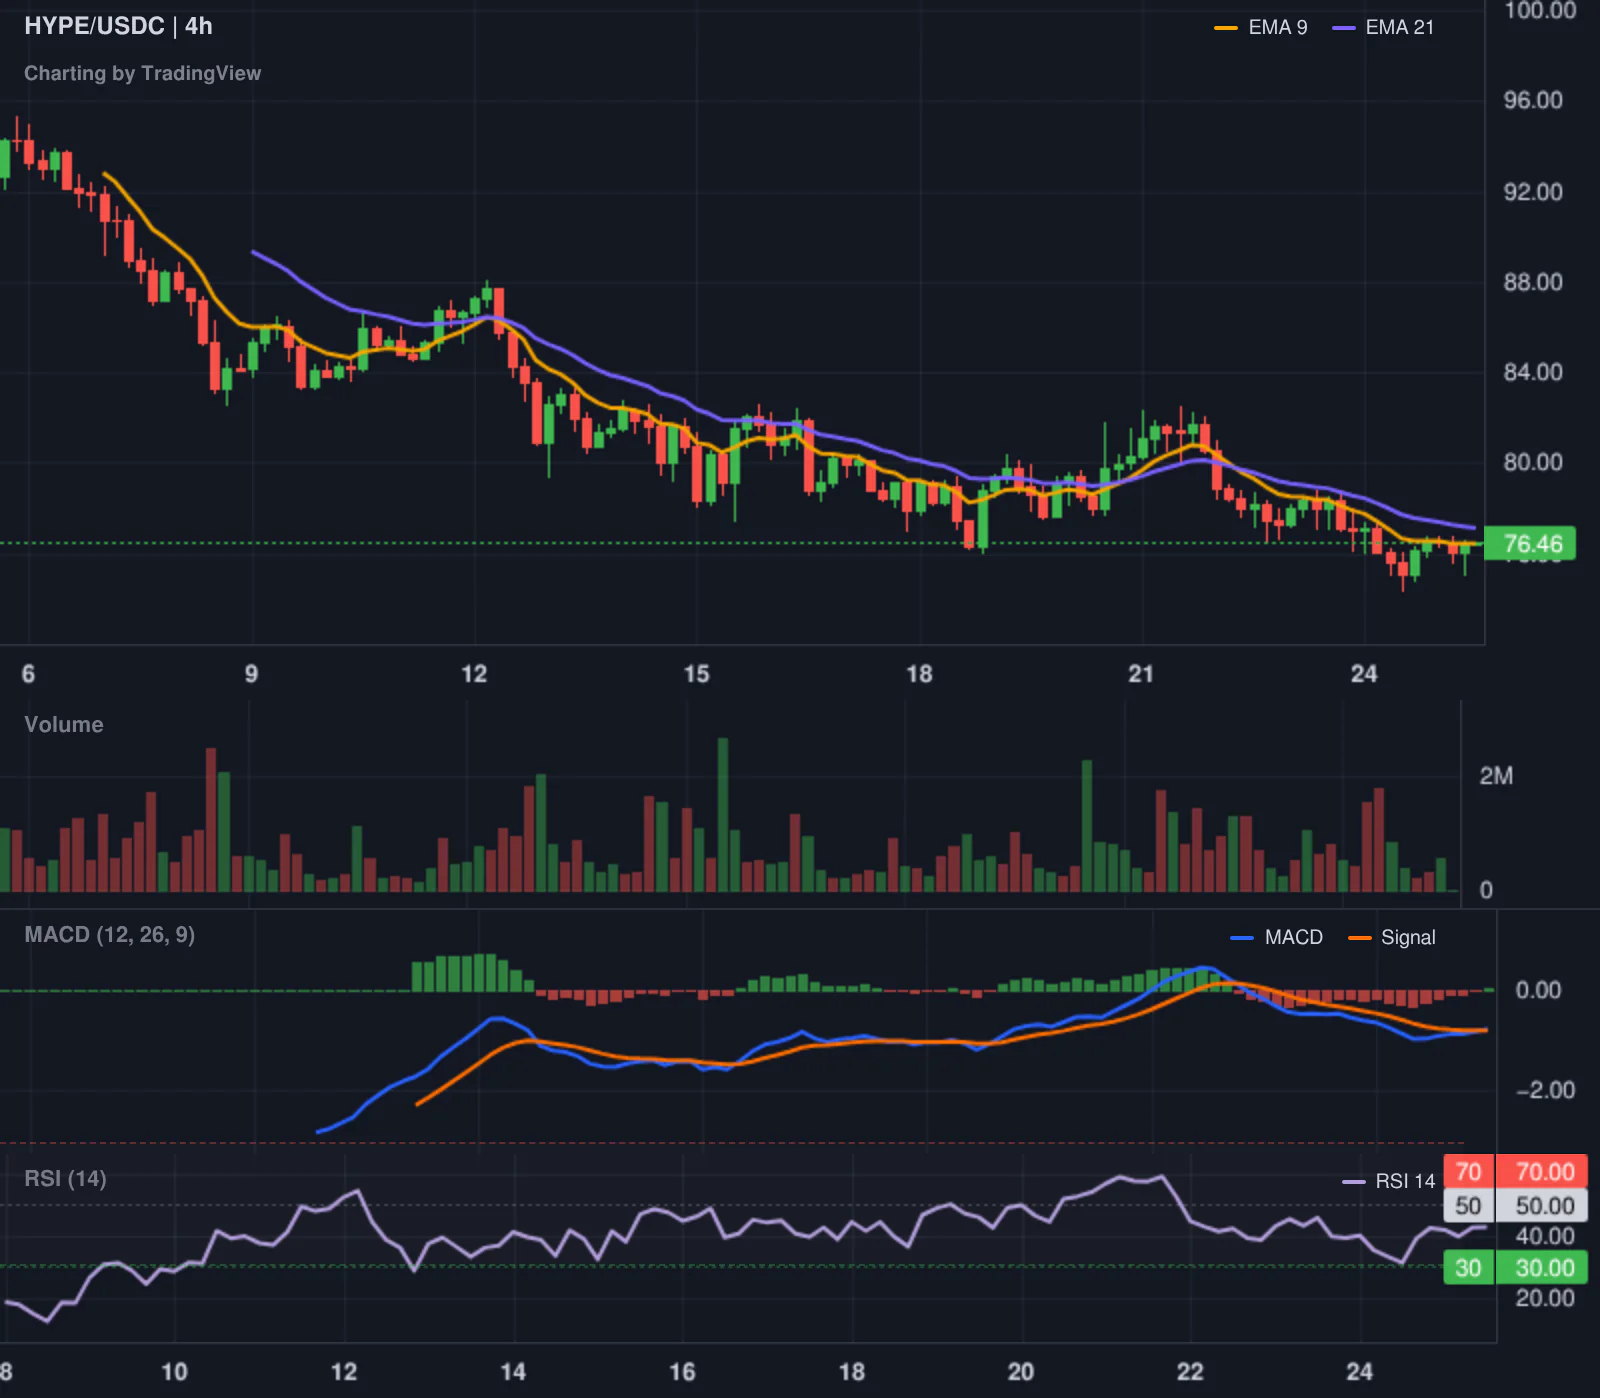
Our tracker has flagged a significant move from a top trader on Hyperliquid. Trader 0xb67c4c, who boasts a 119% 30-day ROI, has opened a short position in HYPE/USDC. The entry price was $75.256 with a notional value of $125,986.
This is a contrarian bet against one of the few gainers in the current market. Given that HYPE has recently climbed into the top 10, this trader may be betting on a mean reversion or a broader market flush. With a confidence score of 75, this is a position worth monitoring, especially if Bitcoin fails to hold the $80k mark.
What to watch next
The immediate focus is the $80,000 psychological level for Bitcoin. If the asset can stabilize here despite the ETF outflows, it proves that the non-ETF institutional bid is strong enough to absorb the selling. But the volume collapse is a warning. Trading in a vacuum of liquidity often leads to "flash" moves in either direction.
For Ethereum, the date to watch is October 28th. The current sideways drift is unsustainable, and we expect a breakout or breakdown shortly after. The lack of on-chain activity is the biggest headwind; until gas fees rise and people actually start using the network, any rally will be based on speculation rather than utility.
Finally, keep an eye on the stablecoin dominance. With USDT and USDC dominance at 9.43%, there is a significant amount of capital on the sidelines. The question is whether that money is waiting for a dip to buy or waiting for a reason to leave the market entirely. In this environment, we prefer to watch the volume. When the volume returns, the trend will be clear. Until then, the market is just noise and leverage.
Some links in this article may be affiliate links. We may earn a commission at no extra cost to you — this never influences our analysis or coverage.

Sigrid Voss
Crypto analyst and writer covering market trends, trading strategies, and blockchain technology.
More Articles

Stablecoins are leaving the exchanges. HSBC just proved it
The market seems preoccupied with leverage ratios while real money moves elsewhere; a major bank issuing licensed…
Crypto Market Overview | Derivatives volume dwarfs spot activity amid regulatory uncertainty and institutional outflows | October 24, 2026
Derivatives volume dwarfs spot activity amid regulatory uncertainty and institutional outflows, showing market…

Fidelity outflows and Ethereum OG dumps suggest a hidden exit
Another day of market data suggesting everything is fine until you look at the outflows and OG dumping. Institutional…
Crypto Market Overview | Leveraged bets surge amid regulatory clarity and institutional inflows | October 22, 2026
The market shows divergence between spot interest and leveraged bets amid regulatory clarity; see our overview here.